. 2021 Apr 21;11(5):745.
doi: 10.3390/diagnostics11050745.

Obesity Drives an Oral Microbiota Signature of Female Patients with Periodontitis: A Pilot Study

Affiliations

Obesity Drives an Oral Microbiota Signature of Female Patients with Periodontitis: A Pilot Study

Charlotte Thomas et al. Diagnostics (Basel). .

Abstract

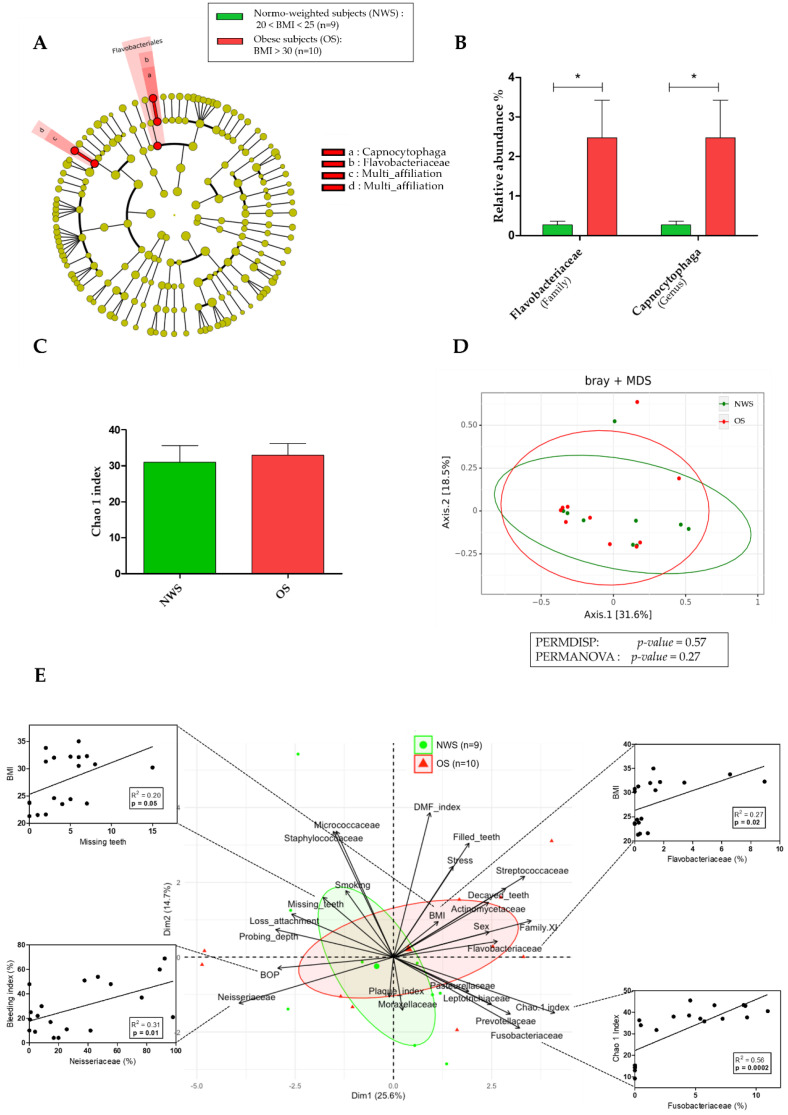
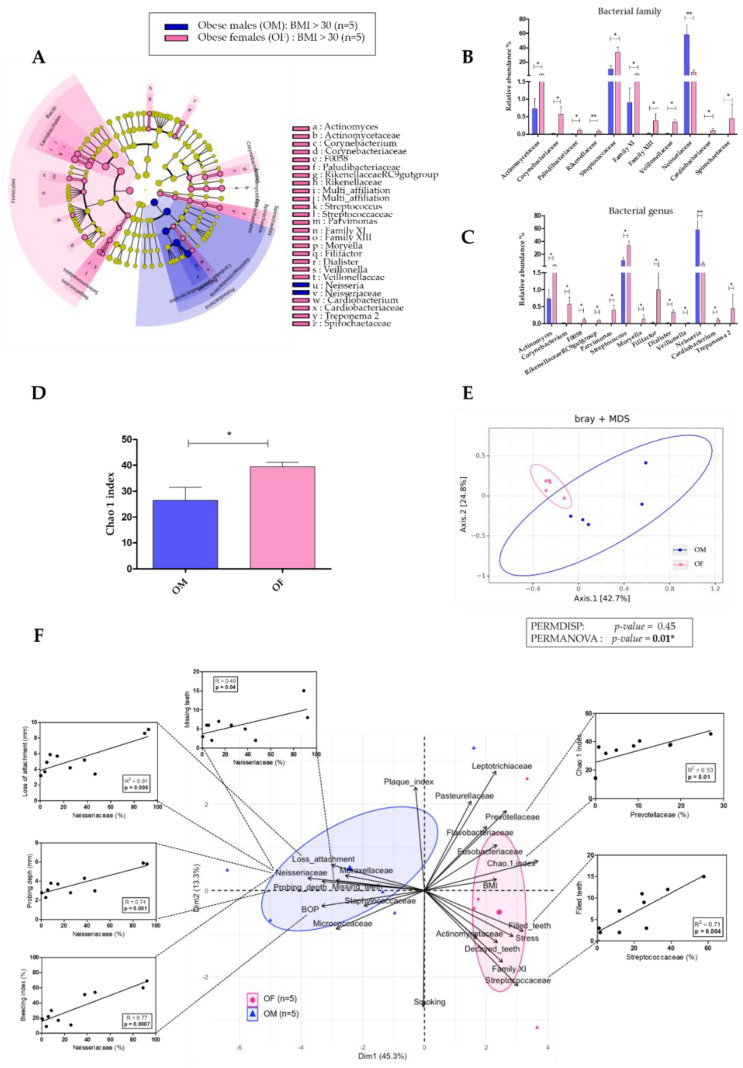
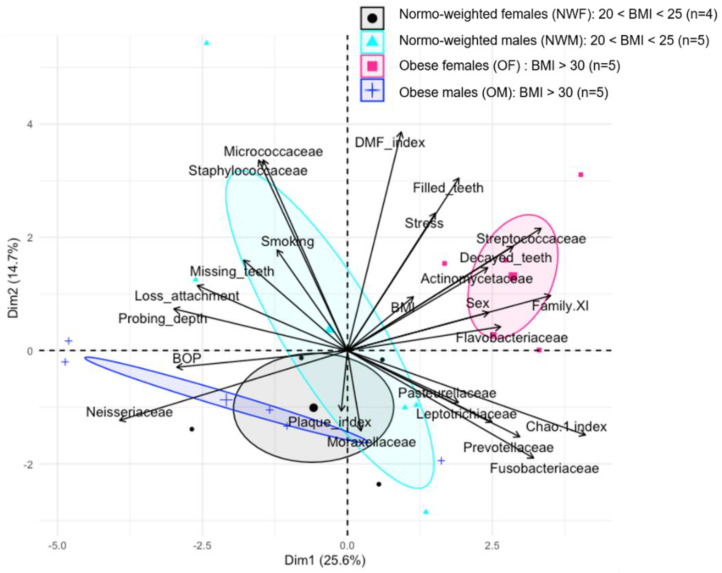
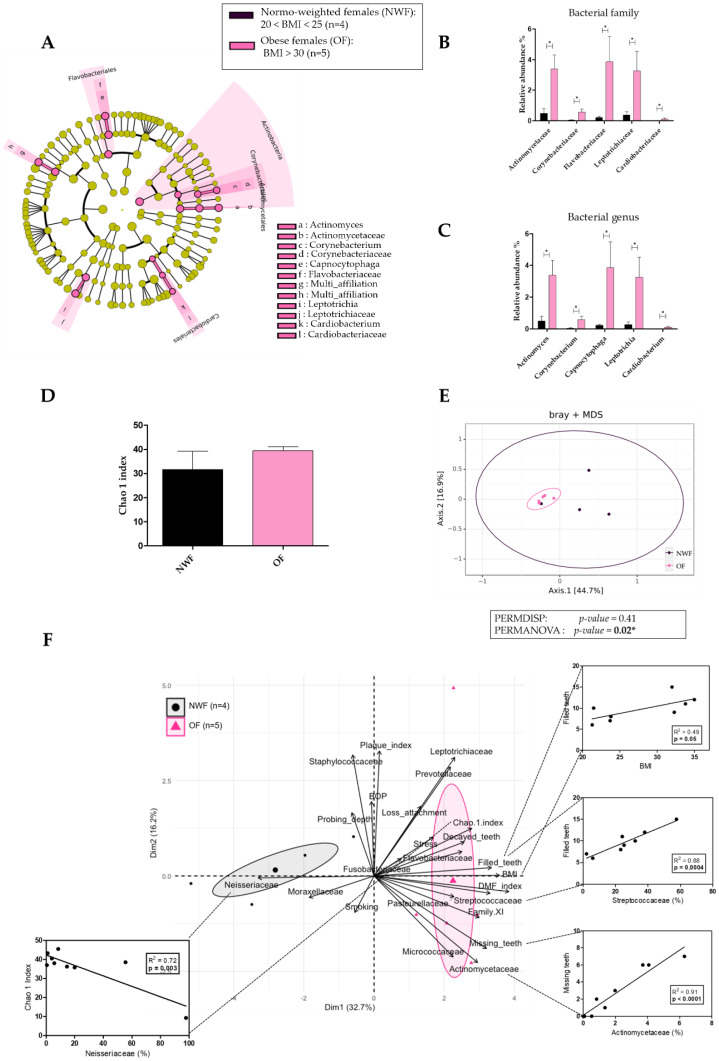
The aim of this study was to analyze the link between oral microbiota and obesity in humans. We conducted a pilot study including 19 subjects with periodontitis divided into two groups: normo-weighted subjects (NWS) with a body mass index (BMI) between 20 and 25 (n = 9) and obese subjects (OS) with a BMI > 30 (n = 10). Obesity was associated with a poor oral health status characterized by an increased number of missing teeth and a higher score of periodontal-support loss associated with dysbiotic oral microbiota (39.45 ± 3.74 vs. 26.41 ± 11.21, p = 0.03 for the Chao 1 index). Oral microbiota taxonomic analysis showed that the abundance of the Capnocytophaga genus was higher (2.47% ± 3.02 vs. 0.27% ± 0.29, p = 0.04) in OS compared to NWS. Obese females (OF) were characterized by an increase in the Streptococcus genus (34.12% ± 14.29 vs. 10.55% ± 10.42, p = 0.05) compared to obese males (OM), where the Neisseria genus was increased (5.75% ± 5.03 vs. 58.05% ± 30.64, p = 0.008). These first data suggest that sex/gender is determinant in the link between oral dysbiotic microbiota and obesity in patients with periodontitis. Our results could lead to recommendations concerning therapeutic strategies for obese patients with periodontitis following the sex/gender.

Keywords: dysbiosis; obesity; oral microbiota; periodontitis; sex/gender.


Conflict of interest statement

The authors declare that they have no competing interest and no conflict of interests.

Figures

Figure 1
Figure 1
Oral microbiota in obese subjects (OS; n = 10) compared to normo-weighted subjects (NWS; n = 9). (A) Linear discriminant analysis effect size (LEfSe) analysis-based cladogram for oral microbiota; (B) Relative abundance (%) for taxonomic family and genus, identified with significant differences in saliva microbiota; (C) Chao 1 index representation of alpha diversity; (D) Bray–Curtis index representation of the beta diversity between; (E) Principal Component Analysis (PCA) between dominant bacterial genera from oral microbiota and oral clinical parameters and Pearson’s correlation analysis. Data as mean ± SD, * p < 0.05, unpaired Mann–Whitney test.
Figure 2
Figure 2
Comparison of oral microbiota between obese males (OM; n = 5) and obese females (OF; n = 5). (A) Linear discriminant analysis effect size (LEfSe) analysis-based cladogram for oral microbiota; (B,C) Relative abundance (%) for taxonomic family and genus, identified with significant differences in saliva microbiota; (D) Chao 1 index representation of alpha diversity; (E) Bray–Curtis index representation of the beta diversity between; (F) Principal Component Analysis (PCA) and Pearson’s correlation analysis between dominant bacterial genera from oral microbiota and oral clinical parameters. Data as mean ± SD, * p < 0.05, ** p < 0.01, unpaired Mann–Whitney test.
Figure 3
Figure 3
Principal Component analysis (PCA) between dominant bacterial families from oral microbiota and oral clinical parameters in 4 groups: normo-weighted females (NWF; n = 4), normo-weighted males (NWM; n = 5), obese females (OF; n = 5), and obese males (OM; n = 5).
Figure 4
Figure 4
Comparison of oral microbiota between normo-weighted females (NWF; n = 4) and obese females (OF; n = 5). (A) Linear discriminant analysis effect size (LEfSe) analysis-based cladogram for oral microbiota; (B,C) Relative abundance (%) for taxonomic family and genus, identified with significant differences in saliva microbiota; (D) Chao 1 index representation of alpha diversity; (E) Bray–Curtis index representation of the beta diversity between; (F) Principal Component analysis (PCA) and Pearson’s correlation analysis between dominant bacterial genera from oral microbiota and oral clinical parameters. Data as mean ± SD, * p < 0.05, unpaired Mann–Whitney test.

References

    1. Eschwege E., Charles M., Basdevant A. ObEpi Enquête Epidémiologique Nationale Sur Le Surpoid et l’obésité. Inserm, Kanthar Healthe, Roche. [(accessed on 10 May 2020)];2012 Available online: https://www.roche.fr/content/dam/rochexx/roche-fr/roche_france/fr_FR/doc....
    1. Turnbaugh P.J., Ley R.E., Mahowald M.A., Magrini V., Mardis E.R., Gordon J.I. An Obesity-Associated Gut Microbiome with Increased Capacity for Energy Harvest. Nature. 2006;444:1027–1031. doi: 10.1038/nature05414. - DOI - PubMed
    1. Turnbaugh P.J., Ridaura V.K., Faith J.J., Rey F.E., Knight R., Gordon J.I. The Effect of Diet on the Human Gut Microbiome: A Metagenomic Analysis in Humanized Gnotobiotic Mice. Sci. Transl. Med. 2009;1:6ra14. doi: 10.1126/scitranslmed.3000322. - DOI - PMC - PubMed
    1. Le Chatelier E., Nielsen T., Qin J., Prifti E., Hildebrand F., Falony G., Almeida M., Arumugam M., Batto J.-M., Kennedy S., et al. Richness of Human Gut Microbiome Correlates with Metabolic Markers. Nature. 2013;500:541–546. doi: 10.1038/nature12506. - DOI - PubMed
    1. Ley R.E., Turnbaugh P.J., Klein S., Gordon J.I. Human Gut Microbes Associated with Obesity. Nature. 2006;444:1022–1023. doi: 10.1038/4441022a. - DOI - PubMed

LinkOut - more resources