. 2021 Apr 21;9(5):450.
doi: 10.3390/biomedicines9050450.

The Effects of Matriptase Inhibition on the Inflammatory and Redox Homeostasis of Chicken Hepatic Cell Culture Models

Affiliations

The Effects of Matriptase Inhibition on the Inflammatory and Redox Homeostasis of Chicken Hepatic Cell Culture Models

Réka Fanni Barna et al. Biomedicines. .

Abstract

The function of the transmembrane serine protease matriptase is well described in mammals, but it has not been elucidated in avian species yet. Hence, the aim of the present study was to assess the effects of the 3-amidinophenylalanine (3-AphA)-type matriptase inhibitors MI432 and MI460 on the inflammatory and oxidative state of chicken primary hepatocyte mono-cultures and hepatocyte-nonparenchymal cell co-cultures, the latter serving as a proper model of hepatic inflammation in birds. Cell cultures were exposed to MI432 and MI460 for 4 and 24 h at 10, 25, and 50 µM concentrations, and thereafter the cellular metabolic activity, extracellular interleukin (IL-)6, IL-8, H2O2 and malondialdehyde concentrations were monitored. Both inhibitors caused a transient moderate reduction in the metabolic activity following 4 h exposure, which was restored after 24 h, reflecting the fast hepatic adaptation potential to matriptase inhibitor administration. Furthermore, MI432 triggered an intense elevation in the cellular proinflammatory IL-6 and IL-8 production after both incubation times in all concentrations, which was not coupled to enhanced oxidative stress and lipid peroxidation based on unchanged H2O2 production, malondialdehyde levels and glutathione peroxidase activity. These data suggest that physiological matriptase activities might have a key function in retaining the metabolic and inflammatory homeostasis of the liver in chicken, without being a major modulator of the hepatocellular redox state.

Keywords: liver; oxidative stress; poultry; proinflammatory cytokines; serine proteases.


Conflict of interest statement

The authors declare no conflict of interest. The funders had no role in the design of the study; in the collection, analyses, or interpretation of data; in the writing of the manuscript; or in the decision to publish the results.

Figures

Figure 1
Figure 1
Giemsa staining of hepatocyte mono-cultures (A) and hepatocyte–nonparenchymal cell co-cultures (B) after 48 h culturing (20× magnification, bar = 100 µm).
Figure 2
Figure 2
Structures of the used matriptase inhibitors.
Figure 3
Figure 3
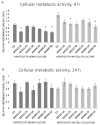
The effects of MI432 and MI460 inhibitors on the metabolic activity of hepatocyte mono-cultures and hepatocyte–NP cell co-cultures after 4 (A) and 24 (B) h of incubation at 10, 25, and 50 µM concentrations, assessed by a CCK-8 test. p values belonging to significant differences: mono-cultures, 4 h: pMI432 10 µM = 0.0131; pMI460 25 µM = 0.0197; pMI460 50 µM = 0.0111; co-cultures, 4 h: pMI432 25 µM = 0.0457; pMI460 50 µM = 0.0187. Relative absorbance values were calculated by considering the mean absorbance of control hepatocyte mono-cultures at 4 h as 1 (mean ± SEM; nctr = 6, nMI = 3/group; * p < 0.05).
Figure 4
Figure 4
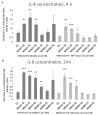
The effects of MI432 and MI460 on the IL-6 production of hepatocyte mono-cultures and hepatocyte–NP cell co-cultures after 4 (A) and 24 (B) h of treatment at 10, 25, and 50 µM, assessed by the ELISA method. p values belonging to significant differences: mono-cultures, 4 h: pMI432 10 µM = 0.0115; pMI432 25 µM = 0.0006; pMI432 50 µM < 0.0001; co-cultures, 4 h: pMI432 25 µM = 0.0269; pMI432 50 µM = 0.0421; mono-cultures, 24 h: pMI432 10 µM = 0.0116; pMI432 25 µM = 0.0004; pMI432 50 µM = 0.0021; co-cultures, 24 h: pMI432 10 µM = 0.0018; pMI432 25 µM < 0.0001; pMI432 50 µM = 0.0004; pMI460 25 µM = 0.0346. Relative concentrations were calculated by considering the mean concentration of control hepatocyte mono-cultures at 4 h as 1 (mean ± SEM; nctr = 6, nMI = 3/group; * p < 0.05; ** p < 0.01; *** p < 0.001).
Figure 5
Figure 5
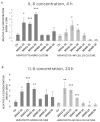
The effects of MI432 and MI460 on the IL-8 production of hepatocyte mono-cultures and hepatocyte–NP cell co-cultures after 4 (A) and 24 (B) h of treatment at 10, 25, and 50 µM, assessed by the ELISA method. p values belonging to significant differences: mono-cultures, 4 h: pMI432 10 µM = 0.0011; pMI432 25 µM = 0.0019; pMI432 50 µM = 0.0068; co-cultures, 4 h: pMI432 10 µM = 0.0022; pMI432 25 µM = 0.0001; pMI432 50 µM = 0.0231; mono-cultures, 24 h: pMI432 10 µM < 0.0001; pMI432 25 µM < 0.0001; pMI432 50 µM = 0.0010; pMI460 10 µM = 0.0097; co-cultures, 24 h: pMI432 10 µM = 0.0003; pMI432 25 µM < 0.0001; pMI432 50 µM = 0.0179. Relative concentrations were calculated by considering the mean concentration of control hepatocyte mono-cultures at 4 h as 1 (mean ± SEM; nctr = 6, nMI = 3/group; * p < 0.05; ** p < 0.01; *** p < 0.001).
Figure 6
Figure 6
The effects of MI432 and MI460 on the extracellular H2O2 levels of hepatocyte mono-cultures and hepatocyte–NP cell co-cultures after 4 (A) and 24 (B) h of treatment at 10, 25, and 50 µM, assessed by the Amplex Red method. p values belonging to significant differences: mono-cultures, 4 h: pMI432 25 µM = 0.0268; pMI432 50 µM = 0.0045; co-cultures, 4 h: p460 10 µM = 0.0048; co-cultures, 24 h: p460 10 µM = 0.0199. Relative fluorescence intensities were calculated by considering the mean fluorescence intensity of control hepatocyte mono-cultures at 4 h as 1 (mean ± SEM; nctr = 6, nMI = 3/group; * p < 0.05; ** p < 0.01).
Figure 7
Figure 7
The effects of MI432 and MI460 on the malondialdehyde (MDA) concentration of hepatocyte mono-cultures and hepatocyte–NP cell co-cultures after 4 (A) and 24 (B) h of treatment at 10, 25, and 50 µM, assessed by a specific colorimetric assay kit. p value belonging to the significant difference: mono-cultures, 4 h: pMI432 25 μM = 0.0146. Relative absorbance values were calculated by considering the mean absorbance value of control hepatocyte mono-cultures at 4 h as 1 (mean ± SEM; nctr = 6, nMI = 3/group; * p < 0.05).
Figure 8
Figure 8
The effects of MI432 and MI460 on the glutathione peroxidase (GPx) activity of hepatocyte mono-cultures and hepatocyte–NP cell co-cultures after 24 h of treatment at 10, 25, and 50 µM, assessed by a specific colorimetric assay kit. p values belonging to the significant differences: mono-cultures: pMI460 50μM = 0.0446; co-cultures: pMI460 50 μM = 0.0273. Relative activity values were calculated by considering the mean of control hepatocyte mono-cultures as 1 (mean ± SEM; nctr = 6, nMI = 3/group; * p < 0.05).

Similar articles

Cited by

References

    1. Bugge T.H., Antalis T.M., Wu Q. Type II transmembrane serine proteases. J. Biol. Chem. 2009;284:23177–23181. doi: 10.1074/jbc.R109.021006. - DOI - PMC - PubMed
    1. Shi Y.E., Torri J., Yieh L., Wellstein A., Lippman M.E., Dickson R.B. Identification and characterization of a novel matrix-degrading protease from hormone-dependent human breast cancer cells. Cancer Res. 1993;53:1409–1415. - PubMed
    1. Oberst M.D., Singh B., Ozdemirli M., Dickson R.B., Johnson M.D., Lin C.Y. Characterization of matriptase expression in normal human tissues. J. Histochem. Cytochem. 2003;51:1017–1025. doi: 10.1177/002215540305100805. - DOI - PubMed
    1. Hooper J.D., Campagnolo L., Goodarzi G., Truong T.N., Stuhlmann H., Quigley J.P. Mouse matriptase-2: Identification, characterization and comparative mRNA expression analysis with mouse hepsin in adult and embryonic tissues. Biochem. J. 2003;373:689–702. doi: 10.1042/bj20030390. - DOI - PMC - PubMed
    1. List K., Haudenschild C.C., Szabo R., Chen W., Wahl S.M., Swaim W., Engelholm L.H., Behrendt N., Bugge T.H. Matriptase/MT-SP1 is required for postnatal survival, epidermal barrier function, hair follicle development, and thymic homeostasis. Oncogene. 2002;21:3765–3779. doi: 10.1038/sj.onc.1205502. - DOI - PubMed

LinkOut - more resources