. 2021 Apr 14;13(8):1872.
doi: 10.3390/cancers13081872.

Standing Variations Modeling Captures Inter-Individual Heterogeneity in a Deterministic Model of Prostate Cancer Response to Combination Therapy

Affiliations

Standing Variations Modeling Captures Inter-Individual Heterogeneity in a Deterministic Model of Prostate Cancer Response to Combination Therapy

Harsh Vardhan Jain et al. Cancers (Basel). .

Abstract

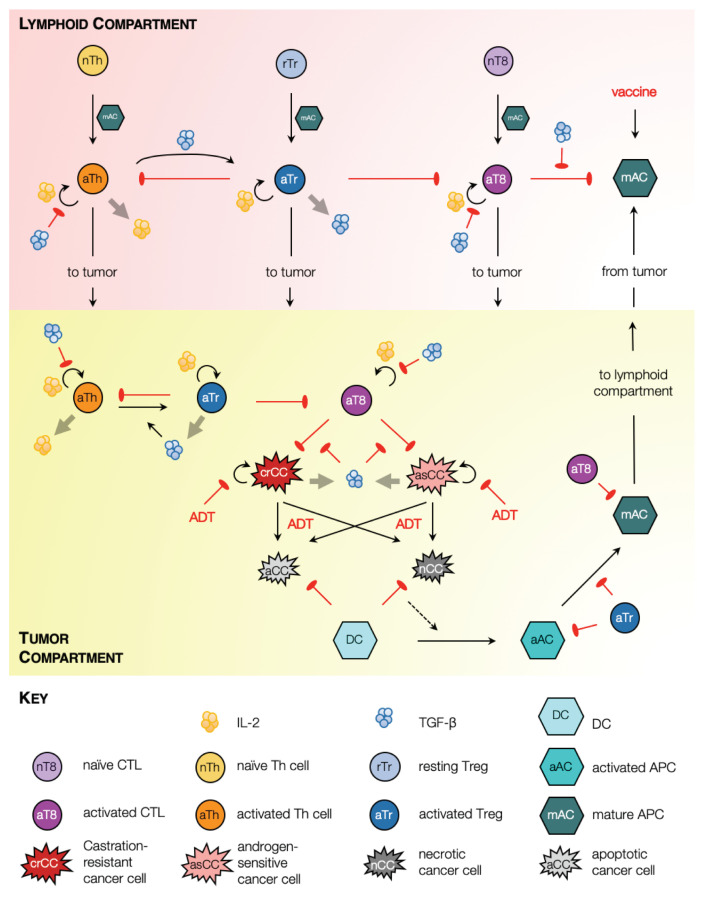
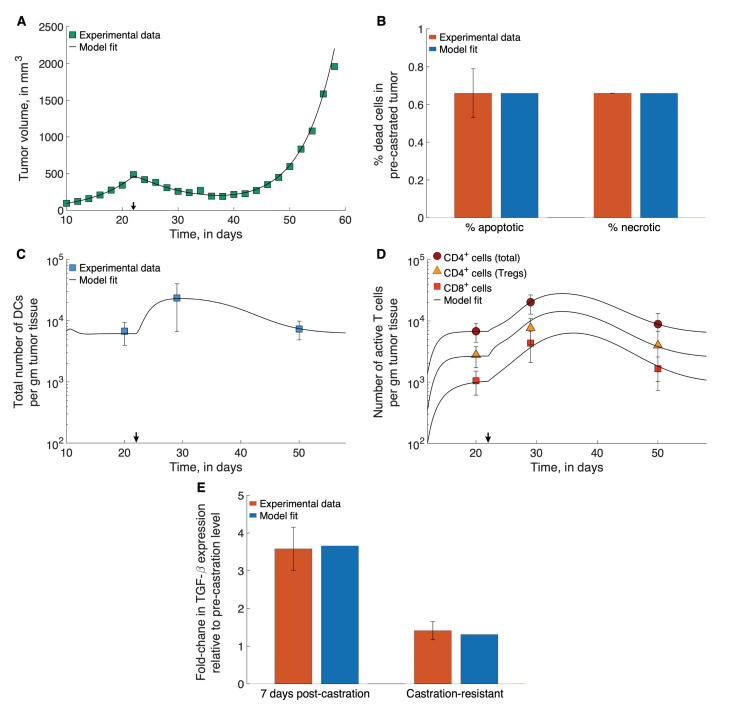
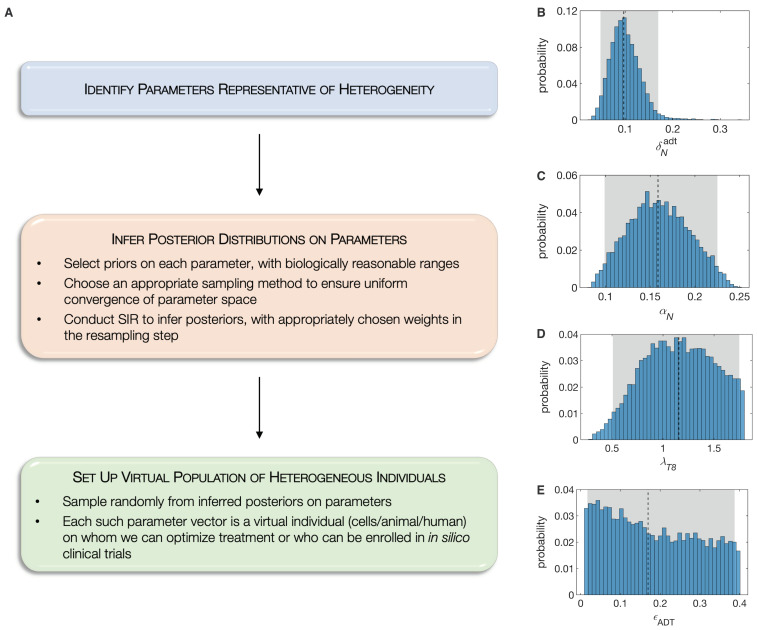
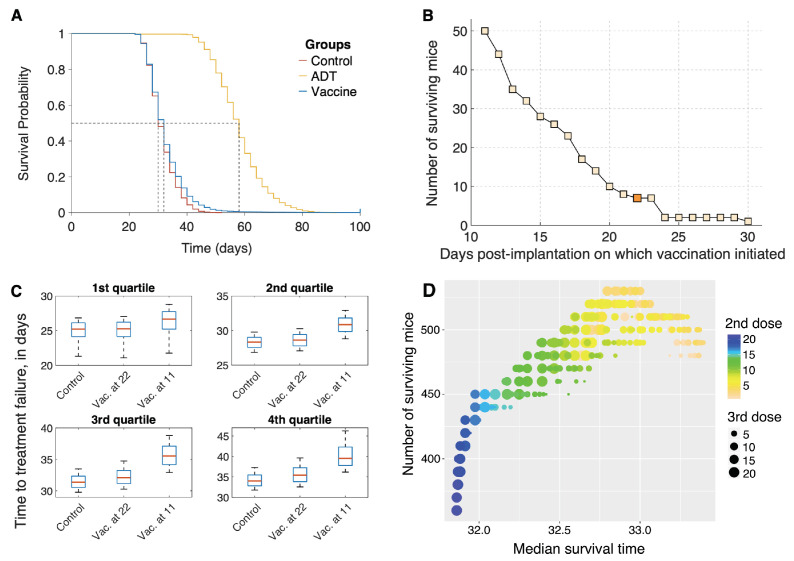
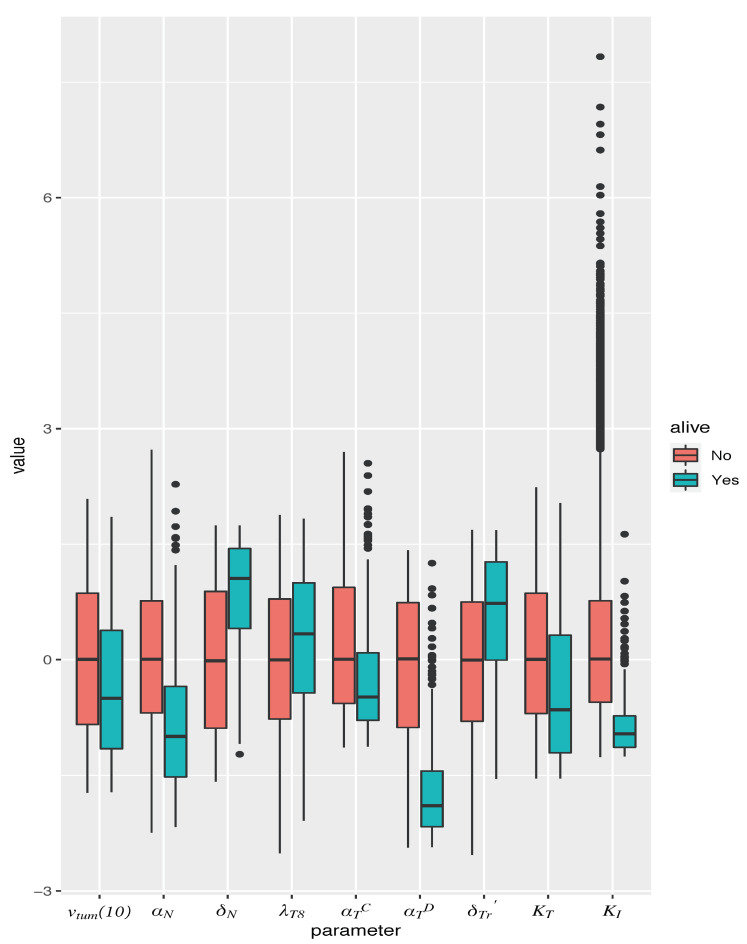
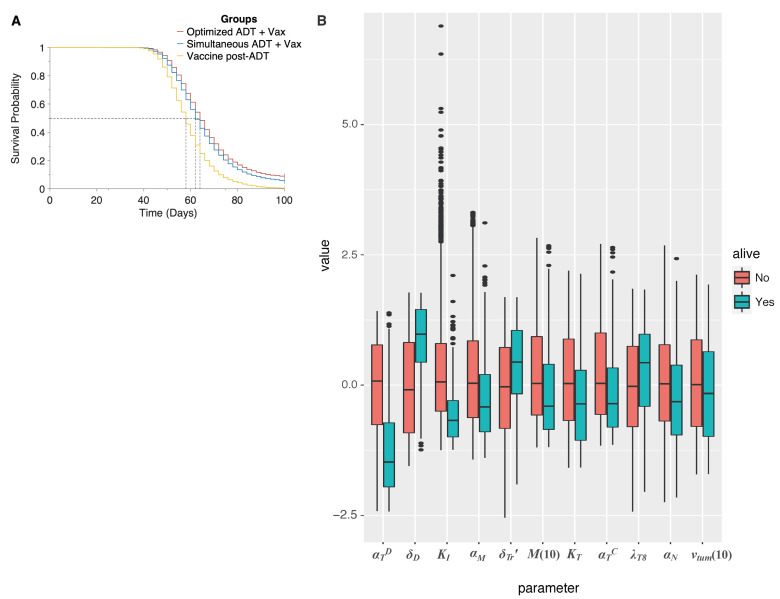
Sipuleucel-T (Provenge) is the first live cell vaccine approved for advanced, hormonally refractive prostate cancer. However, survival benefit is modest and the optimal combination or schedule of sipuleucel-T with androgen depletion remains unknown. We employ a nonlinear dynamical systems approach to modeling the response of hormonally refractive prostate cancer to sipuleucel-T. Our mechanistic model incorporates the immune response to the cancer elicited by vaccination, and the effect of androgen depletion therapy. Because only a fraction of patients benefit from sipuleucel-T treatment, inter-individual heterogeneity is clearly crucial. Therefore, we introduce our novel approach, Standing Variations Modeling, which exploits inestimability of model parameters to capture heterogeneity in a deterministic model. We use data from mouse xenograft experiments to infer distributions on parameters critical to tumor growth and to the resultant immune response. Sampling model parameters from these distributions allows us to represent heterogeneity, both at the level of the tumor cells and the individual (mouse) being treated. Our model simulations explain the limited success of sipuleucel-T observed in practice, and predict an optimal combination regime that maximizes predicted efficacy. This approach will generalize to a range of emerging cancer immunotherapies.

Keywords: ADT; immunotherapy; mathematical model; prostate cancer; provenge; standing variations.


Conflict of interest statement

The authors declare no conflict of interest.

Figures

Figure 1
Figure 1
Model schematic. Solid black arrows indicate transformation of one species to another, or transport of species. Semi-circular black arrows indicate proliferation. Red arrows with flat heads indicate inhibition or cell kill. Light grey arrows indicate expression of chemokines.
Figure 2
Figure 2
Model fits to data. (A) Model fitted to time-course treatment data on PCa xenograft volume, showing spontaneous emergence of castration resistance (black arrow indicates onset of ADT). (B) Model fitted to data on degree of apoptosis and necrosis in PCa xenografts, in the absence of treatment. (C,D) Model fitted to time-course treatment data on PCa xenograft immune cell infiltration (black arrow indicates onset of ADT). (E) Model fitted to fold-changes in TGF-β expression within the xenografts 7-days post-ADT administration, and after the emergence of castration-resistance. Data were taken from [16,60,61].
Figure 3
Figure 3
(A), The Standing Variations Modeling methodology. Representative inferred posterior distributions of model parameters, namely: (B), δNadt, ADT-induced death rate of androgen sensitive cancer cells; (C), αN, proliferation rate of androgen sensitive cancer cell; (D), λT8, maximum rate of naïve CD8+ T cell activation by mature APCs; and (E), ϵADT, fraction of ADT-induced cell death that is necrotic. Shown also are 95% confidence bounds (shaded gray areas) and median values (dashed black lines).
Figure 4
Figure 4
(A) Overall survival of simulated mice from time of therapy initiation. (B) Predicted number of mice that are alive at the end of the in silico trial (100 days), as a function of time post-xenograft implantation when first dose of sipuleucel-T was administered. Three total doses of vaccine were administered, given weekly. Dark shaded square corresponds to blue survival curve shown in panel (A). (C) Box plots of time to treatment failure (inter-quartile range and median) for the same simulated mice untreated (control), or recieving vaccination starting at either 22 or 11 days. Each subpanel corresponds to independent quartiles of the three strategies. (D) Optimization of sipuleucel-T scheduling. 3 total doses of vaccine were administered, with time of treatment initiation fixed at day 11 post-xenograft implantation, and times between second and third doses allowed to vary.
Figure 5
Figure 5
Box plot of parameter values in simulated mice, giving median and inter-quartile range. Parameters are normalized to mean and standard deviation across all simulated mice. Only those parameters are represented that were found to be significantly associated with a cure (tumor size 1 mm3) when vaccination is administered as a monotherapy, on the optimal schedule predicted by the model. Red boxes correspond to dead mice, and teal boxes correspond to cured mice.
Figure 6
Figure 6
(A), Overall survival of simulated mice from time of combination treatment initiation, on various schedules. (B) Box plot of parameter values in simulated mice, giving median and inter-quartile range. Parameters are normalized to mean and standard deviation across all simulated mice. Only those parameters are represented that were found to be significantly associated with a cure (tumor size 1 mm3) when ADT and vaccination are administered as a combination, on the optimal schedule predicted by the model. Red boxes correspond to dead mice, and teal boxes correspond to cured mice.

References

    1. Printz C. Prostate cancer mortality projections reach a new high: With prostate cancer deaths projected to rise to their highest level in 20 years, some experts worry that changes to screening guidelines made in 2012 could be a factor. Cancer. 2021;126:3893–3894. doi: 10.1002/cncr.33127. - DOI - PubMed
    1. Siegel R.L., Miller K.D., Fuchs H.E., Jemal A. Cancer statistics, 2021. CA Cancer J. Clin. 2021;70:7–33. doi: 10.3322/caac.21590. - DOI - PubMed
    1. Lewis D.D., Cropp C.D. The impact of African ancestry on prostate cancer disparities in the era of precision medicine. Genes. 2020;11:1471. doi: 10.3390/genes11121471. - DOI - PMC - PubMed
    1. Perlmutter M.A., Lepor H. Androgen deprivation therapy in the treatment of advanced prostate cancer. Rev. Urol. 2007;9:S3–S8. - PMC - PubMed
    1. Tucci M., Zichi C., Buttigliero C., Vignani F., Scagliotti G.V., Di Maio M. Enzalutamide-resistant castration-resistant prostate cancer: Challenges and solutions. OncoTargets Ther. 2018;11:7353–7368. doi: 10.2147/OTT.S153764. - DOI - PMC - PubMed

LinkOut - more resources