. 2021 Apr 14;22(8):4029.
doi: 10.3390/ijms22084029.

CgEnd3 Regulates Endocytosis, Appressorium Formation, and Virulence in the Poplar Anthracnose Fungus Colletotrichum gloeosporioides

Affiliations

CgEnd3 Regulates Endocytosis, Appressorium Formation, and Virulence in the Poplar Anthracnose Fungus Colletotrichum gloeosporioides

Xiaolian Wang et al. Int J Mol Sci. .

Abstract

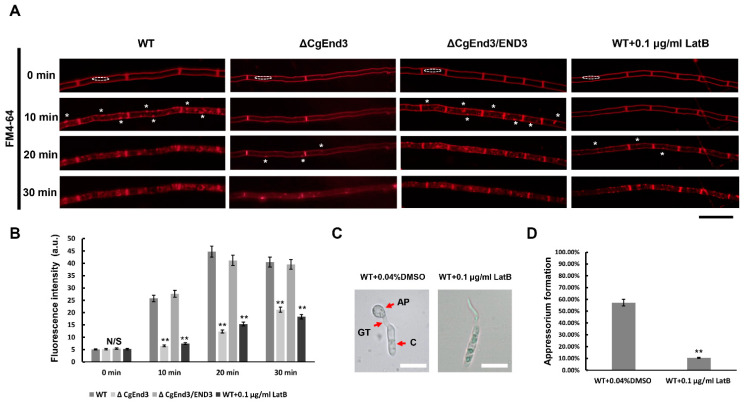
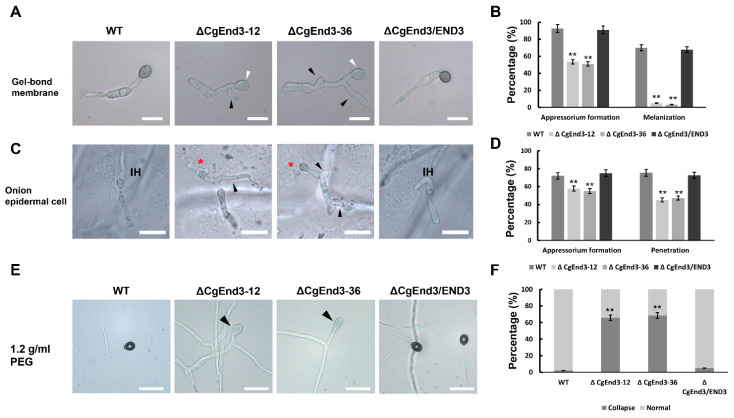
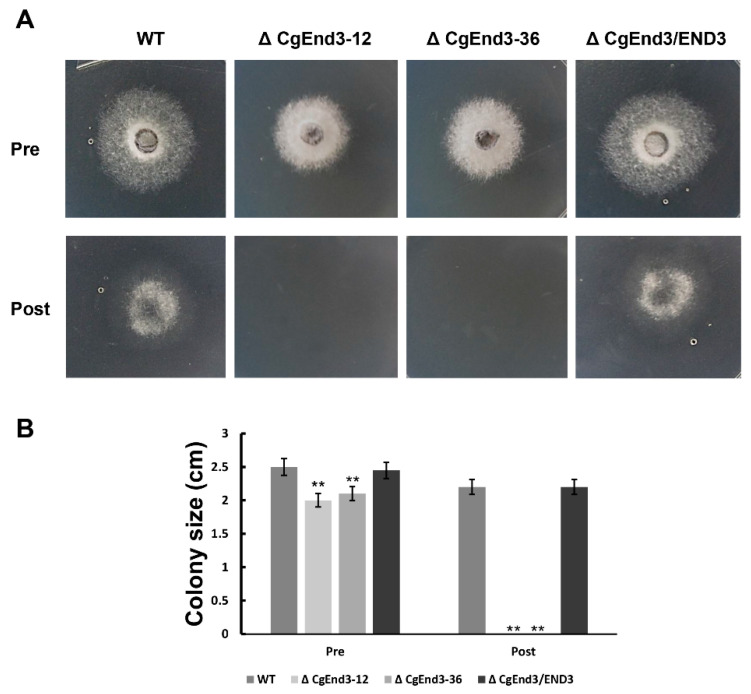
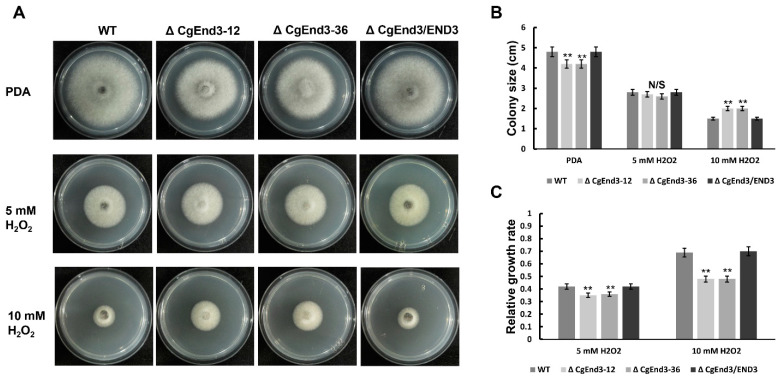
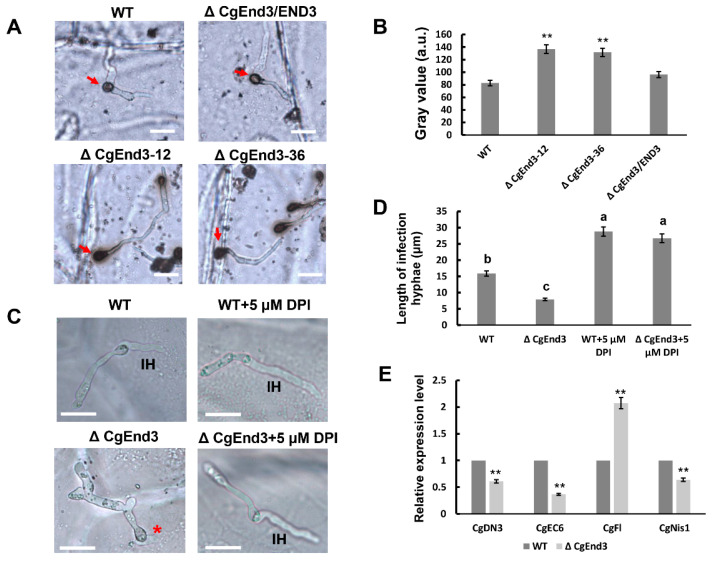
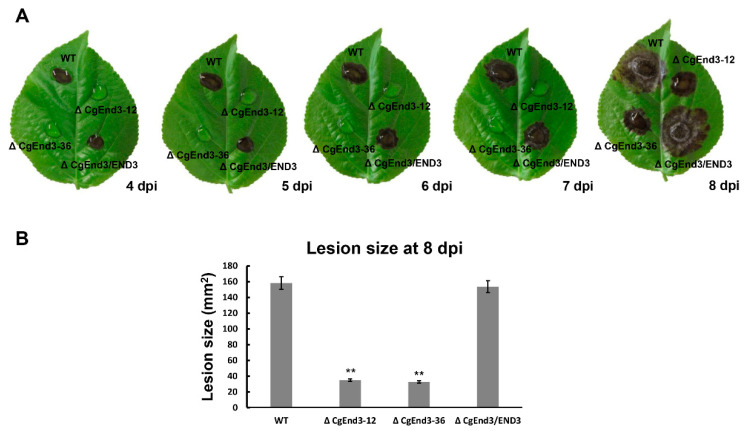
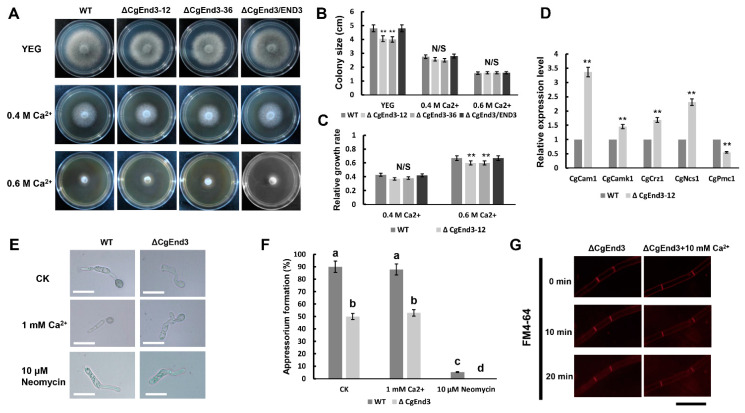
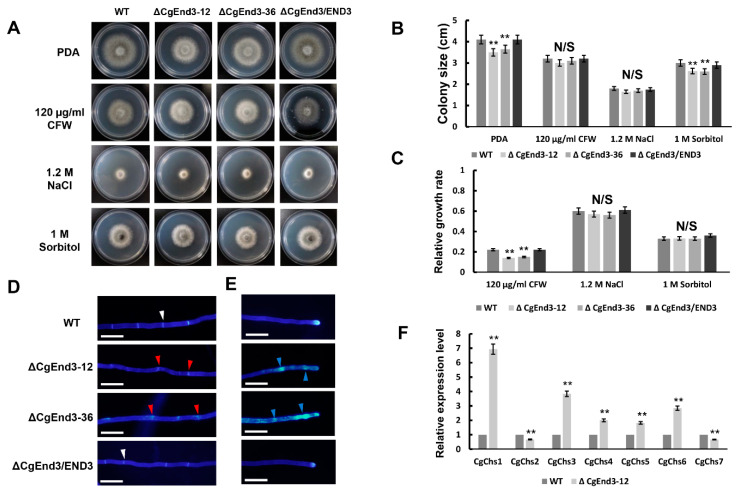
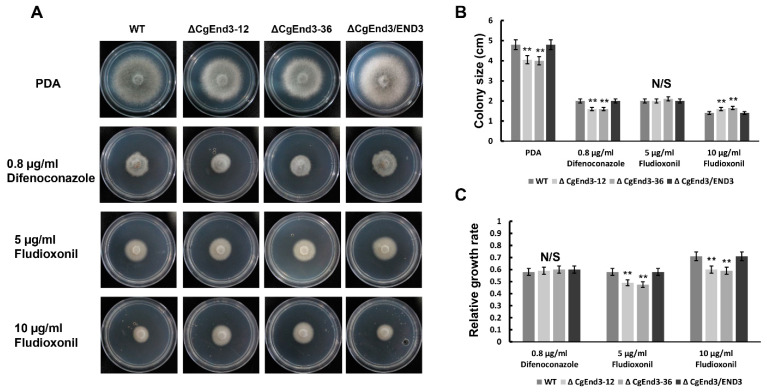
The hemibiotrophic ascomycete fungus Colletotrichum gloeosporioides is the causal agent of anthracnose on numerous plants, and it causes considerable economic losses worldwide. Endocytosis is an essential cellular process in eukaryotic cells, but its roles in C. gloeosporioides remain unknown. In our study, we identified an endocytosis-related protein, CgEnd3, and knocked it out via polyethylene glycol (PEG)-mediated protoplast transformation. The lack of CgEnd3 resulted in severe defects in endocytosis. C. gloeosporioides infects its host through a specialized structure called appressorium, and ΔCgEnd3 showed deficient appressorium formation, melanization, turgor pressure accumulation, penetration ability of appressorium, cellophane membrane penetration, and pathogenicity. CgEnd3 also affected oxidant adaptation and the expression of core effectors during the early stage of infection. CgEnd3 contains one EF hand domain and four calcium ion-binding sites, and it is involved in calcium signaling. A lack of CgEnd3 changed the responses to cell-wall integrity agents and fungicide fludioxonil. However, CgEnd3 regulated appressorium formation and endocytosis in a calcium signaling-independent manner. Taken together, these results demonstrate that CgEnd3 plays pleiotropic roles in endocytosis, calcium signaling, cell-wall integrity, appressorium formation, penetration, and pathogenicity in C. gloeosporioides, and it suggests that CgEnd3 or endocytosis-related genes function as promising antifungal targets.

Keywords: Colletotrichum gloeosporioides; anthracnose; appressorium; calcium signaling; endocytosis; pathogenicity.


Conflict of interest statement

The authors declare no conflict of interest.

Figures

Figure 1
Figure 1
Involvement of CgEnd3 in endocytosis. (A) Hyphal block from wild type (WT), ΔCgEnd3, and ΔCgEnd3/END3 were inoculated on Potato Dextrose Agar (PDA)-coated glass slides and cultured at 25 °C. At 2 days post inoculation (dpi), hyphae were stained using 0.5 μM N-(3-triethylammoniumpropyl)-4-(p-diethylaminophenylhexatrienyl)-pyridinium 2Br (FM4-64), and images were photographed at different time points (0–30 min) using fluorescence microscope. In any case, hyphae from WT were treated with 0.1 μg/mL Latrunculin B (LatB) for 30 min. The dotted frame indicates the region of cytoplasm, and the fluorescence intensity at each time point was quantified using ImageJ software. The white asterisks indicate site of endocytosis. This experiment was repeated three times. Bars = 10 μm. (B) Bar chart showing the mean fluorescence intensity in cytoplasm of each strain at different time points. Data from at least ten hyphae were collected at each time points from each strain. Error bars represent the standard deviations. Data were analyzed using Duncan’s range test. Asterisks ** indicate statistically significant differences at p < 0.05. a.u., arbitrary units. (C) Conidial suspensions (105 conidia/mL) from WT were inoculated on the hydrophobic side of Gel-bond membrane, water drops were replaced by 30 μL, 0.1 μg/mL LatB at 3 hpi for 30 min, and the controls were treated with 0.04% dimethyl sulfoxide (DMSO). Each sample was washed with distilled water after treatment. Appressorium formation was imaged at 5 h post inoculation (hpi). This experiment was repeated three times. AP = appressorium. GT = germ tube. C = conidia. Bars = 10 μm. (D) Bar chart showing the rate of appressorium formation at 5 hpi. Error bars represent the standard deviations. Data were analyzed using Duncan’s range test. Asterisks ** indicate statistically significant differences at p < 0.05. N/S = difference not significant.
Figure 2
Figure 2
Appressorium formation, penetration and turgor pressure test. (A) Equal volumes (30 μL) of conidial suspensions (105 conidia/mL) from WT, ΔCgEnd3, and ΔCgEnd3/END3 were inoculated on the hydrophobic side of the Gel-bond membrane. Images were pictured at 9 hpi. White arrow indicates the nonmelanized appressorium. This experiment was repeated three times. Black arrow indicates the branched germ tube. Bars = 10 µm. (B) Bar chart showing the percentage of appressorium formation and melanization at 9 hpi in (A). Error bars represent the standard deviations. Data were analyzed using Duncan’s range test. Asterisks ** indicate a statistically significant differences at p < 0.05. (C) Appressorium formation and penetration of WT, ΔCgEnd3, and ΔCgEnd3/END3 on onion epidermal cell at 9 hpi. This experiment was repeated three times. IH = infection hyphae. Red asterisk indicates the stunted infection hyphae. Black arrow indicates the branched germ tube. Bars = 10 µm. (D) Bar chart showing the appressorium formation and penetration rate in WT, ΔCgEnd3, and ΔCgEnd3/END3 on onion epidermal cell at 9 hpi. Error bars represent the standard deviation. Data were analyzed using Duncan’s range test. Asterisks ** indicate statistically significant differences at p < 0.05. (E) The turgor pressure of appressorium from WT, ΔCgEnd3, and ΔCgEnd3/END3 were tested using 1.2 g/mL polyethylene glycol (PEG) 4000. Black arrow indicates the collapsed appressorium. This experiment was repeated three times. Bars = 10 µm. (F) Bar chart showing the percentage of normal or collapsed appressorium in WT, ΔCgEnd3, and ΔCgEnd3/END3 under the treatment of PEG 4000 for 10 min. Error bars represent the standard deviations. Data were analyzed using Duncan’s range test. Asterisks ** indicate statistically significant differences at p < 0.05.
Figure 3
Figure 3
Cellophane membrane penetration assay. (A) Hyphal blocks from WT, ΔCgEnd3, and ΔCgEnd3/END3 were inoculated on cellophane membranes overlaid on PDA medium for 2 days at 25 °C (Pre). The cellophane membrane were removed, and the resulting plates were incubated at 25 °C for 2 additional days (Post). This experiment was repeated three times. (B) Bar chart showing the colony size of each strain at 2 days post removal of cellophane membrane (Post). Error bars represent the standard deviations. Data were analyzed using Duncan’s range test. Asterisks ** indicate statistically significant differences at p < 0.05.
Figure 4
Figure 4
Vegetative growth under oxidative stress. (A) Hyphal block from WT, ΔCgEnd3, and ΔCgEnd3/END3 were inoculated on PDA or PDA mixed with 5 and 10 mM H2O2, respectively. Images were pictured at 4 dpi. This experiment was repeated three times. (B) Bar chart showing the colony size of each strain on PDA and PDA mixed with 5 and 10 mM H2O2. Error bars represent the standard deviations. Data were analyzed using Duncan’s range test. Asterisks ** indicate statistically significant differences at p < 0.05. N/S = difference not significant. (C) Bar chart showing the relative growth rate of each strain on PDA mixed with 5 and 10 mM H2O2; computing methods of relative growth rate were described by Wang et al. [54]. The deceased relative growth rate indicates the increased resistance to stress and vice versa. Error bars represent the standard deviations. Data were analyzed using Duncan’s range test. Asterisks ** indicate statistically significant differences at p < 0.05.
Figure 5
Figure 5
CgEnd3 is involved in oxidant adaptation and expression of core effectors during the penetration of appressorium. (A) Equal volumes (30 μL) of conidial suspensions (105 conidia/mL) from WT, ΔCgEnd3, and ΔCgEnd3/END3 were inoculated on the hydrophobic side of onion epidermal cell. At 9 hpi, appressorium of each strain was stained using 2 mg/mL 3,3′-diaminobenzidine (DAB) solution in darkness for 12 h. Red arrow indicates the dark brown polymers in the presence of reactive oxygen species (ROS). This experiment was repeated three times. Bars = 10 µm. (B) The deposition of dark brown polymers was analyzed using ImageJ software, bar chart showing the gray value (a. u.) of each strain. Data were collected from at least 10 samples from each strain. Error bars represent the standard deviations. Data were analyzed using Duncan’s range test. Asterisks ** indicate statistically significant differences at p < 0.05. (C) Conidial suspensions (105 conidia/mL) from WT and ΔCgEnd3 were added with diphenyleneiodonium (DPI) at a final concentration of 5 μM. Images were photographed at 9 hpi. Red asterisk indicates the stunted infection hyphae. IH = infection hyphae. Bars = 10 µm. (D) Bar chart showing the mean length of infection hyphae from each sample. Data were collected from at least 20 infection hyphae, and this experiment was repeated three times. Error bars represent the standard deviations. The values indicated by the different letters are significantly different at p < 0.05, as determined using post hoc Tukey’s test. (E) Conidial suspensions (106 conidia/mL) from WT and ΔCgEnd3 were inoculated on poplar leaves. Inoculation areas (including fungal tissue and leaf tissue) were cut at 3 dpi, and 5 mg samples from WT and ΔCgEnd3 areas were collected. Bar chart showing the expression of conserved effectors in WT and ΔCgEnd3 during early stage of infection. This experiment was repeated three times. Error bars represent the standard deviations. Data were analyzed using Duncan’s range test. Asterisks ** indicate statistically significant differences at p < 0.05.
Figure 6
Figure 6
Pathogenicity assay on poplar leaves. (A) Equal volumes (30 μL) of conidial suspensions (2 × 10⁵ conidia/mL) from WT, ΔCgEnd3, and ΔCgEnd3/END3 were inoculated on poplar leaves. Then, leaves were cultured at 25 °C under moist environment. Images were pictured at 4–8 dpi. This experiment was repeated three times. (B) Bar chart showing the lesion sizes of WT, ΔCgEnd3, and ΔCgEnd3/END3 at 8 dpi. Error bars represent the standard deviations. Data were analyzed using Duncan’s range test. Asterisks ** indicate statistically significant differences at p < 0.05.
Figure 7
Figure 7
Role of CgEnd3 in calcium signaling. (A) Hyphal block from WT, ΔCgEnd3, and ΔCgEnd3/END3 were inoculated on Yeast extract-glucose medium (YEG) and YEG containing 0.4 and 0.6 M Ca2+, respectively. Strains were cultured at 25 °C for 4 days. This experiment was repeated three times. (B) Bar chart showing the colony size of each strain on YEG and YEG containing 0.4 and 0.6 M Ca2+ in (A). Data were analyzed using Duncan’s range test. Asterisks ** indicate statistically significant differences at p < 0.05. N/S = difference not significant. (C) Bar chart showing the relative growth rate of each strain under the treatment of 0.4 and 0.6 M Ca2+. Error bars represent the standard deviations. Data were analyzed using Duncan’s range test. Asterisks ** indicate statistically significant differences at p < 0.05. N/S = difference not significant. (D) Bar chart showing the relative expression of five calcium signaling genes in WT and ΔCgEnd3. This experiment was repeated three times. Error bars represent the standard deviations. Data were analyzed using Duncan’s range test. Asterisks ** indicate statistically significant differences at p < 0.05. (E) The effects of exogenous 1 mM Ca2+ and 10 μM of the phospholipase C inhibitor neomycin on appressorium formation in WT and ΔCgEnd3 at 9 hpi. This experiment was repeated three times. Bars = 10 µm. (F) Bar chart showing the rate of appressorium formation under the treatment of 1 mM Ca2+ or 10 μM neomycin. Error bars represent the standard deviations. The values indicated by the different letters are significantly different at p < 0.05, as determined using post hoc Tukey’s test. (G) The internalization of FM4-64 in ΔCgEnd3 in the presence of 10 mM Ca2+. Images were photographed at different time points (0–20 min) using fluorescence microscope. Bars = 10 μm. This experiment was repeated three times.
Figure 8
Figure 8
Response to cell wall integrity agents and high osmotic stress, calcofluor white (CFW) staining of hyphae and relative expression of seven chitin synthase genes. (A) Vegetative growth of WT, ΔCgEnd3, and ΔCgEnd3/END3 on PDA and PDA containing 120 µg/mL CFW, 1.2 M NaCl, and 1 M sorbitol, respectively. Strains were cultured at 25 °C for 4 days. This experiment was repeated three times. (B) Bar chart showing the colony size of each strain in (A). Error bars represent the standard deviations. Data were analyzed using Duncan’s range test. Asterisks ** indicate statistically significant differences at p < 0.05. N/S = difference not significant. (C) Bar chart showing the relative growth rate of each strain in the presence of 120 µg/mL CFW, 1.2 M NaCl, and 1 M sorbitol, respectively. Error bars represent the standard deviations. Data were analyzed using Duncan’s range test. Asterisks ** indicate statistically significant differences at p < 0.05. N/S = difference not significant. (D) CFW staining of hyphal septa from WT, ΔCgEnd3, and ΔCgEnd3/END3. White arrow indicates the intact septum in WT. Red arrow indicates the dispersed chitin at septum. Bars = 10 µm. (E) CFW staining of hyphal tip from WT, ΔCgEnd3, and ΔCgEnd3/END3. Blue arrow indicates the punctiform pattern of chitin distribution at the hyphal tips. This experiment was repeated three times. Bars = 10 µm. (F) Bar chart showing the relative expression level of seven chitin synthase genes in WT and ΔCgEnd3. This experiment was repeated three times. Data were analyzed using Duncan’s range test. Asterisks ** indicate statistically significant differences at p < 0.05.
Figure 9
Figure 9
Response to the fungicide fludioxonil. (A) Vegetative growth of WT, ΔCgEnd3, and ΔCgEnd3/END3 on PDA and PDA containing 0.8 µg/mL difenoconazole, 5 and 10 µg/mL fludioxonil, respectively. Strains were cultured at 25 °C for 4 days. This experiment was repeated three times. (B) Bar chart showing the colony size of each strain in (A). Data were analyzed using Duncan’s range test. Asterisks ** indicate statistically significant differences at p < 0.05. N/S = difference not significant. (C) Bar chart showing the relative growth rate of each strain on PDA containing 0.8 µg/mL difenoconazole, 5 and 10 µg/mL fludioxonil, respectively. Data were analyzed using Duncan’s range test. Asterisks ** indicate statistically significant differences at p < 0.05. N/S = difference not significant.

References

    1. Kim J.W., Shim S.H. The fungus Colletotrichum as a source for bioactive secondary metabolites. Arch. Pharmacal Res. 2019;42:735–753. doi: 10.1007/s12272-019-01142-z. - DOI - PubMed
    1. Li Z., Liang Y.-M., Tian C. Characterization of the causal agent of poplar anthracnose occurring in the Beijing region. Mycotaxon. 2012;120:277–286. doi: 10.5248/120.277. - DOI
    1. Xu X., Wang Y., Tian C., Liang Y. The Colletotrichum gloeosporioides RhoB regulates cAMP and stress response pathways and is required for pathogenesis. Fungal Genet. Biol. B. 2016;96:12–24. doi: 10.1016/j.fgb.2016.09.002. - DOI - PubMed
    1. Sun Y., Wang Y., Tian C. bZIP transcription factor CgAP1 is essential for oxidative stress tolerance and full virulence of the poplar anthracnose fungus Colletotrichum gloeosporioides. Fungal Genet. Biol. B. 2016;95:58–66. doi: 10.1016/j.fgb.2016.08.006. - DOI - PubMed
    1. Talbot N. Appressoria. Curr. Biol. 2019;29:R144–R146. doi: 10.1016/j.cub.2018.12.050. - DOI - PubMed

MeSH terms

Supplementary concepts

LinkOut - more resources