

Melatonin Targets Metabolism in Head and Neck Cancer Cells by Regulating Mitochondrial Structure and Function
- PMID: 33919790
- PMCID: PMC8070770
- DOI: 10.3390/antiox10040603
Melatonin Targets Metabolism in Head and Neck Cancer Cells by Regulating Mitochondrial Structure and Function
Abstract
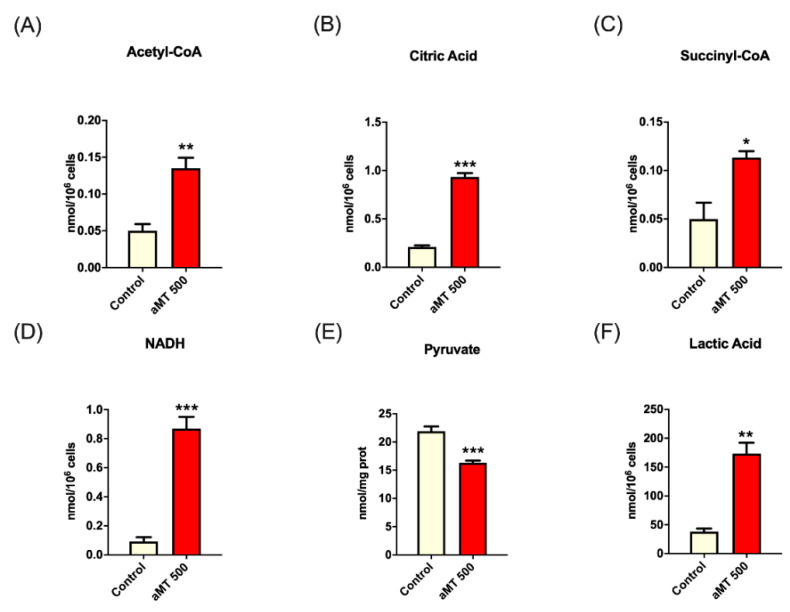
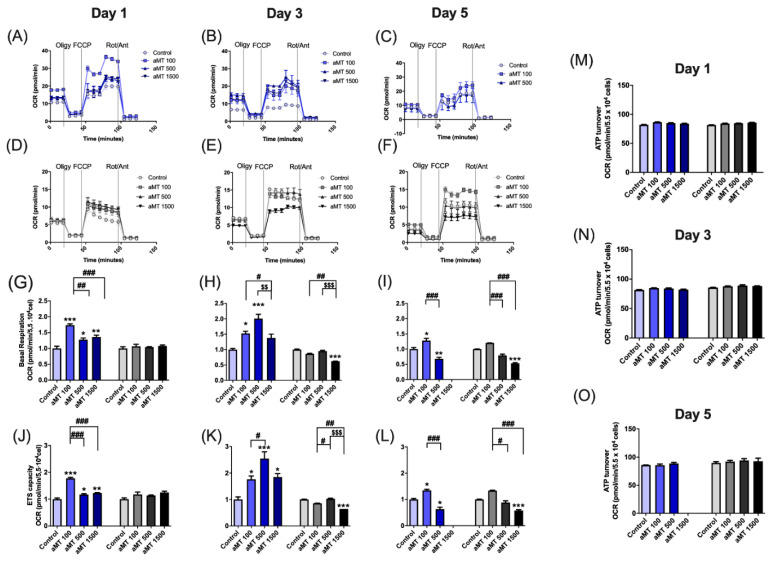
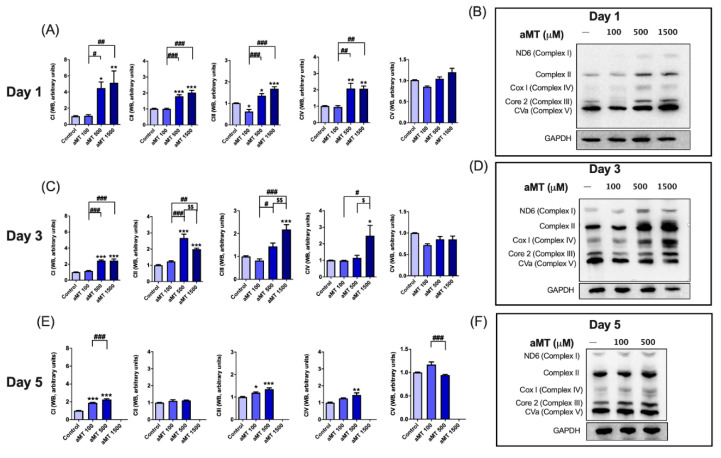
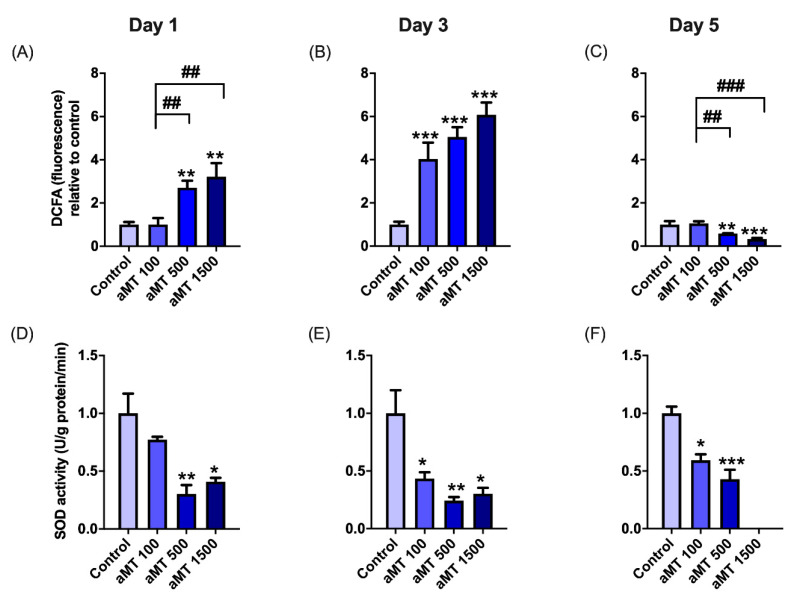
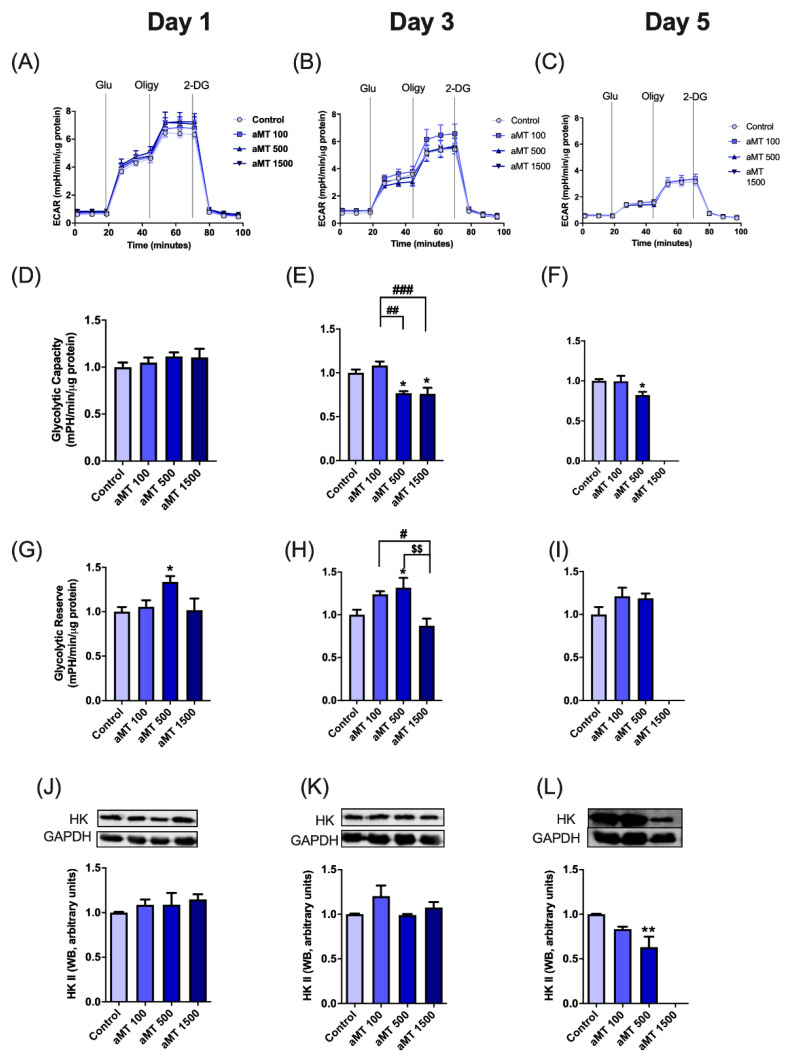
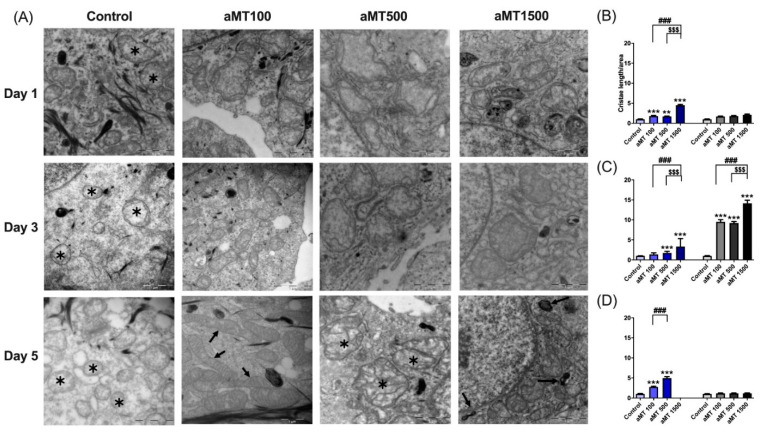
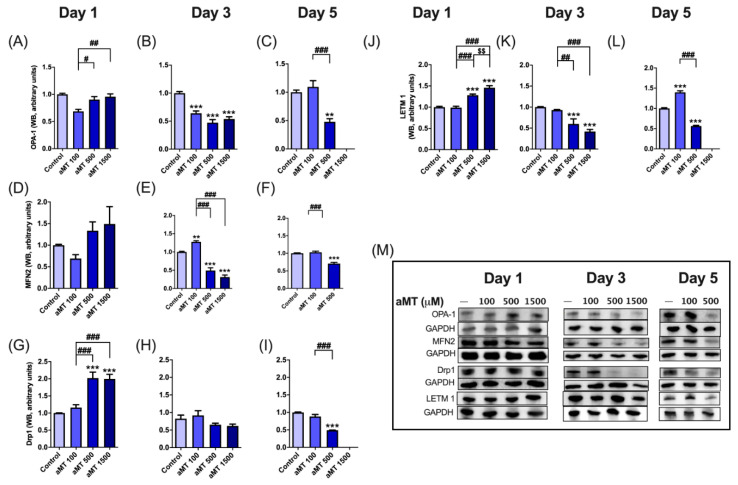
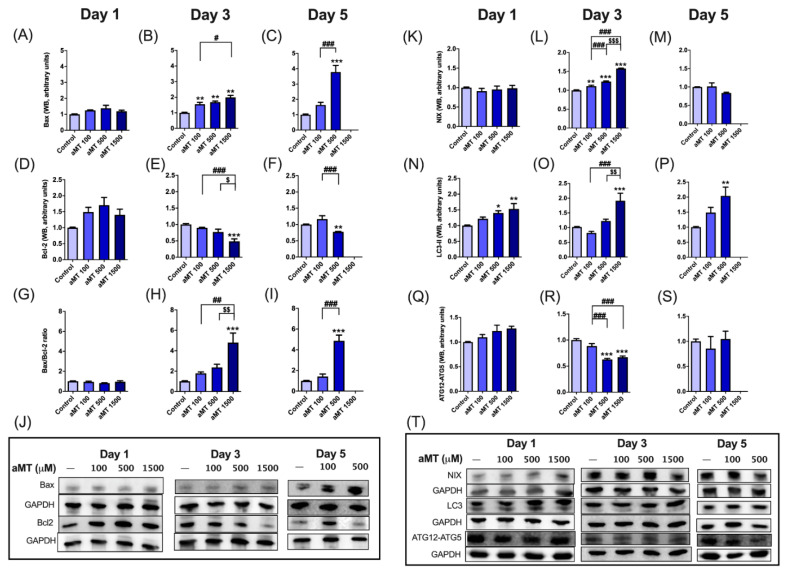
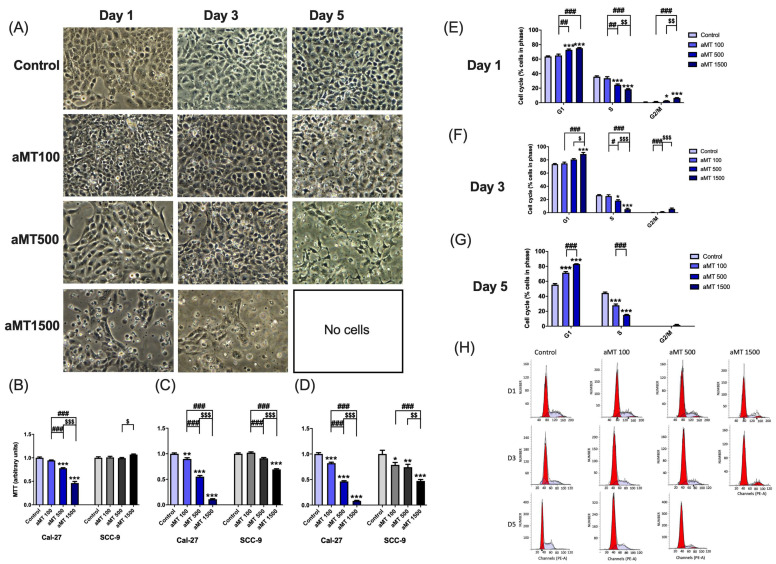
Metabolic reprogramming, which is characteristic of cancer cells that rapidly adapt to the hypoxic microenvironment and is crucial for tumor growth and metastasis, is recognized as one of the major mechanisms underlying therapeutic resistance. Mitochondria, which are directly involved in metabolic reprogramming, are used to design novel mitochondria-targeted anticancer agents. Despite being targeted by melatonin, the functional role of mitochondria in melatonin's oncostatic activity remains unclear. In this study, we aim to investigate the role of melatonin in mitochondrial metabolism and its functional consequences in head and neck cancer. We analyzed the effects of melatonin on head and neck squamous cell carcinoma (HNSCC) cell lines (Cal-27 and SCC-9), which were treated with 100, 500, and 1500 µM of melatonin for 1, 3, and 5 days, and found a connection between a change of metabolism following melatonin treatment and its effects on mitochondria. Our results demonstrate that melatonin induces a shift to an aerobic mitochondrial metabolism that is associated with changes in mitochondrial morphology, function, fusion, and fission in HNSCC. We found that melatonin increases oxidative phosphorylation (OXPHOS) and inhibits glycolysis in HNSCC, resulting in increased ROS production, apoptosis, and mitophagy, and decreased cell proliferation. Our findings highlight new molecular pathways involved in melatonin's oncostatic activity, suggesting that it could act as an adjuvant agent in a potential therapy for cancer patients. We also found that high doses of melatonin, such as those used in this study for its cytotoxic impact on HNSCC cells, might lead to additional effects through melatonin receptors.
Keywords: OXPHOS; apoptosis; free radicals; glycolysis; head and neck cancer cells; melatonin; mitochondria; mitophagy.
Conflict of interest statement
The authors declare no conflict of interest.
Figures
Similar articles
-
Melatonin Enhances Cisplatin and Radiation Cytotoxicity in Head and Neck Squamous Cell Carcinoma by Stimulating Mitochondrial ROS Generation, Apoptosis, and Autophagy.Oxid Med Cell Longev. 2019 Feb 28;2019:7187128. doi: 10.1155/2019/7187128. eCollection 2019. Oxid Med Cell Longev. 2019. PMID: 30944696 Free PMC article.
-
Melatonin drives apoptosis in head and neck cancer by increasing mitochondrial ROS generated via reverse electron transport.J Pineal Res. 2022 Oct;73(3):e12824. doi: 10.1111/jpi.12824. Epub 2022 Aug 28. J Pineal Res. 2022. PMID: 35986493 Free PMC article.
-
Combination of melatonin and rapamycin for head and neck cancer therapy: Suppression of AKT/mTOR pathway activation, and activation of mitophagy and apoptosis via mitochondrial function regulation.J Pineal Res. 2018 Apr;64(3). doi: 10.1111/jpi.12461. Epub 2018 Jan 9. J Pineal Res. 2018. PMID: 29247557
-
Melatonin inhibits Warburg-dependent cancer by redirecting glucose oxidation to the mitochondria: a mechanistic hypothesis.Cell Mol Life Sci. 2020 Jul;77(13):2527-2542. doi: 10.1007/s00018-019-03438-1. Epub 2020 Jan 22. Cell Mol Life Sci. 2020. PMID: 31970423 Free PMC article. Review.
-
Mitochondrial functions and melatonin: a tour of the reproductive cancers.Cell Mol Life Sci. 2019 Mar;76(5):837-863. doi: 10.1007/s00018-018-2963-0. Epub 2018 Nov 14. Cell Mol Life Sci. 2019. PMID: 30430198 Free PMC article. Review.
Cited by
-
Melatonin and Related Compounds: Antioxidant and Anti-Inflammatory Actions.Antioxidants (Basel). 2022 Mar 10;11(3):532. doi: 10.3390/antiox11030532. Antioxidants (Basel). 2022. PMID: 35326182 Free PMC article.
-
Understanding the Mechanism of Action of Melatonin, Which Induces ROS Production in Cancer Cells.Antioxidants (Basel). 2022 Aug 20;11(8):1621. doi: 10.3390/antiox11081621. Antioxidants (Basel). 2022. PMID: 36009340 Free PMC article. Review.
-
Melatonin rescues cell respiration impaired by hypoxia/reoxygenation in aortic endothelial cells and affects the mitochondrial bioenergetics targeting the F1FO-ATPase.Redox Biol. 2025 May;82:103605. doi: 10.1016/j.redox.2025.103605. Epub 2025 Mar 20. Redox Biol. 2025. PMID: 40132239 Free PMC article.
-
Potential of melatonin to reverse epigenetic aberrations in oral cancer: new findings.EXCLI J. 2023 Dec 12;22:1280-1310. doi: 10.17179/excli2023-6624. eCollection 2023. EXCLI J. 2023. PMID: 38234969 Free PMC article. Review.
-
A bioengineered tumor matrix-based scaffold for the evaluation of melatonin efficacy on head and neck squamous cancer stem cells.Mater Today Bio. 2024 Sep 14;29:101246. doi: 10.1016/j.mtbio.2024.101246. eCollection 2024 Dec. Mater Today Bio. 2024. PMID: 39351489 Free PMC article.
References
LinkOut - more resources
Full Text Sources
Other Literature Sources
Research Materials
