. 2021 Apr 14;11(4):240.
doi: 10.3390/metabo11040240.

Integrated Metabolomics and Transcriptomics Using an Optimised Dual Extraction Process to Study Human Brain Cancer Cells and Tissues

Affiliations

Integrated Metabolomics and Transcriptomics Using an Optimised Dual Extraction Process to Study Human Brain Cancer Cells and Tissues

Alison Woodward et al. Metabolites. .

Abstract

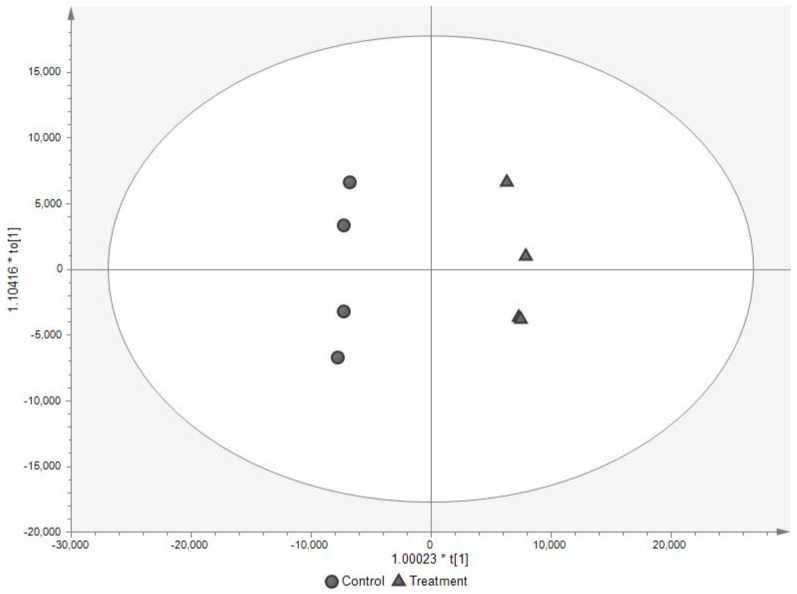
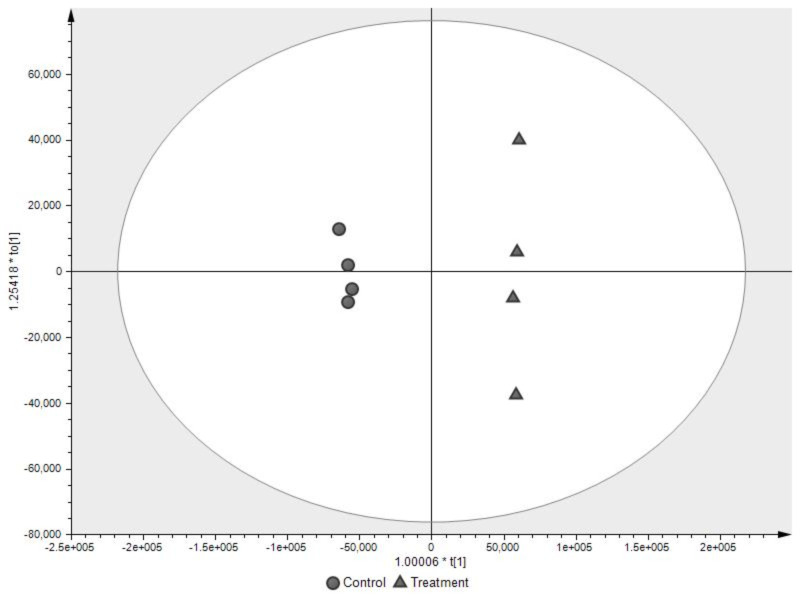
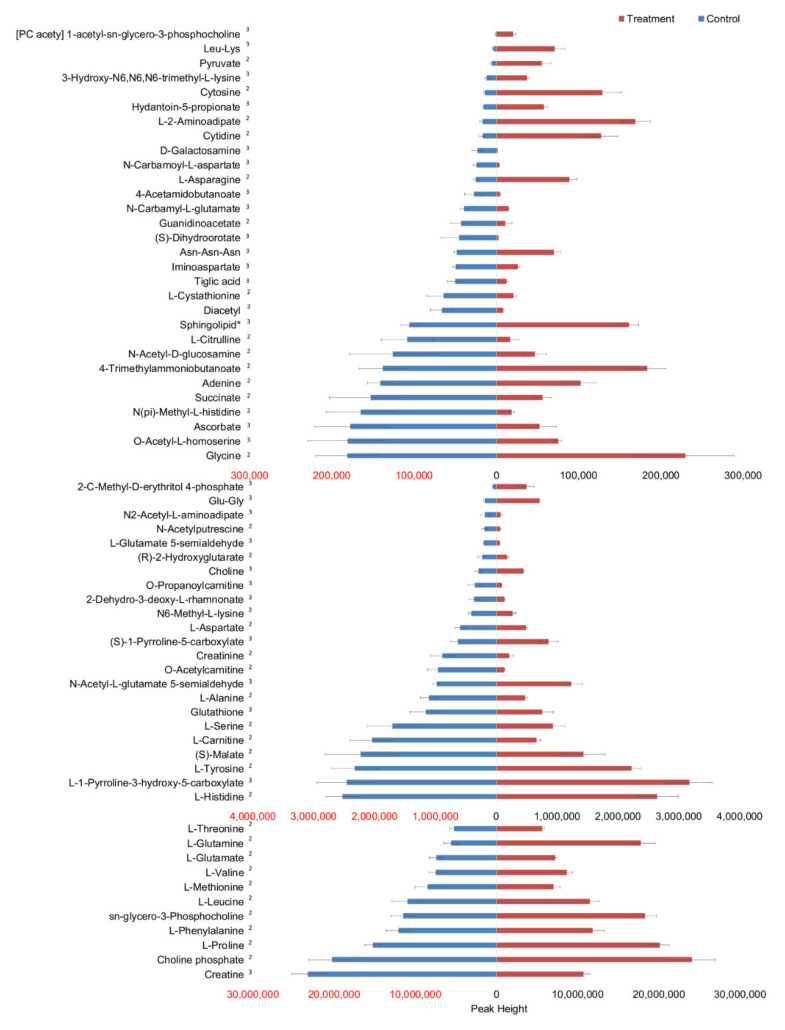
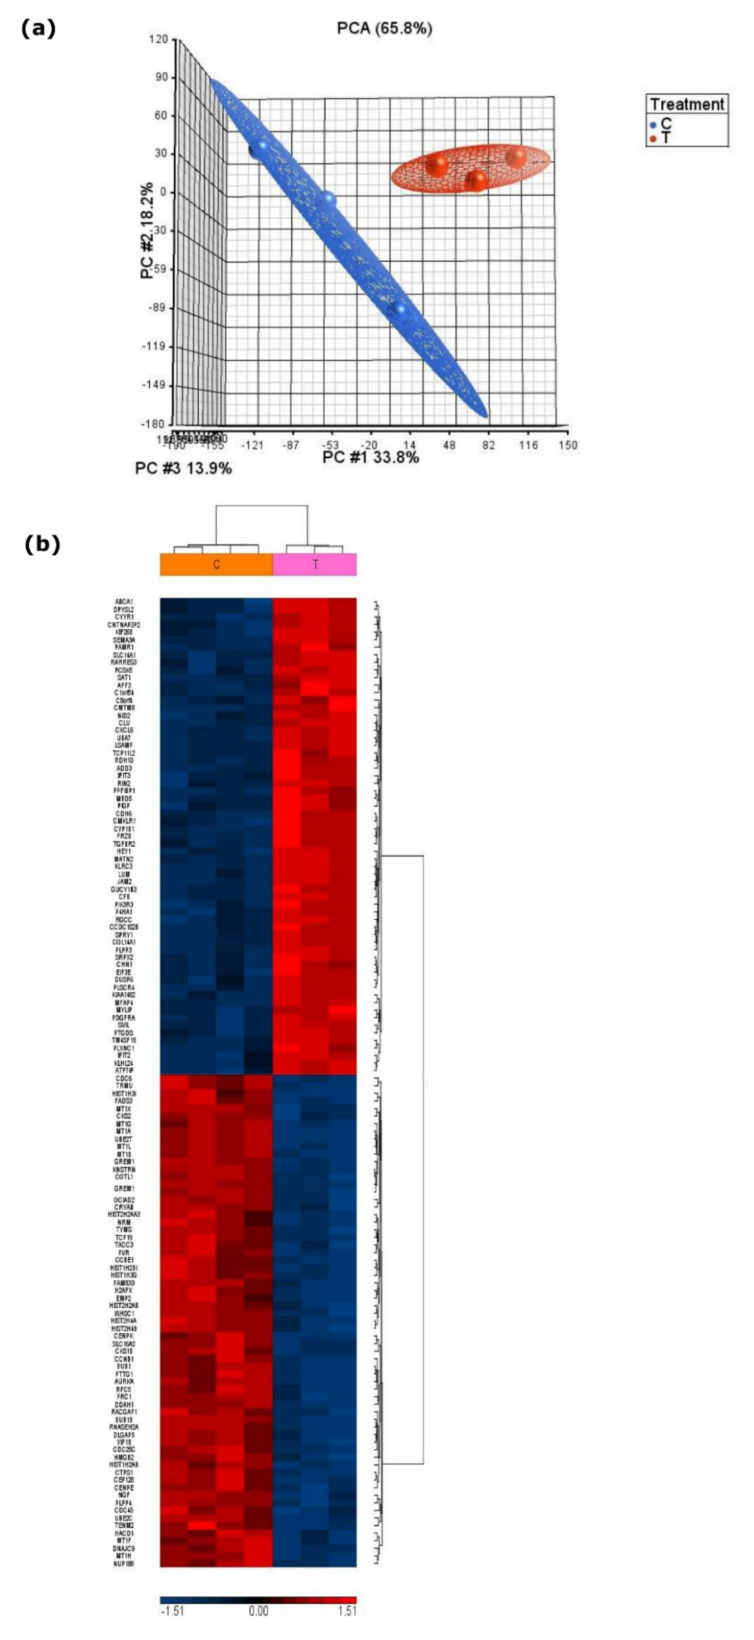
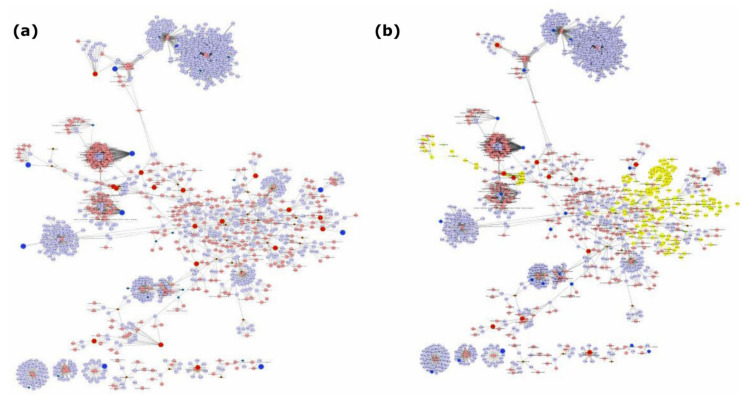
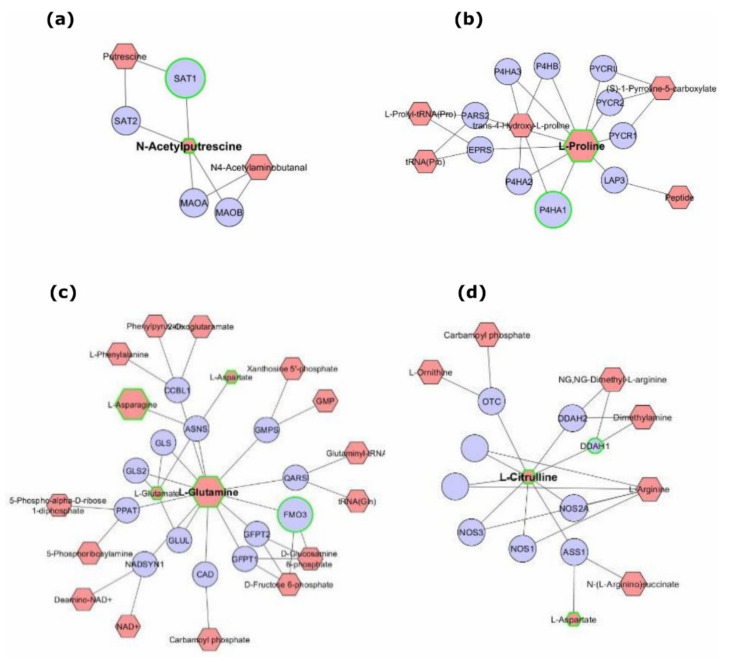
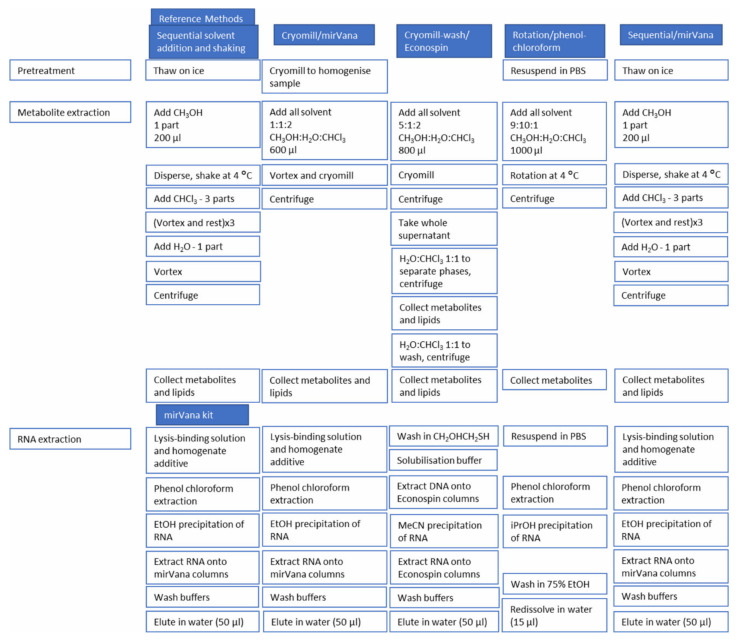
The integration of untargeted metabolomics and transcriptomics from the same population of cells or tissue enhances the confidence in the identified metabolic pathways and understanding of the enzyme-metabolite relationship. Here, we optimised a simultaneous extraction method of metabolites/lipids and RNA from ependymoma cells (BXD-1425). Relative to established RNA (mirVana kit) or metabolite (sequential solvent addition and shaking) single extraction methods, four dual-extraction techniques were evaluated and compared (methanol:water:chloroform ratios): cryomill/mirVana (1:1:2); cryomill-wash/Econospin (5:1:2); rotation/phenol-chloroform (9:10:1); Sequential/mirVana (1:1:3). All methods extracted the same metabolites, yet rotation/phenol-chloroform did not extract lipids. Cryomill/mirVana and sequential/mirVana recovered the highest amounts of RNA, at 70 and 68% of that recovered with mirVana kit alone. sequential/mirVana, involving RNA extraction from the interphase of our established sequential solvent addition and shaking metabolomics-lipidomics extraction method, was the most efficient approach overall. Sequential/mirVana was applied to study a) the biological effect caused by acute serum starvation in BXD-1425 cells and b) primary ependymoma tumour tissue. We found (a) 64 differentially abundant metabolites and 28 differentially expressed metabolic genes, discovering four gene-metabolite interactions, and (b) all metabolites and 62% lipids were above the limit of detection, and RNA yield was sufficient for transcriptomics, in just 10 mg of tissue.

Keywords: RNA; cancer; dual-extraction; integrated omics; metabolite.


Conflict of interest statement

The authors declare no conflict of interest. The funders had no role in the design of the study; in the collection, analyses, or interpretation of data; in the writing of the manuscript, or in the decision to publish the results.

Figures

Figure 1
Figure 1
Statistical discrimination of treated (serum-starved) and control (serum-replete) BXD-1425 cells analysed by LC-MS; (a) metabolomics, (b) lipidomics. OPLS-DA scores plot. Four data points representing four replicates of each of treated (serum-starved, ▲) and control (serum-replete, ●) can be observed grouped together. (a) R2X 0.814, R2Y 0.995, Q2 0.979; (b) R2X 0.880, R2Y 0.998, Q2 = 0.994.
Figure 1
Figure 1
Statistical discrimination of treated (serum-starved) and control (serum-replete) BXD-1425 cells analysed by LC-MS; (a) metabolomics, (b) lipidomics. OPLS-DA scores plot. Four data points representing four replicates of each of treated (serum-starved, ▲) and control (serum-replete, ●) can be observed grouped together. (a) R2X 0.814, R2Y 0.995, Q2 0.979; (b) R2X 0.880, R2Y 0.998, Q2 = 0.994.
Figure 2
Figure 2
Differential accumulation of metabolites in treated (serum-starved) and control (serum-replete) cells. Differences in peak height were statistically significant for all metabolites displayed. Statistical significance was defined as a combination of p < 0.05 (in a univariate t-test with an FDR cut-off of 0.05) and VIP ≥ 1 (variable important for projection in a multivariate OPLS-DA test). The level of confidence of identification is given as superscripted numbers. * Sphingolipid is [SP hydroxy,hydroxy,methyl(10:2/2:0)] 6R-(8-hydroxydecyl)-2R-(hydroxymethyl)-piperidin-3R-ol.
Figure 3
Figure 3
Statistical discrimination of treated (serum-starved) and control (serum-replete) BXD-1425 cells analysed by Affymetrix array. (a) PCA plot shows distinct clustering of treated (red) and control (blue) groups; (b) hierarchical clustering of the 128 differentially expressed genes. Intensity of colour is directly proportional to the difference in mean expression and ranges from blue (downregulated) to red (upregulated). C—control; T—treatment.
Figure 4
Figure 4
Integrated analysis of genes and metabolites extracted from treated (serum-starved) relative to control (serum-replete) BXD-1425 cells. (a) Compound reaction networks of the metabolites and genes were visualised using MetScape: metabolites (red) and genes (blue) are presented as nodes. (b) The metabolite–gene associated networks were mainly related to purine metabolism (yellow).
Figure 5
Figure 5
Integrated gene–metabolite interactions facilitated by dual-extraction from the same population of cells. The depicted networks reveal aberrant metabolites (red) associated with dysregulated genes (blue) between treated and control BXD-1425 cells (>1.0 fold). The integrative network was generated using a MetScape plugin for Cytoscape. Significantly altered genes or metabolites (green border) in serum-starved relative to serum-replete cells are represented as upregulated/downregulated or high/low abundance, respectively, by an increase or decrease in node size in comparison to other genes or metabolites. (a) Direct statistically significant edge between N-acetylputrescine and SAT1, (b) edge between L-proline and P4HA1, (c) edge between L-glutamine and FMO3, (d) edge between L-citrulline and DDAH1.
Figure 6
Figure 6
Schematic of metabolite/RNA dual extraction procedures and the single extraction reference methods.

Similar articles

Cited by

References

    1. Kan M., Shumyatcher M., Himes B.E. Using omics approaches to understand pulmonary diseases. Respir. Res. 2017;18:1–20. doi: 10.1186/s12931-017-0631-9. - DOI - PMC - PubMed
    1. Karnovsky A., Weymouth T., Hull T., Glenn Tarcea V., Scardoni G., Laudanna C., Sartor M.A., Stringer K.A., Jagadish H.V., Burant C., et al. Metscape 2 bioinformatics tool for the analysis and visualization of metabolomics and gene expression data. Bioinformatics. 2012;28:373–380. doi: 10.1093/bioinformatics/btr661. - DOI - PMC - PubMed
    1. Johnson C.H., Ivanisevic J., Siuzdak G. Metabolomics: Beyond biomarkers and towards mechanisms. Nat. Rev. Mol. Cell Biol. 2016;17:451–459. doi: 10.1038/nrm.2016.25. - DOI - PMC - PubMed
    1. Futschik M.E., Morkel M., Schäfer R., Sers C. In: The Human Transcriptome: Implications for Understanding, Diagnosing, and Treating Human Disease. 2nd ed. Coleman W.B., Tsongalis G.J., editors. Academic Press; Cambridge, MA, USA: 2018. pp. 135–164.
    1. Challacombe J.F. In silico identification of metabolic enzyme drug targets in Burkholderia pseudomallei. bioRxiv. 2017:1–33. doi: 10.1101/034306. - DOI

LinkOut - more resources