

Lipidomics-Based Comparison of Molecular Compositions of Green, Yellow, and Red Bell Peppers
- PMID: 33919953
- PMCID: PMC8070949
- DOI: 10.3390/metabo11040241
Lipidomics-Based Comparison of Molecular Compositions of Green, Yellow, and Red Bell Peppers
Abstract
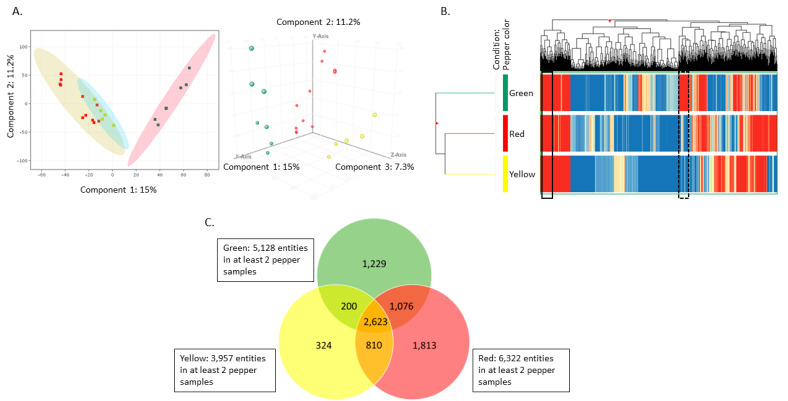
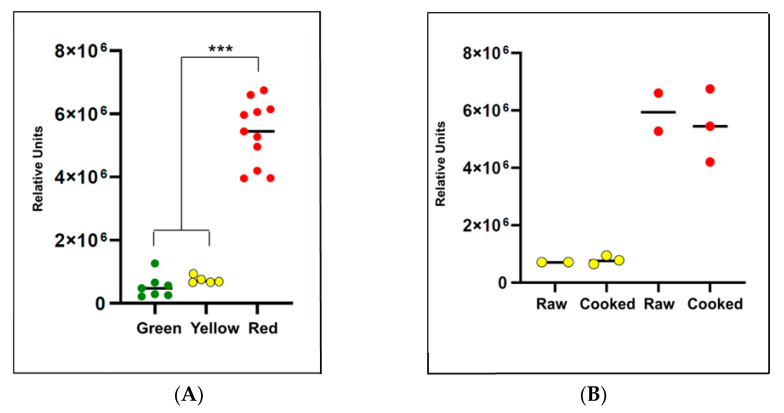
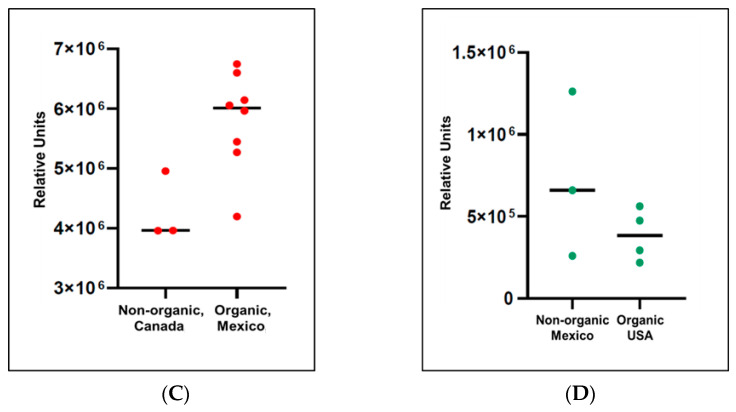
Identifying and annotating the molecular composition of individual foods will improve scientific understanding of how foods impact human health and how much variation exists in the molecular composition of foods of the same species. The complexity of this task includes distinct varieties and variations in natural occurring pigments of foods. Lipidomics, a sub-field of metabolomics, has emerged as an effective tool to help decipher the molecular composition of foods. For this proof-of-principle research, we determined the lipidomic profiles of green, yellow and red bell peppers (Capsicum annuum) using liquid chromatography mass spectrometry and a novel tool for automated annotation of compounds following database searches. Among 23 samples analyzed from 6 peppers (2 green, 1 yellow, and 3 red), over 8000 lipid compounds were detected with 315 compounds (106 annotated) found in all three colors. Assessments of relationships between these compounds and pepper color, using linear mixed effects regression and false discovery rate (<0.05) statistical adjustment, revealed 11 compounds differing by color. The compound most strongly associated with color was the carotenoid, β-cryptoxanthin (p-value = 7.4 × 10⁻⁵; FDR adjusted p-value = 0.0080). These results support lipidomics as a viable analytical technique to identify molecular compounds that can be used for unique characterization of foods.
Keywords: Capsicum annuum; bell pepper; foodomics; lipidomics; liquid chromatography mass spectrometry (LC/MS); metabolomics; β-cryptoxanthin.
Conflict of interest statement
The authors declare no conflict of interest. The funders had no role in the design of the study; in the collection, analyses, or interpretation of data; in the writing of the manuscript; or in the decision to publish the results.
Figures
Similar articles
-
Antihyperglucolipidaemic and anticarbonyl stress properties in green, yellow and red sweet bell peppers (Capsicum annuum L.).Nat Prod Res. 2016;30(5):583-9. doi: 10.1080/14786419.2015.1026343. Epub 2015 Apr 13. Nat Prod Res. 2016. PMID: 25868614
-
Characterization of the pigment fraction in sweet bell peppers (Capsicum annuum L.) harvested at green and overripe yellow and red stages by offline multidimensional convergence chromatography/liquid chromatography-mass spectrometry.J Sep Sci. 2016 Sep;39(17):3281-91. doi: 10.1002/jssc.201600220. J Sep Sci. 2016. PMID: 27391392
-
Analysis of native carotenoid composition of sweet bell peppers by serially coupled C30 columns.Nat Prod Commun. 2011 Dec;6(12):1817-20. Nat Prod Commun. 2011. PMID: 22312714
-
Biochemistry and molecular biology of carotenoid biosynthesis in chili peppers (Capsicum spp.).Int J Mol Sci. 2013 Sep 16;14(9):19025-53. doi: 10.3390/ijms140919025. Int J Mol Sci. 2013. PMID: 24065101 Free PMC article. Review.
-
Final report on the safety assessment of capsicum annuum extract, capsicum annuum fruit extract, capsicum annuum resin, capsicum annuum fruit powder, capsicum frutescens fruit, capsicum frutescens fruit extract, capsicum frutescens resin, and capsaicin.Int J Toxicol. 2007;26 Suppl 1:3-106. doi: 10.1080/10915810601163939. Int J Toxicol. 2007. PMID: 17365137 Review.
Cited by
-
The Evolution of Lipidomics during Oil Accumulation of Plukenetia volubilis Seeds.Plants (Basel). 2024 Aug 8;13(16):2193. doi: 10.3390/plants13162193. Plants (Basel). 2024. PMID: 39204629 Free PMC article.
-
Multi-omics approaches: transforming the landscape of natural product isolation.Funct Integr Genomics. 2025 Jun 19;25(1):132. doi: 10.1007/s10142-025-01645-7. Funct Integr Genomics. 2025. PMID: 40537580 Review.
-
Foodomics: Analytical Opportunities and Challenges.Anal Chem. 2022 Jan 11;94(1):366-381. doi: 10.1021/acs.analchem.1c04678. Epub 2021 Nov 23. Anal Chem. 2022. PMID: 34813295 Free PMC article. No abstract available.
-
Bell Peppers (Capsicum annum L.) Losses and Wastes: Source for Food and Pharmaceutical Applications.Molecules. 2021 Sep 2;26(17):5341. doi: 10.3390/molecules26175341. Molecules. 2021. PMID: 34500773 Free PMC article. Review.
-
Metabolomics Profiling of White Button, Crimini, Portabella, Lion's Mane, Maitake, Oyster, and Shiitake Mushrooms Using Untargeted Metabolomics and Targeted Amino Acid Analysis.Foods. 2023 Aug 8;12(16):2985. doi: 10.3390/foods12162985. Foods. 2023. PMID: 37627983 Free PMC article.
References
-
- Ulaszewska M.M., Weinert C.H., Trimigno A., Portmann R., Lacueva C.A., Badertscher R., Brennan L., Brunius C., Bub A., Capozzi F., et al. Nutrimetabolomics: An Integrative Action for Metabolomic Analyses in Human Nutritional Studies. Mol. Nutr. Food Res. 2019;63:e1800384. doi: 10.1002/mnfr.201800384. - DOI - PubMed
Grants and funding
LinkOut - more resources
Full Text Sources
Other Literature Sources
