

Comparison of Throat Washings, Nasopharyngeal Swabs and Oropharyngeal Swabs for Detection of SARS-CoV-2
- PMID: 33920072
- PMCID: PMC8069237
- DOI: 10.3390/v13040653
Comparison of Throat Washings, Nasopharyngeal Swabs and Oropharyngeal Swabs for Detection of SARS-CoV-2
Abstract
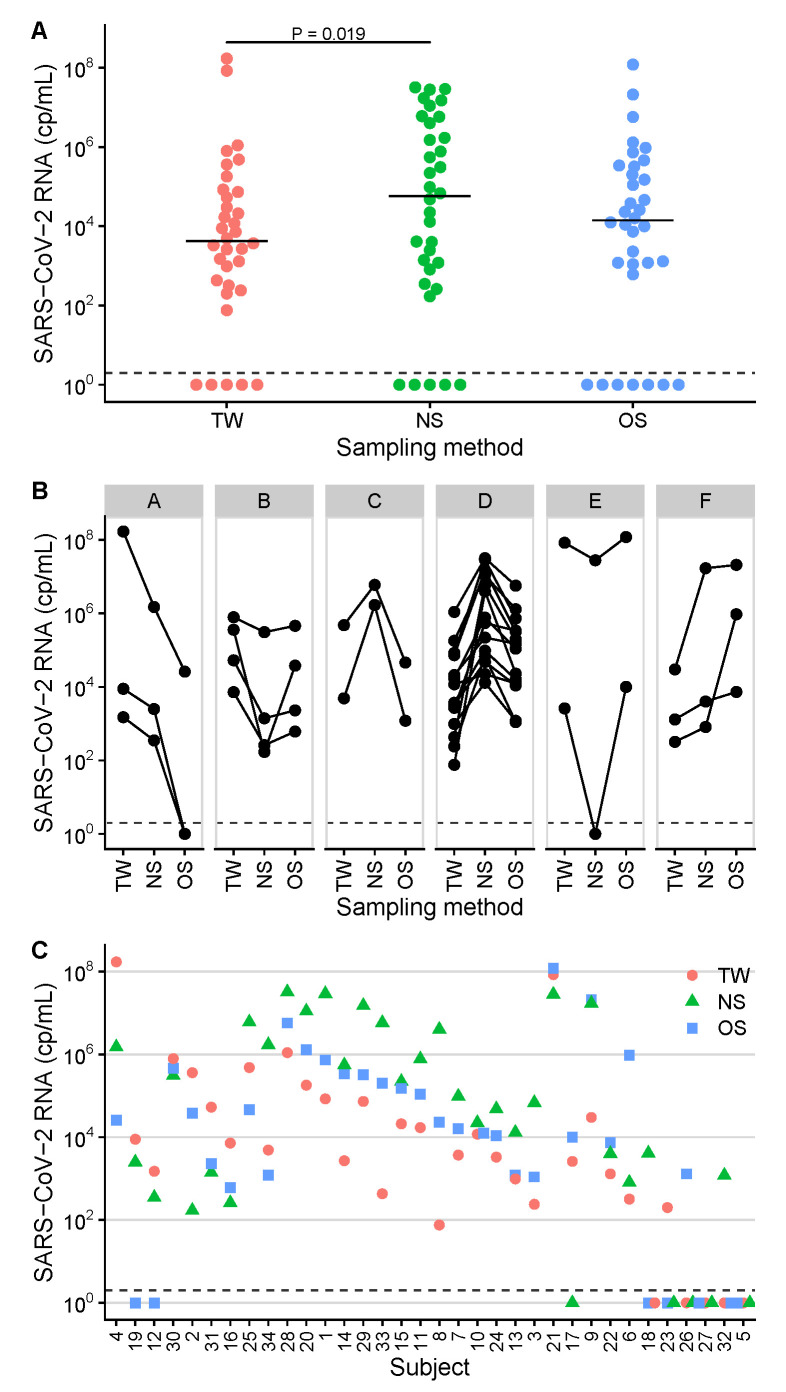
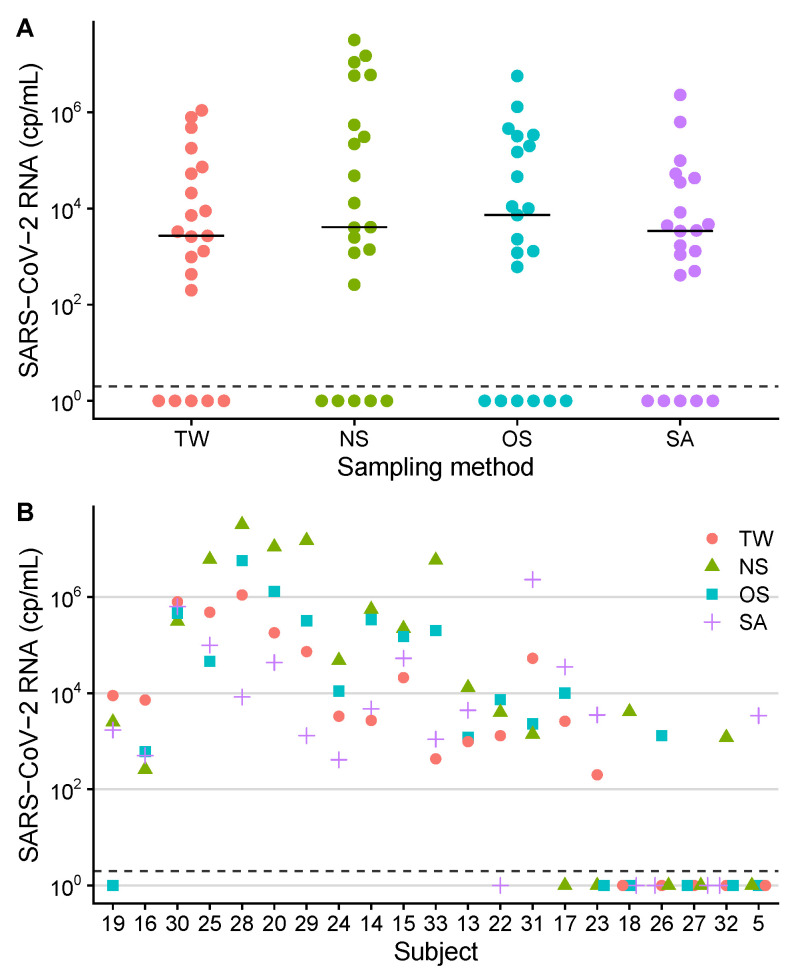
Severe Acute Respiratory Syndrome Coronavirus 2 (SARS-CoV-2) RNA is detected by reverse-transcription quantitative real-time PCR (RT-qPCR) from respiratory specimens. This study compares throat washings (TW), nasopharyngeal swabs (NS) and oropharyngeal swabs (OS). A total of 102 samples from 34 adult patients with confirmed SARS-CoV-2 infection were analysed by RT-qPCR with absolute quantification. The median concentrations and diagnostic sensitivities were 5.8×10⁴ copies/mL, 85% (NS), 1.4×10⁴, 79% (OS) and 4.3×10³, 85% (TW). Concentration differences were significant between NS and TW (P = 0.019). Saliva (SA) was available from 21 patients (median 3.4×10³). OS and TW can be considered for SARS-CoV-2 diagnostics, although with slightly lower concentrations.
Keywords: COVID-19; PCR; RT-qPCR; SARS-CoV-2; diagnostic sensitivity; nasopharyngeal swab; nucleic acid test; oropharyngeal swab; saliva; throat washing.
Conflict of interest statement
Hitzenbichler received payments for lectures by MSD Sharp and Dohme and travel grants by Gilead Sciences. Salzberger received payments for lectures by Falk Foundation and consulting fees by Sanofi and GSK. These companies had no role in the design of the study; in the collection, analyses, or interpretation of data; in the writing of the manuscript, or in the decision to publish the results.
Figures
Similar articles
-
Combined throat/nasal swab sampling for SARS-CoV-2 is equivalent to nasopharyngeal sampling.Eur J Clin Microbiol Infect Dis. 2021 Jan;40(1):193-195. doi: 10.1007/s10096-020-03972-y. Epub 2020 Jul 14. Eur J Clin Microbiol Infect Dis. 2021. PMID: 32666481 Free PMC article.
-
Diagnostic Performance of Self-Collected Saliva Versus Nasopharyngeal Swab for the Molecular Detection of SARS-CoV-2 in the Clinical Setting.Microbiol Spectr. 2021 Dec 22;9(3):e0046821. doi: 10.1128/Spectrum.00468-21. Epub 2021 Nov 3. Microbiol Spectr. 2021. PMID: 34730436 Free PMC article.
-
Comparison of SARS-CoV-2 PCR-Based Detection Using Saliva or Nasopharyngeal Swab Specimens in Asymptomatic Populations.Microbiol Spectr. 2021 Sep 3;9(1):e0006221. doi: 10.1128/Spectrum.00062-21. Epub 2021 Aug 25. Microbiol Spectr. 2021. PMID: 34431689 Free PMC article.
-
Diagnostic performance of different sampling approaches for SARS-CoV-2 RT-PCR testing: a systematic review and meta-analysis.Lancet Infect Dis. 2021 Sep;21(9):1233-1245. doi: 10.1016/S1473-3099(21)00146-8. Epub 2021 Apr 12. Lancet Infect Dis. 2021. PMID: 33857405 Free PMC article.
-
Screening for SARS-CoV-2 by RT-PCR: Saliva or nasopharyngeal swab? Rapid review and meta-analysis.PLoS One. 2021 Jun 10;16(6):e0253007. doi: 10.1371/journal.pone.0253007. eCollection 2021. PLoS One. 2021. PMID: 34111196 Free PMC article.
Cited by
-
Feasibility of a surveillance programme based on gargle samples and pool testing to prevent SARS-CoV-2 outbreaks in schools.Sci Rep. 2021 Sep 30;11(1):19521. doi: 10.1038/s41598-021-98849-1. Sci Rep. 2021. PMID: 34593887 Free PMC article.
-
Molecular Diagnosis of COVID-19; Biosafety and Pre-analytical Recommendations.Iran J Pathol. 2023 Summer;18(3):244-256. doi: 10.30699/IJP.2023.1988405.3061. Epub 2023 Jul 16. Iran J Pathol. 2023. PMID: 37942195 Free PMC article. Review.
-
Targeted escape of SARS-CoV-2 in vitro from monoclonal antibody S309, the precursor of sotrovimab.Front Immunol. 2022 Aug 24;13:966236. doi: 10.3389/fimmu.2022.966236. eCollection 2022. Front Immunol. 2022. PMID: 36090991 Free PMC article.
-
The Microbiota in Long COVID.Int J Mol Sci. 2024 Jan 22;25(2):1330. doi: 10.3390/ijms25021330. Int J Mol Sci. 2024. PMID: 38279329 Free PMC article. Review.
-
Global prevalence of coronavirus disease 2019 reinfection: a systematic review and meta-analysis.BMC Public Health. 2023 Apr 28;23(1):778. doi: 10.1186/s12889-023-15626-7. BMC Public Health. 2023. PMID: 37118717 Free PMC article.
References
-
- Jamal A.J., Mozafarihashjin M., Coomes E., Powis J., Li A.X., Paterson A., Anceva-Sami S., Barati S., Crowl G., Faheem A., et al. Sensitivity of Nasopharyngeal Swabs and Saliva for the Detection of Severe Acute Respiratory Syndrome Coronavirus 2. Clin. Infect. Dis. 2021;72:1064–1066. doi: 10.1093/cid/ciaa848. - DOI - PMC - PubMed
Publication types
MeSH terms
Substances
LinkOut - more resources
Full Text Sources
Other Literature Sources
Medical
Miscellaneous
