

ARRB1 Regulates Metabolic Reprogramming to Promote Glycolysis in Stem Cell-Like Bladder Cancer Cells
- PMID: 33920080
- PMCID: PMC8069028
- DOI: 10.3390/cancers13081809
ARRB1 Regulates Metabolic Reprogramming to Promote Glycolysis in Stem Cell-Like Bladder Cancer Cells
Abstract
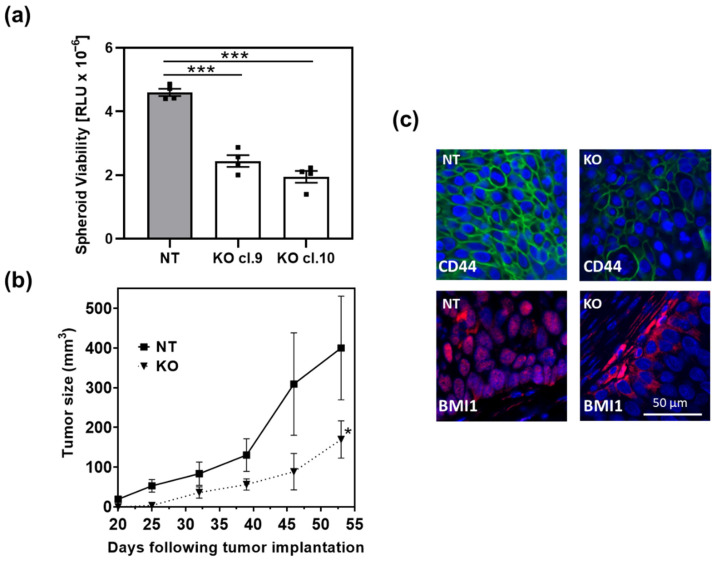
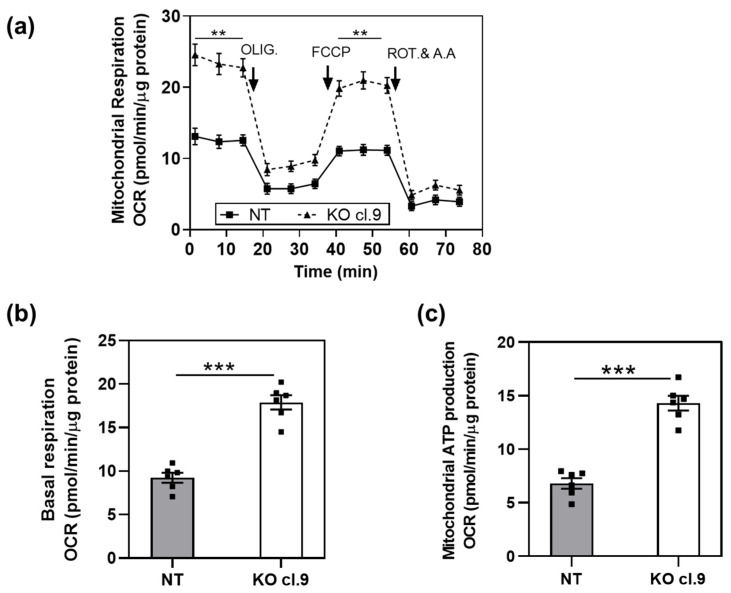
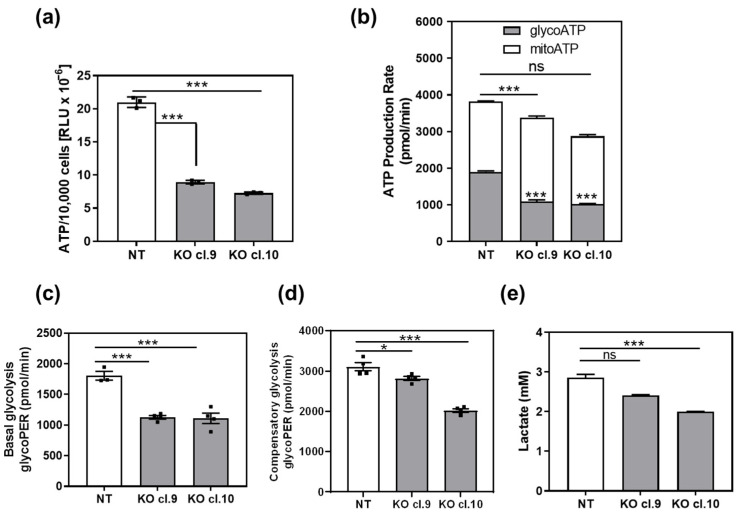
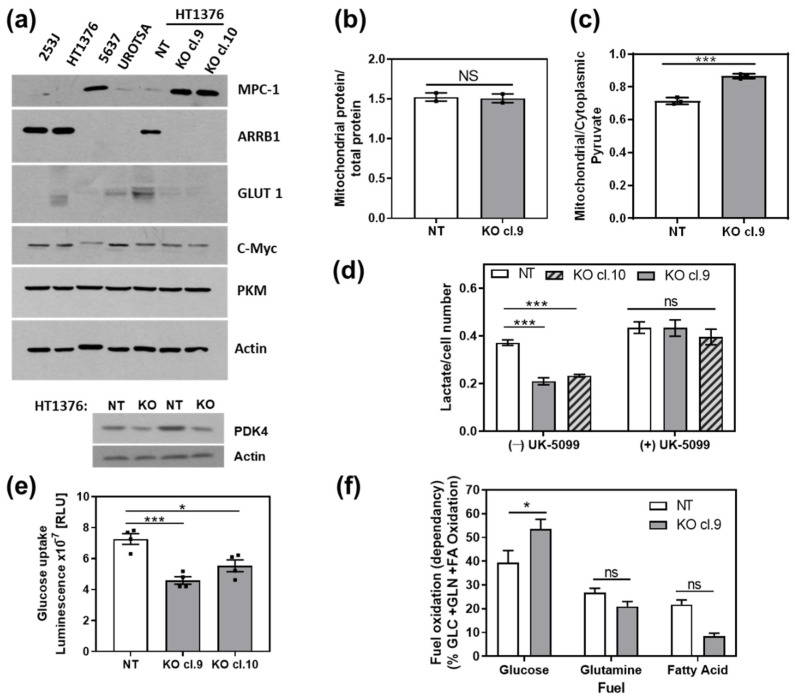
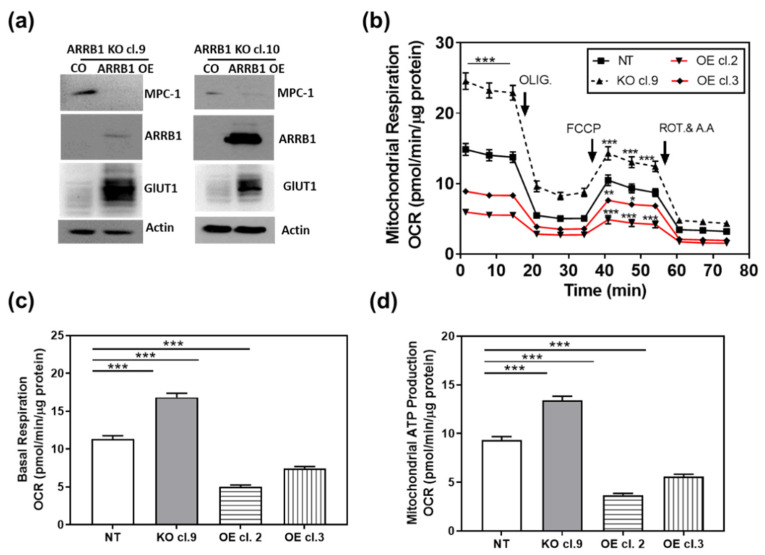
β-arrestin 1 (ARRB1) is a scaffold protein that regulates signaling downstream of G protein-coupled receptors (GPCRs). In the current work, we investigated the role of ARRB1 in regulating the metabolic preference of cancer stem cell (CSC)-like cells in bladder cancer (BC). We show that ARRB1 is crucial for spheroid formation and tumorigenic potential. Furthermore, we measured mitochondrial respiration, glucose uptake, glycolytic rate, mitochondrial/glycolytic ATP production and fuel oxidation in previously established ARRB1 knock out (KO) cells and corresponding controls. Our results demonstrate that depletion of ARRB1 decreased glycolytic rate and induced metabolic reprogramming towards oxidative phosphorylation. Mechanistically, the depletion of ARRB1 dramatically increased the mitochondrial pyruvate carrier MPC1 protein levels and reduced the glucose transporter GLUT1 protein levels along with glucose uptake. Overexpression of ARRB1 in ARRB1 KO cells reversed the phenotype and resulted in the upregulation of glycolysis. In conclusion, we show that ARRB1 regulates the metabolic preference of BC CSC-like cells and functions as a molecular switch that promotes reprogramming towards glycolysis by negatively regulating MPC1 and positively regulating GLUT1/ glucose uptake. These observations open new therapeutic avenues for targeting the metabolic preferences of cancer stem cell (CSC)-like BC cells.
Keywords: bladder cancer; cancer system cells; glucose transporter; metabolic reprograming; mitochondrial pyruvate carrier; β-arrestin 1.
Conflict of interest statement
The authors declare no conflict of interest. The funders had no role in the design of the study; in the collection, analyses, or interpretation of data; in the writing of the manuscript, or in the decision to publish the results.
Figures
Similar articles
-
Dual roles of β-arrestin 1 in mediating cell metabolism and proliferation in gastric cancer.Proc Natl Acad Sci U S A. 2022 Oct 4;119(40):e2123231119. doi: 10.1073/pnas.2123231119. Epub 2022 Sep 26. Proc Natl Acad Sci U S A. 2022. PMID: 36161910 Free PMC article.
-
The RUNX2 Transcription Factor Negatively Regulates SIRT6 Expression to Alter Glucose Metabolism in Breast Cancer Cells.J Cell Biochem. 2015 Oct;116(10):2210-26. doi: 10.1002/jcb.25171. J Cell Biochem. 2015. PMID: 25808624 Free PMC article.
-
SIRT1 promotes GLUT1 expression and bladder cancer progression via regulation of glucose uptake.Hum Cell. 2019 Apr;32(2):193-201. doi: 10.1007/s13577-019-00237-5. Epub 2019 Mar 13. Hum Cell. 2019. PMID: 30868406
-
Metabolic phenotype of bladder cancer.Cancer Treat Rev. 2016 Apr;45:46-57. doi: 10.1016/j.ctrv.2016.03.005. Epub 2016 Mar 8. Cancer Treat Rev. 2016. PMID: 26975021 Review.
-
Mitochondrial pyruvate carrier 1: a novel prognostic biomarker that predicts favourable patient survival in cancer.Cancer Cell Int. 2021 May 31;21(1):288. doi: 10.1186/s12935-021-01996-8. Cancer Cell Int. 2021. PMID: 34059057 Free PMC article. Review.
Cited by
-
A first-in-class TIMM44 blocker inhibits bladder cancer cell growth.Cell Death Dis. 2024 Mar 11;15(3):204. doi: 10.1038/s41419-024-06585-x. Cell Death Dis. 2024. PMID: 38467612 Free PMC article.
-
Role of ARRB1 in prognosis and immunotherapy: A Pan-Cancer analysis.Front Mol Biosci. 2022 Sep 23;9:1001225. doi: 10.3389/fmolb.2022.1001225. eCollection 2022. Front Mol Biosci. 2022. PMID: 36213111 Free PMC article.
-
Emerging RNA-Based Therapeutic and Diagnostic Options: Recent Advances and Future Challenges in Genitourinary Cancers.Int J Mol Sci. 2023 Feb 27;24(5):4601. doi: 10.3390/ijms24054601. Int J Mol Sci. 2023. PMID: 36902032 Free PMC article. Review.
-
Fatty acid oxidation is critical for the tumorigenic potential and chemoresistance of pancreatic cancer stem cells.J Transl Med. 2024 Aug 28;22(1):797. doi: 10.1186/s12967-024-05598-6. J Transl Med. 2024. PMID: 39198858 Free PMC article.
-
Construction of Prognostic Risk Model for Small Cell Lung Cancer Based on Immune-Related Genes.Comput Math Methods Med. 2022 Sep 30;2022:7116080. doi: 10.1155/2022/7116080. eCollection 2022. Comput Math Methods Med. 2022. PMID: 36245844 Free PMC article.
References
-
- Simsek T., Kocabas F., Zheng J., Deberardinis R.J., Mahmoud A.I., Olson E.N., Schneider J.W., Zhang C.C., Sadek H.A. The distinct metabolic profile of hematopoietic stem cells reflects their location in a hypoxic niche. Cell Stem Cell. 2010;7:380–390. doi: 10.1016/j.stem.2010.07.011. - DOI - PMC - PubMed
Grants and funding
LinkOut - more resources
Full Text Sources
Other Literature Sources
Research Materials
Miscellaneous
