

Bergamottin and 5-Geranyloxy-7-methoxycoumarin Cooperate in the Cytotoxic Effect of Citrus bergamia (Bergamot) Essential Oil in Human Neuroblastoma SH-SY5Y Cell Line
- PMID: 33920139
- PMCID: PMC8069240
- DOI: 10.3390/toxins13040275
Bergamottin and 5-Geranyloxy-7-methoxycoumarin Cooperate in the Cytotoxic Effect of Citrus bergamia (Bergamot) Essential Oil in Human Neuroblastoma SH-SY5Y Cell Line
Abstract
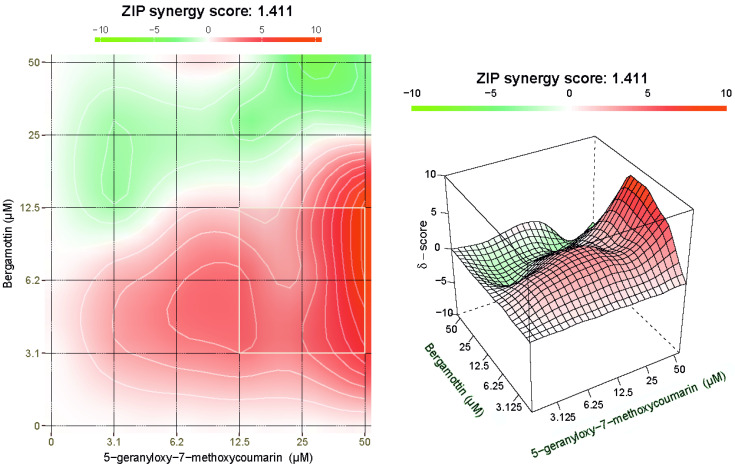
The plant kingdom has always been a treasure trove for valuable bioactive compounds, and Citrus fruits stand out among the others. Bergamottin (BRG) and 5-geranyloxy-7-methoxycoumarin (5-G-7-MOC) are two coumarins found in different Citrus species with well-acknowledged pharmacological properties. Previously, they have been claimed to be relevant in the anti-proliferative effects exerted by bergamot essential oil (BEO) in the SH-SY5Y human neuroblastoma cells. This study was designed to verify this assumption and to assess the mechanisms underlying the anti-proliferative effect of both compounds. Our results demonstrate that BRG and 5-G-7-MOC are able to reduce the proliferation of SH-SY5Y cells, inducing apoptosis and increasing cell population in sub-G0/G1 phase. Moreover, we demonstrated the pro-oxidant activity of the two coumarins that increased reactive oxygen species and impaired mitochondrial membrane potential. From a molecular point of view, BRG and 5-G-7-MOC were able to modulate apoptosis related factors at both protein and gene levels. Lastly, we evaluated the synergistic effect of their combination, finding that the highest synergy was observed at a concentration ratio similar to that occurring in the BEO, supporting our initial hypothesis. Taken together, our results deepen the knowledge regarding the effect of BRG and 5-G-7-MOC in SH-SY5Y cells, emphasizing the relevance of their cooperation in achieving this effect.
Keywords: 5-geranyloxy-7-methoxycoumarin; Citrus bergamia; bergamot; bergamottin; cancer; coumarin; pharmacological combination; psoralen.
Conflict of interest statement
The authors declare no conflict of interest.
Figures


Similar articles
-
Effects of bergamot essential oil and its extractive fractions on SH-SY5Y human neuroblastoma cell growth.J Pharm Pharmacol. 2015 Aug;67(8):1042-53. doi: 10.1111/jphp.12403. Epub 2015 Mar 24. J Pharm Pharmacol. 2015. PMID: 25808679
-
Implication of limonene and linalyl acetate in cytotoxicity induced by bergamot essential oil in human neuroblastoma cells.Fitoterapia. 2013 Sep;89:48-57. doi: 10.1016/j.fitote.2013.05.014. Epub 2013 May 23. Fitoterapia. 2013. PMID: 23707744
-
Bergamottin isolated from Citrus bergamia exerts in vitro and in vivo antitumor activity in lung adenocarcinoma through the induction of apoptosis, cell cycle arrest, mitochondrial membrane potential loss and inhibition of cell migration and invasion.Oncol Rep. 2016 Jul;36(1):324-32. doi: 10.3892/or.2016.4833. Epub 2016 May 23. Oncol Rep. 2016. Retraction in: Oncol Rep. 2021 Jun;45(6):107. doi: 10.3892/or.2021.8058. PMID: 27222242 Retracted.
-
Citrus bergamia essential oil: from basic research to clinical application.Front Pharmacol. 2015 Mar 2;6:36. doi: 10.3389/fphar.2015.00036. eCollection 2015. Front Pharmacol. 2015. PMID: 25784877 Free PMC article. Review.
-
Bergaptol, a Major Furocoumarin in Citrus: Pharmacological Properties and Toxicity.Molecules. 2024 Feb 4;29(3):713. doi: 10.3390/molecules29030713. Molecules. 2024. PMID: 38338457 Free PMC article. Review.
Cited by
-
Investigating Bergamot Essential Oil (BEO) Properties: Cytoprotection in Neuronal Cells Exposed to Heavy Metals and Antibacterial Activities.Antioxidants (Basel). 2025 Mar 27;14(4):400. doi: 10.3390/antiox14040400. Antioxidants (Basel). 2025. PMID: 40298618 Free PMC article.
-
The Second Life of Citrus Fruit Waste: A Valuable Source of Bioactive Compounds.Molecules. 2021 Oct 2;26(19):5991. doi: 10.3390/molecules26195991. Molecules. 2021. PMID: 34641535 Free PMC article. Review.
-
The Anticancer Effect of a Flavonoid-Rich Extract of Bergamot Juice in THP-1 Cells Engages the SIRT2/AKT/p53 Pathway.Pharmaceutics. 2022 Oct 11;14(10):2168. doi: 10.3390/pharmaceutics14102168. Pharmaceutics. 2022. PMID: 36297603 Free PMC article.
-
Phenolic Compounds in Fractionated Blackcurrant Leaf Extracts in Relation to the Biological Activity of the Extracts.Molecules. 2023 Nov 7;28(22):7459. doi: 10.3390/molecules28227459. Molecules. 2023. PMID: 38005180 Free PMC article.
-
Quality Standards and Pharmacological Interventions of Natural Oils: Current Scenario and Future Perspectives.ACS Omega. 2023 Oct 17;8(43):39945-39963. doi: 10.1021/acsomega.3c05241. eCollection 2023 Oct 31. ACS Omega. 2023. PMID: 37953833 Free PMC article. Review.
References
MeSH terms
Substances
LinkOut - more resources
Full Text Sources
Other Literature Sources
Medical
