. 2021 Apr 10;22(8):3920.
doi: 10.3390/ijms22083920.

Chronic Ouabain Prevents Na,K-ATPase Dysfunction and Targets AMPK and IL-6 in Disused Rat Soleus Muscle

Affiliations

Chronic Ouabain Prevents Na,K-ATPase Dysfunction and Targets AMPK and IL-6 in Disused Rat Soleus Muscle

Violetta V Kravtsova et al. Int J Mol Sci. .

Abstract

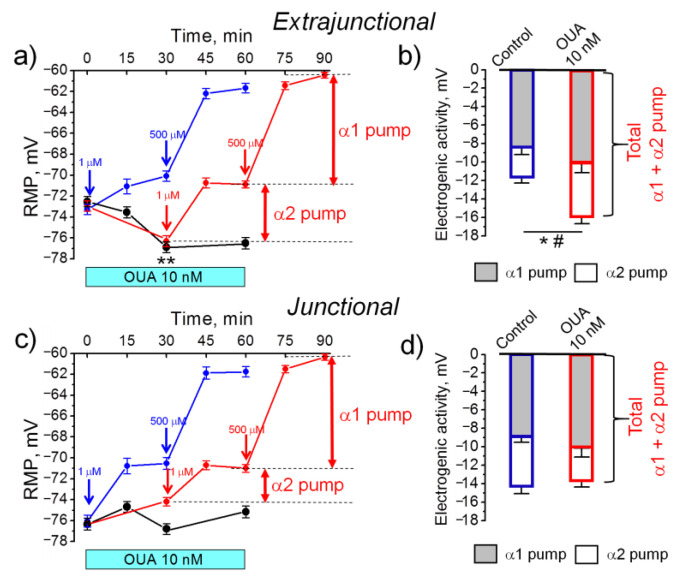
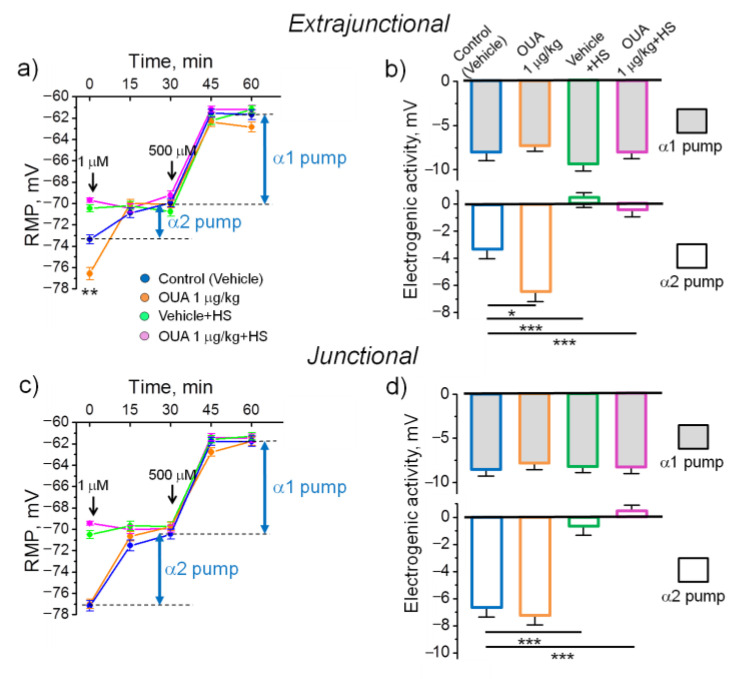
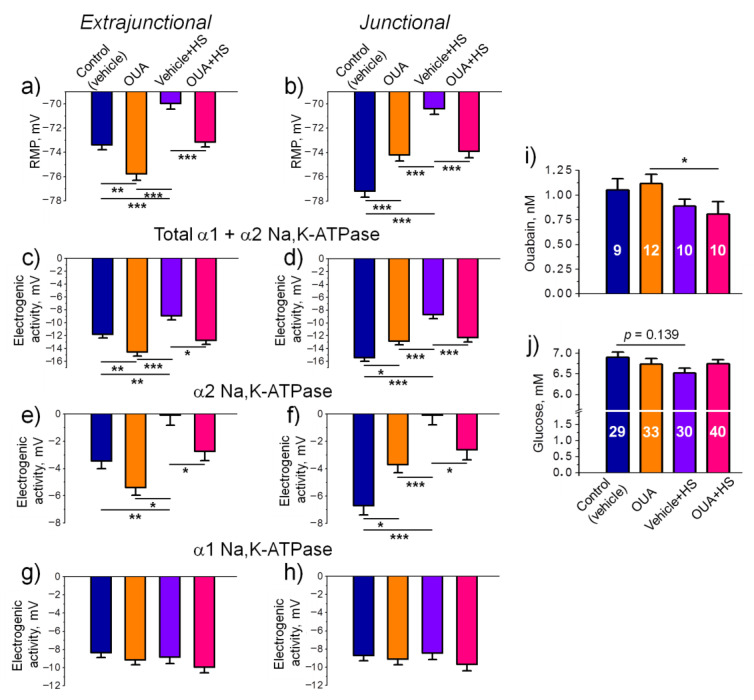
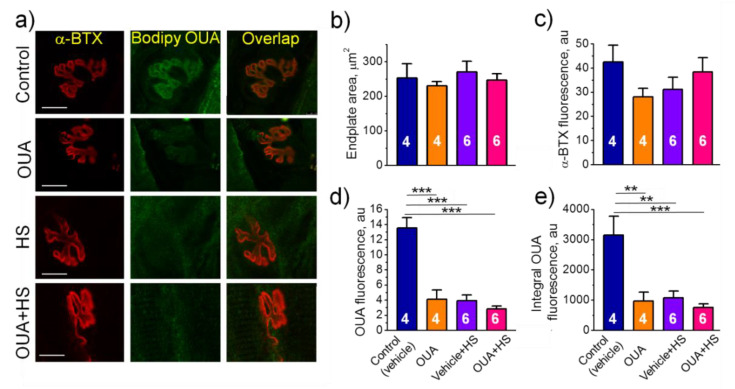
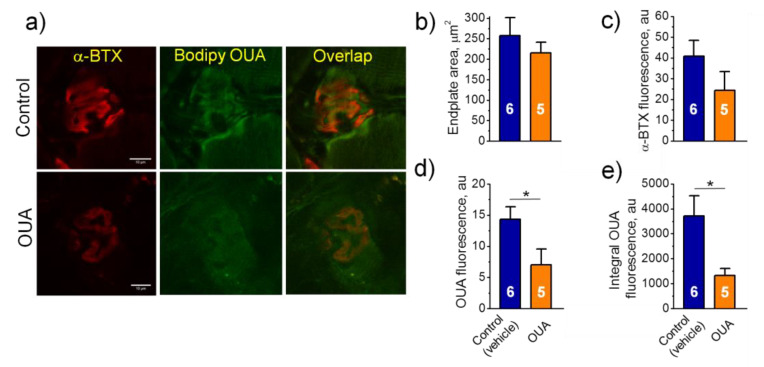
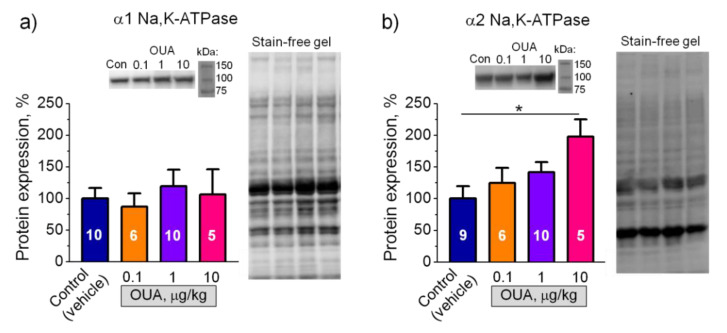
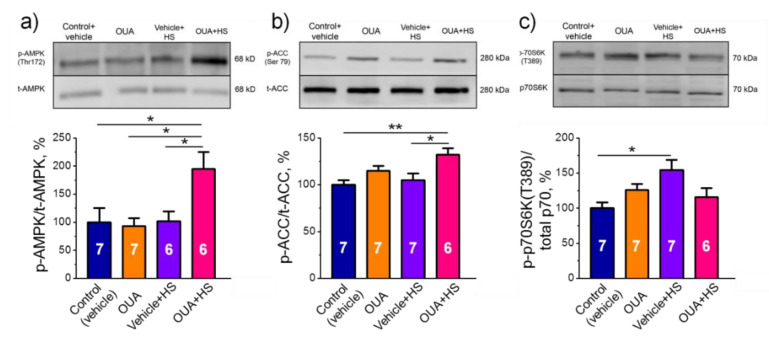
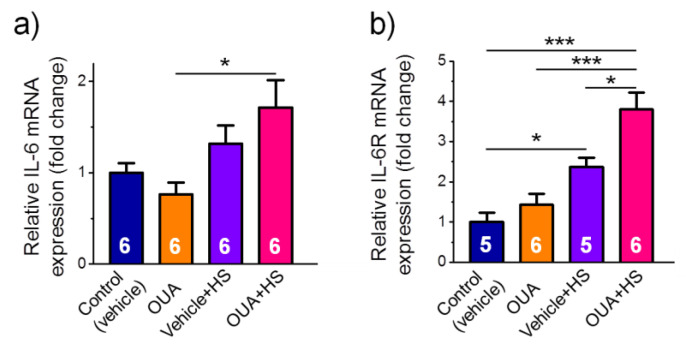
Sustained sarcolemma depolarization due to loss of the Na,K-ATPase function is characteristic for skeletal muscle motor dysfunction. Ouabain, a specific ligand of the Na,K-ATPase, has a circulating endogenous analogue. We hypothesized that the Na,K-ATPase targeted by the elevated level of circulating ouabain modulates skeletal muscle electrogenesis and prevents its disuse-induced disturbances. Isolated soleus muscles from rats intraperitoneally injected with ouabain alone or subsequently exposed to muscle disuse by 6-h hindlimb suspension (HS) were studied. Conventional electrophysiology, Western blotting, and confocal microscopy with cytochemistry were used. Acutely applied 10 nM ouabain hyperpolarized the membrane. However, a single injection of ouabain (1 µg/kg) prior HS was unable to prevent the HS-induced membrane depolarization. Chronic administration of ouabain for four days did not change the α1 and α2 Na,K-ATPase protein content, however it partially prevented the HS-induced loss of the Na,K-ATPase electrogenic activity and sarcolemma depolarization. These changes were associated with increased phosphorylation levels of AMP-activated protein kinase (AMPK), its substrate acetyl-CoA carboxylase and p70 protein, accompanied with increased mRNA expression of interleikin-6 (IL-6) and IL-6 receptor. Considering the role of AMPK in regulation of the Na,K-ATPase, we suggest an IL-6/AMPK contribution to prevent the effects of chronic ouabain under skeletal muscle disuse.

Keywords: AMP-activated protein kinase; Na,K-ATPase isozymes; hindlimb suspension; ouabain; resting membrane potential; skeletal muscle.


Conflict of interest statement

The authors declare no conflict of interest.

Figures

Figure 1
Figure 1
The effect of 10 nM ouabain on resting membrane potential (RMP) and electrogenic contribution of the α1 and α2 Na,K-ATPase in the sarcolemma of rat soleus muscles. The measurements were done in the (a,b) extrajunctional and (c,d) junctional regions of sarcolemma. (a,c) Black circles and lines show the RMP changes upon 10 nM ouabain incubation in bath solution at different time-points over 60 min experiment, as indicated. Red circles and lines show the RMP changes when bath ouabain concentration was increased from 10 nM to 1 µM and 500 µM (indicated by corresponding arrows) to estimate the electrogenic contribution of the α1 and α2 Na,K-ATPase (see also the Methods). Blue circles and lines demonstrate control measurements without pre-incubation with 10 nM ouabain, where the electrogenic contribution of the α1 and α2 Na,K-ATPase was estimated as above. (b,d) The estimated electrogenic contribution of the α1 and α2 Na,K-ATPase under control conditions and in the presence of 10 nM ouabain is shown in (a) and (c). Each data point is a mean value of membrane potentials measured in at least 100 fibers of 6–8 soleus muscles from 3–4 rats. One-way ANOVA. (a) ** p < 0.01—RMP compared to the corresponding initial value. (b) * p < 0.05—the α2 Na,K-ATPase contribution and # p < 0.05—total α1 and α2 Na,K-ATPase contribution compared with the control conditions.
Figure 2
Figure 2
The effects of a single injection of ouabain prior to HS. The resting membrane potential (RMP) (a,c) and electrogenic contributions of the α1 and α2 Na,K-ATPase (b,d) in rat soleus muscles after 6 h of HS. The measurements were done in extrajunctional (a,b) and junctional (c,d) sarcolemma regions. Injection of either ouabain (1 µg/kg) or vehicle 0.9% NaCl was done immediately prior HS. The results were compared to 6-h measurements after vehicle (control) or 1 µg/kg ouabain injections (both without HS). The electrogenic contribution of the α2 and α1 Na,K-ATPase was estimated by administration of 1 µM or 500 µM ouabain (indicated by the corresponding arrows). Each data point corresponds to the averaged RMP measured in at least of 100 muscle fibers of 6–10 muscles from 3–5 rats. Two-way ANOVA followed by Tukey’s multiple comparisons test. (a) ** p < 0.01—RMP value compared to the corresponding control. (b,d) * p < 0.05, *** p < 0.001—compared as indicated by horizontal bars.
Figure 3
Figure 3
Changes in the electrogenesis of soleus muscles after 4-days pre-treatment with ouabain (1 μg/kg) followed by rat hindlimb suspension (HS) for 6 h. (a,b) Resting membrane potential (RMP). (c,d) Total electrogenic activity contributed by the α1 and α2 isozymes of Na,K-ATPase. (e,f) Electrogenic activity of the α2 isozyme of Na,K-ATPase. (g,h) Electrogenic activity of the α1 isozyme of Na,K-ATPase. The measurements in (ag) extrajunctional and (bh) junctional regions of the membrane, as indicated. (i,j) Serum level of ouabain and glucose, respectively (the number of rats is shown in the bars). Control and ouabain-treated (OUA) groups are represented by the rats, which received injections of vehicle (0.9% NaCl) or ouabain for 4 days, respectively. HS group contains the rats injected by 0.9% NaCl followed by HS for 6 h. OUA + HS group is a group of ouabain-injected rats that were exposed for the following 6-h HS. Each value is a result of measuring the RMP in at least 100 muscle fibers of 6–10 muscles from 3–5 rats. There was a significant interaction between HS and OUA effects for (b) p < 0.0001; F (1.614) = 42.15; (d) p < 0.0001; F (1.596) = 24.64 and (f) p < 0.0001; F (1.596) = 16.97. Two-way ANOVA followed by Tukey’s multiple comparisons test. * p < 0.05, ** p < 0.01, *** p < 0.001—compared as indicated by horizontal bars.
Figure 4
Figure 4
Characteristics of the α2 Na,K-ATPase localization in the rat soleus muscles. (a) Representative images of endplates dual-labeled with α-BTX (nAChRs, red channel) and BODIPY-conjugated ouabain (α2 Na,K-ATPase, green channel). Overlap—orange. Scale bars—10 μm. (b,c) Averaged area of endplates and fluorescence intensity (arbitrary units) from the nAChR staining, respectively. (d,e) Averaged fluorescence intensity and integral intensity over the entire area of endplates from the α2 Na,K-ATPase staining (arbitrary units). Control and ouabain-treated (OUA) groups are represented by the rats, which received injections of vehicle (0.9% NaCl) or ouabain for 4 days, respectively. HS group includes the rats injected by vehicle followed by HS for 6 h. OUA + HS group is a group of ouabain-injected rats that were exposed for the following 6 h HS. Each data point is a mean value measured in muscles from 4–6 rats, as indicated (17–50 endplates per group). There was a significant interaction between HS and OUA effects for (d) p = 0.0002; F (1.16) = 23.12); and (e) p = 0.0095; F (1.16) = 8.663. Two-way ANOVA followed by Tukey’s multiple comparisons test. ** p < 0.01, *** p < 0.001—compared as indicated by horizontal bars.
Figure 5
Figure 5
Characteristics of the α2 Na,K-ATPase localization in the rat diaphragm muscles. (a) Representative images of endplates dual-labeled with α-BTX (nAChRs, red channel) and BODIPY-conjugated ouabain (α2 Na,K-ATPase, green channel). Overlap—orange. Scale bars—10 μm. (b,c) Averaged area of endplates and fluorescence intensity (arbitrary units) from the nAChR staining, respectively. (d,e) Averaged fluorescence intensity and integral intensity over the entire area of the endplates from the α2 Na,K-ATPase staining (arbitrary units). Control and ouabain-treated (OUA) groups are represented by the rats, which received injections of vehicle (0.9% NaCl) or ouabain for 4 days, respectively. Each data point is a mean value measured in muscles from 5–6 rats, as indicated (21–19 endplates per group). One-way ANOVA. * p < 0.05—compared with the control (vehicle treated group).
Figure 6
Figure 6
Effects of chronic exposure to ouabain on the protein content of α1 (a) and α2 (b) Na,K-ATPase in homogenate of rat soleus muscles. Rats were injected for 4 days with different doses (µg/kg) of ouabain as indicated. Control rats were injected with vehicle (0.9% NaCl). (a) and (b) Averaged Western blot results of the α1 and α2 isoform protein expression, respectively (the number of rats n = 5–10, as indicated); representative Western blots for semi-quantification of the Na,K-ATPase α1 and α2 isoforms are shown. Original images for Western blots using Stain-Free gels as a loading control are shown in Supplemental Materials. One-way ANOVA. * p < 0.05—compared with the control (vehicle treated group).
Figure 7
Figure 7
Pre-treatment with ouabain (1 μg/kg) for 4 days elevated the phosphorylation level of AMPK after 6-h HS. The relative phosphorylation levels of AMPK (a), ACC (b) and p70 (c) are shown. (ac) Averaged immunoblots analysis (the number of rats n = 6–7, as indicated); the top panels show corresponding representative immunoblots. Original images for immunoblots are shown in Supplemental Materials. Control and ouabain-treated (OUA) groups are represented by the rats, which received injections of vehicle (0.9% NaCl) or ouabain for 4 days, respectively. HS group contains the rats injected by vehicle followed by HS for 6 h. OUA + HS group is a group of ouabain-injected rats that were exposed for the following 6 h HS. There was a significant interaction between HS and OUA effects for (a) p = 0.0373; F (1.22) = 4.915; and (b) p = 0.0093; F (1.23) = 8.071. Two-way ANOVA followed by Tukey’s multiple comparisons test. * p < 0.05, ** p < 0.01—compared as indicated by horizontal bars.
Figure 8
Figure 8
Pre-treatment with ouabain (1 μg/kg) for 4 days modulates mRNA expression of IL-6 (a) and IL-6R (b) after 6-h HS. Relative expression is shown. Control and ouabain-treated (OUA) groups are represented by the rats, which received injections of vehicle (0.9% NaCl) or ouabain for 4 days, respectively. HS group contains the rats injected by vehicle followed by HS for 6 h. OUA + HS group is a group of ouabain-injected rats that were exposed for the following 6 h HS. The number of rats n = 5–6, as indicated. Two-way ANOVA followed by Tukey’s multiple comparisons test. * p < 0.05, *** p < 0.001—compared as indicated by horizontal bars.

Similar articles

Cited by

References

    1. Sejersted O.M., Sjogaard G. Dynamics and consequences of potassium shifts in skeletal muscle and heart during exercise. Physiol. Rev. 2000;80:1411–1481. doi: 10.1152/physrev.2000.80.4.1411. - DOI - PubMed
    1. Clausen T. Na+-K+ pump regulation and skeletal muscle contractility. Physiol. Rev. 2003;83:1269–1324. doi: 10.1152/physrev.00011.2003. - DOI - PubMed
    1. Clausen T. Quantification of Na+, K+ pumps and their transport rate in skeletal muscle: Functional significance. J. Gen. Physiol. 2013;142:327–345. doi: 10.1085/jgp.201310980. - DOI - PMC - PubMed
    1. Skou J.C. The influence of some cations on an adenosine triphosphatase from peripheral nerves. Biochim. Biophys. Acta. 1957;23:394–401. doi: 10.1016/0006-3002(57)90343-8. - DOI - PubMed
    1. Blanco G., Mercer R.W. Isozymes of the Na-K-ATPase: Heterogeneity in structure, diversity in function. Am. J. Physiol. 1998;275:F633–F655. doi: 10.1152/ajprenal.1998.275.5.F633. - DOI - PubMed

MeSH terms

LinkOut - more resources