

The Development of Bacteriophage Resistance in Vibrio alginolyticus Depends on a Complex Metabolic Adaptation Strategy
- PMID: 33920240
- PMCID: PMC8069663
- DOI: 10.3390/v13040656
The Development of Bacteriophage Resistance in Vibrio alginolyticus Depends on a Complex Metabolic Adaptation Strategy
Abstract
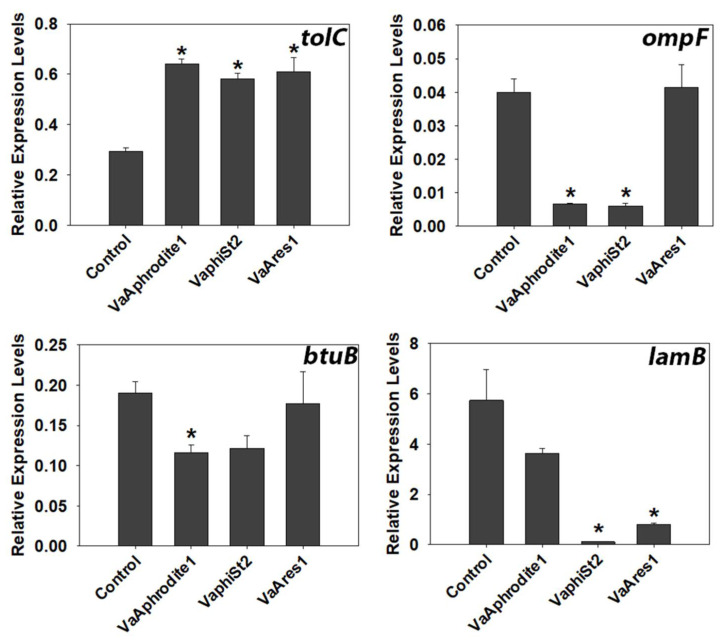
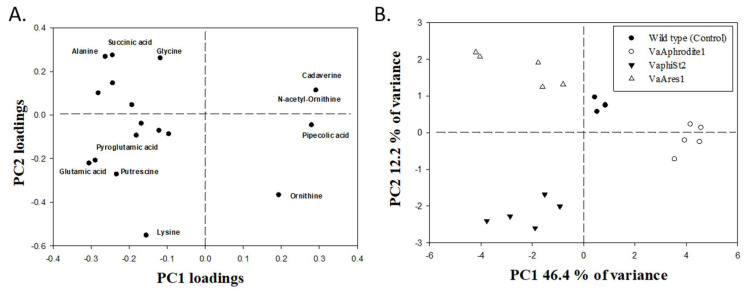
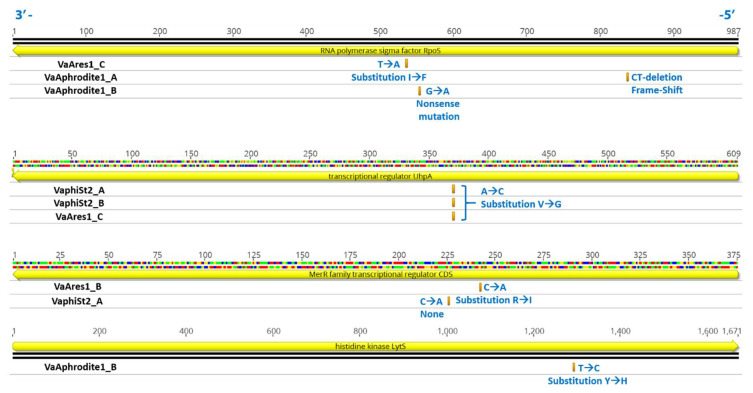
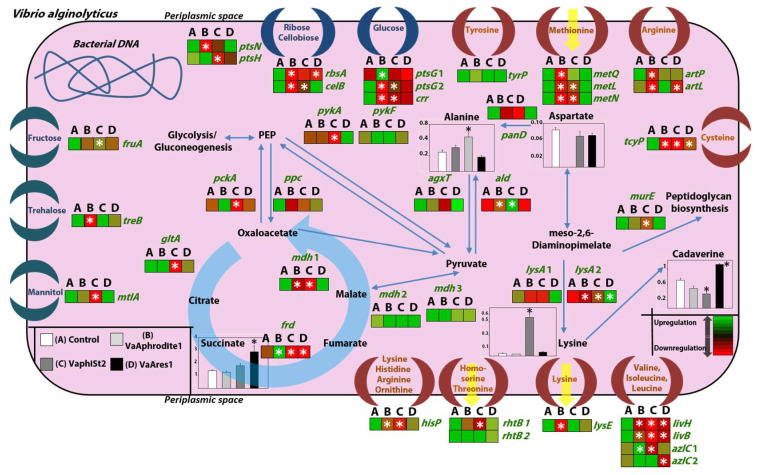
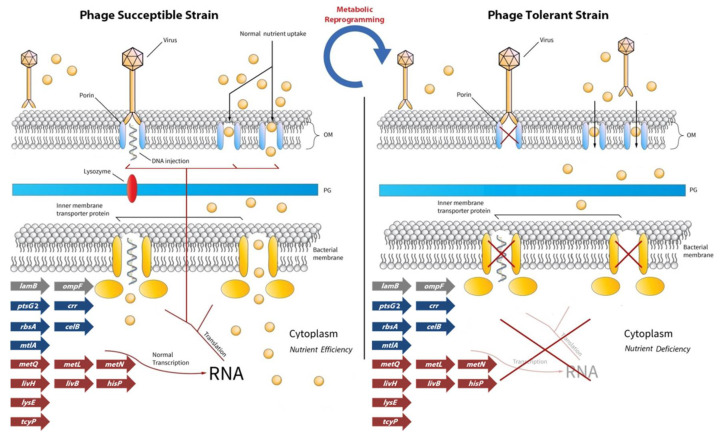
Lytic bacteriophages have been well documented to play a pivotal role in microbial ecology due to their complex interactions with bacterial species, especially in aquatic habitats. Although the use of phages as antimicrobial agents, known as phage therapy, in the aquatic environment has been increasing, recent research has revealed drawbacks due to the development of phage-resistant strains among Gram-negative species. Acquired phage resistance in marine Vibrios has been proven to be a very complicated process utilizing biochemical, metabolic, and molecular adaptation strategies. The results of our multi-omics approach, incorporating transcriptome and metabolome analyses of Vibrio alginolyticus phage-resistant strains, corroborate this prospect. Our results provide insights into phage-tolerant strains diminishing the expression of phage receptors ompF, lamB, and btuB. The same pattern was observed for genes encoding natural nutrient channels, such as rbsA, ptsG, tryP, livH, lysE, and hisp, meaning that the cell needs to readjust its biochemistry to achieve phage resistance. The results showed reprogramming of bacterial metabolism by transcript regulations in key-metabolic pathways, such as the tricarboxylic acid cycle (TCA) and lysine biosynthesis, as well as the content of intracellular metabolites belonging to processes that could also significantly affect the cell physiology. Finally, SNP analysis in resistant strains revealed no evidence of amino acid alterations in the studied putative bacterial phage receptors, but several SNPs were detected in genes involved in transcriptional regulation. This phenomenon appears to be a phage-specific, fine-tuned metabolic engineering, imposed by the different phage genera the bacteria have interacted with, updating the role of lytic phages in microbial marine ecology.
Keywords: Vibrio alginolyticus; acquired phage resistance; bacteriophages; host metabolism; host–phage interaction; metabolic reprogramming; receptors; transporters.
Conflict of interest statement
The authors declare no conflict of interest.
Figures
Similar articles
-
Genomic and biological characterization of the Vibrio alginolyticus-infecting "Podoviridae" bacteriophage, vB_ValP_IME271.Virus Genes. 2019 Apr;55(2):218-226. doi: 10.1007/s11262-018-1622-8. Epub 2019 Jan 9. Virus Genes. 2019. PMID: 30627984
-
Characterization and Genomic Analysis of ValSw3-3, a New Siphoviridae Bacteriophage Infecting Vibrio alginolyticus.J Virol. 2020 May 4;94(10):e00066-20. doi: 10.1128/JVI.00066-20. Print 2020 May 4. J Virol. 2020. PMID: 32132234 Free PMC article.
-
Understanding phage BX-1 resistance in Vibrio alginolyticus AP-1 and the role of quorum-sensing regulation.Microbiol Spectr. 2025 Feb 4;13(2):e0243524. doi: 10.1128/spectrum.02435-24. Epub 2025 Jan 14. Microbiol Spectr. 2025. PMID: 39807883 Free PMC article.
-
Phages amid antimicrobial resistance.Crit Rev Microbiol. 2019 Sep-Nov;45(5-6):701-711. doi: 10.1080/1040841X.2019.1691973. Epub 2019 Nov 27. Crit Rev Microbiol. 2019. PMID: 31775552 Review.
-
Pseudolysogeny.Adv Virus Res. 2012;82:339-49. doi: 10.1016/B978-0-12-394621-8.00019-4. Adv Virus Res. 2012. PMID: 22420857 Review.
Cited by
-
Isolation, complete characterization and phylogeography of the first bacteriophage against Vibrio neocaledonicus, which encodes a pyruvate phosphate dikinase and represents a novel viral family.Microb Genom. 2025 Apr;11(4):001403. doi: 10.1099/mgen.0.001403. Microb Genom. 2025. PMID: 40294083 Free PMC article.
-
Perturbation of Quorum Sensing after the Acquisition of Bacteriophage Resistance Could Contribute to Novel Traits in Vibrio alginolyticus.Microorganisms. 2023 Sep 10;11(9):2273. doi: 10.3390/microorganisms11092273. Microorganisms. 2023. PMID: 37764117 Free PMC article.
-
Pharmacokinetics and pharmacodynamics of bacteriophage therapy: a review with a focus on multidrug-resistant Gram-negative bacterial infections.Clin Microbiol Rev. 2024 Sep 12;37(3):e0004424. doi: 10.1128/cmr.00044-24. Epub 2024 Jul 29. Clin Microbiol Rev. 2024. PMID: 39072666 Free PMC article. Review.
-
Role of Bacteriophages in the Evolution of Pathogenic Vibrios and Lessons for Phage Therapy.Adv Exp Med Biol. 2023;1404:149-173. doi: 10.1007/978-3-031-22997-8_8. Adv Exp Med Biol. 2023. PMID: 36792875 Free PMC article.
-
Marine Bacteriophages as Next-Generation Therapeutics: Insights into Antimicrobial Potential and Application.Viruses. 2025 Jul 10;17(7):971. doi: 10.3390/v17070971. Viruses. 2025. PMID: 40733588 Free PMC article. Review.
References
Publication types
MeSH terms
LinkOut - more resources
Full Text Sources
Other Literature Sources
