

Robust Principal Component Thermography for Defect Detection in Composites
- PMID: 33920261
- PMCID: PMC8070624
- DOI: 10.3390/s21082682
Robust Principal Component Thermography for Defect Detection in Composites
Abstract
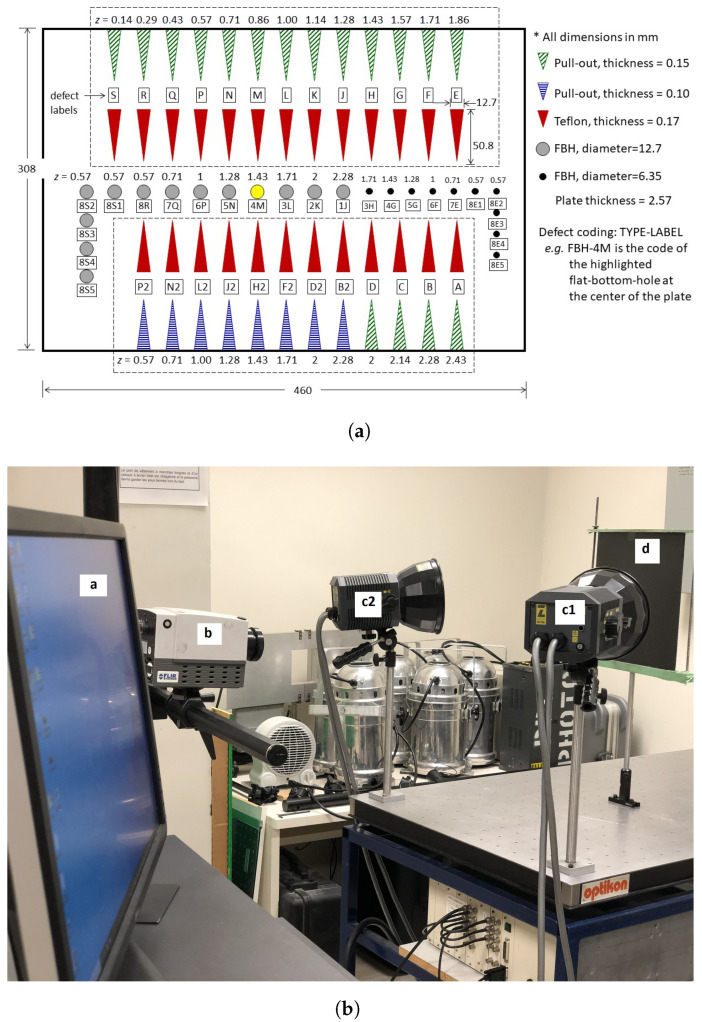
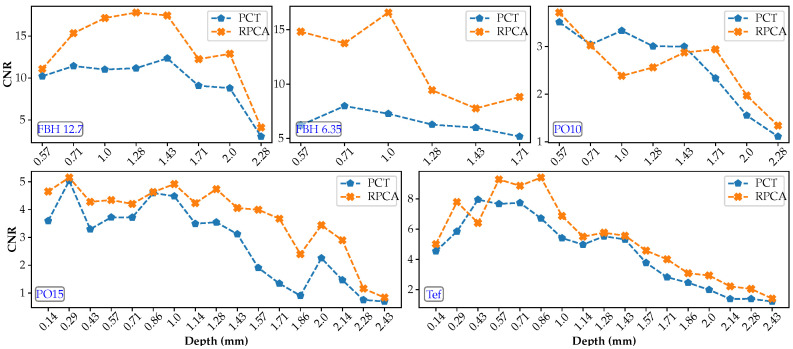
Pulsed Thermography (PT) data are usually affected by noise and as such most of the research effort in the last few years has been directed towards the development of advanced signal processing methods to improve defect detection. Among the numerous techniques that have been proposed, principal component thermography (PCT)-based on principal component analysis (PCA)-is one of the most effective in terms of defect contrast enhancement and data compression. However, it is well-known that PCA can be significantly affected in the presence of corrupted data (e.g., noise and outliers). Robust PCA (RPCA) has been recently proposed as an alternative statistical method that handles noisy data more properly by decomposing the input data into a low-rank matrix and a sparse matrix. We propose to process PT data by RPCA instead of PCA in order to improve defect detectability. The performance of the resulting approach, Robust Principal Component Thermography (RPCT)-based on RPCA, was evaluated with respect to PCT-based on PCA, using a CFRP sample containing artificially produced defects. We compared results quantitatively based on two metrics, Contrast-to-Noise Ratio (CNR), for defect detection capabilities, and the Jaccard similarity coefficient, for defect segmentation potential. CNR results were on average 40% higher for RPCT than for PCT, and the Jaccard index was slightly higher for RPCT (0.7395) than for PCT (0.7010). In terms of computational time, however, PCT was 11.5 times faster than RPCT. Further investigations are needed to assess RPCT performance on a wider range of materials and to optimize computational time.
Keywords: CFRP; OIALM; Orthogonal IALM; PCP; RPCA; Robust PCA; noise reduction; pulsed thermography.
Conflict of interest statement
The funders had no role in the design of the study; in the collection, analyses, or interpretation of data; in the writing of the manuscript, or in the decision to publish the results.
Figures


References
-
- Vavilov V., Maldague X. Optimization of heating protocol in thermal NDT, short and long heating pulses: A discussion. Res. Nondestruct. Eval. 1994;6:1–18. doi: 10.1080/09349849409409677. - DOI
-
- Hotelling H. Analysis of a complex of statistical variables into principal components. J. Educ. Psychol. 1933;24:417. doi: 10.1037/h0071325. - DOI
-
- Pearson K. LIII. On lines and planes of closest fit to systems of points in space. Lond. Edinb. Dublin Philos. Mag. J. Sci. 1901;2:559–572. doi: 10.1080/14786440109462720. - DOI
-
- Rajic N. Principal component thermography for flaw contrast enhancement and flaw depth characterisation in composite structures. Compos. Struct. 2002;58:521–528. doi: 10.1016/S0263-8223(02)00161-7. - DOI
-
- Candès E.J., Li X., Ma Y., Wright J. Robust Principal Component Analysis? J. ACM. 2011;58 doi: 10.1145/1970392.1970395. - DOI
Grants and funding
LinkOut - more resources
Full Text Sources
Other Literature Sources
