

Analytical Techniques for Structural Characterization of Proteins in Solid Pharmaceutical Forms: An Overview
- PMID: 33920461
- PMCID: PMC8070348
- DOI: 10.3390/pharmaceutics13040534
Analytical Techniques for Structural Characterization of Proteins in Solid Pharmaceutical Forms: An Overview
Abstract
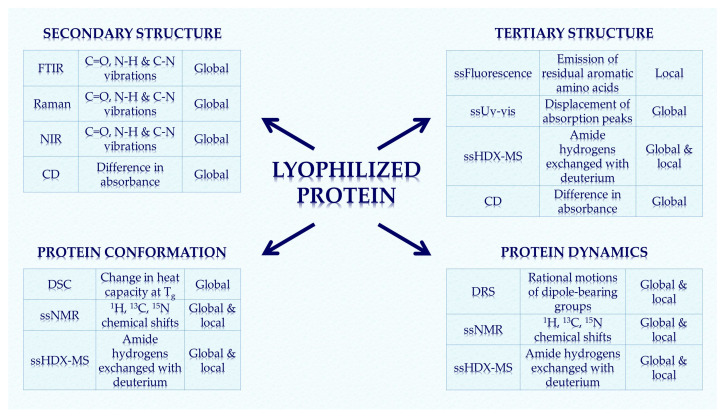
Therapeutic proteins as biopharmaceuticals have emerged as a very important class of drugs for the treatment of many diseases. However, they are less stable compared to conventional pharmaceuticals. Their long-term stability in solid forms, which is critical for product performance, depends heavily on the retention of the native protein structure during the lyophilization (freeze-drying) process and, thereafter, in the solid state. Indeed, the biological function of proteins is directly related to the tertiary and secondary structure. Besides physical stability and biological activity, conformational stability (three-dimensional structure) is another important aspect when dealing with protein pharmaceuticals. Moreover, denaturation as loss of higher order structure is often a precursor to aggregation or chemical instability. Careful study of the physical and chemical properties of proteins in the dried state is therefore critical during biopharmaceutical drug development to deliver a final drug product with built-in quality that is safe, high-quality, efficient, and affordable for patients. This review provides an overview of common analytical techniques suitable for characterizing pharmaceutical protein powders, providing structural, and conformational information, as well as insights into dynamics. Such information can be very useful in formulation development, where selecting the best formulation for the drug can be quite a challenge.
Keywords: analytical tools; antibody; excipients; formulation development; lyophilization; protein characterization; protein structure; safe drug; solid pharmaceuticals; stable drug product.
Conflict of interest statement
The authors declare no conflict of interest.
Figures

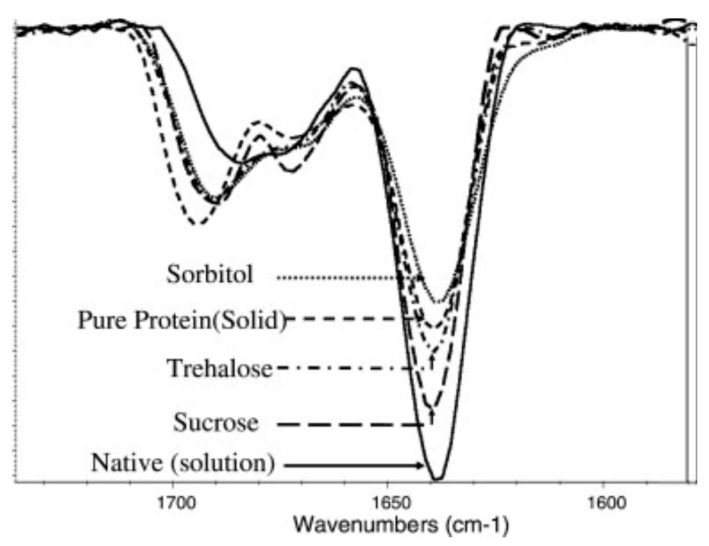


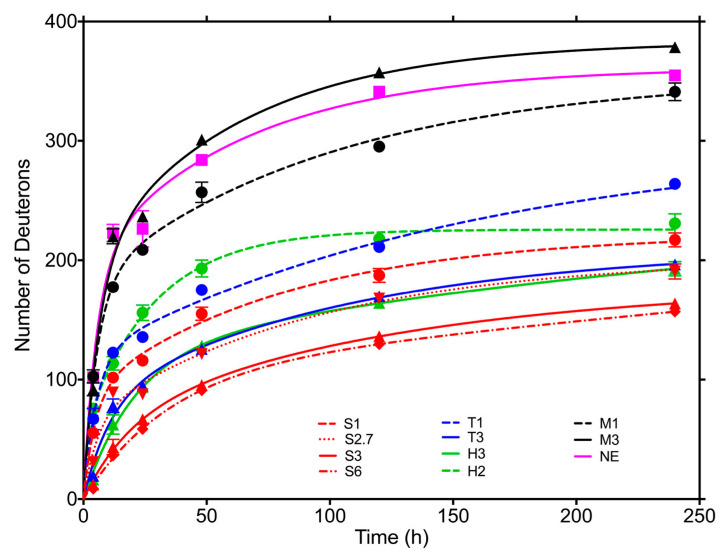
 —trehalose;
  —80% trehalose, 20% lysozyme; □—20% trehalose, 80% lysozyme;
  —lysozyme. Reproduced with permission from [116], Elsevier, 2002.


Similar articles
-
Instability of therapeutic proteins - An overview of stresses, stabilization mechanisms and analytical techniques involved in lyophilized proteins.Int J Biol Macromol. 2021 Jan 15;167:309-325. doi: 10.1016/j.ijbiomac.2020.11.188. Epub 2020 Dec 1. Int J Biol Macromol. 2021. PMID: 33275971 Review.
-
Recent progress in drying technologies for improving the stability and delivery efficiency of biopharmaceuticals.J Pharm Investig. 2023;53(1):35-57. doi: 10.1007/s40005-022-00610-x. Epub 2022 Dec 21. J Pharm Investig. 2023. PMID: 36568503 Free PMC article. Review.
-
Lyophilization and development of solid protein pharmaceuticals.Int J Pharm. 2000 Aug 10;203(1-2):1-60. doi: 10.1016/s0378-5173(00)00423-3. Int J Pharm. 2000. PMID: 10967427 Review.
-
Development of stable lyophilized protein drug products.Curr Pharm Biotechnol. 2012 Mar;13(3):471-96. doi: 10.2174/138920112799361990. Curr Pharm Biotechnol. 2012. PMID: 22283723 Review.
-
Fundamentals of freeze-drying.Pharm Biotechnol. 2002;14:281-360. doi: 10.1007/978-1-4615-0549-5_6. Pharm Biotechnol. 2002. PMID: 12189727 Review.
Cited by
-
Protein Function Analysis through Machine Learning.Biomolecules. 2022 Sep 6;12(9):1246. doi: 10.3390/biom12091246. Biomolecules. 2022. PMID: 36139085 Free PMC article. Review.
-
Enabling simultaneous photoluminescence spectroscopy and X-ray footprinting mass spectrometry to study protein conformation and interactions.Anal Methods. 2025 Feb 6;17(6):1214-1225. doi: 10.1039/d4ay01670j. Anal Methods. 2025. PMID: 39749913
-
Impact of process stress on protein stability in highly-loaded solid protein/PEG formulations from small-scale melt extrusion.Int J Pharm X. 2022 Dec 30;5:100154. doi: 10.1016/j.ijpx.2022.100154. eCollection 2023 Dec. Int J Pharm X. 2022. PMID: 36632069 Free PMC article.
-
Proteomic Characterization of Human Placenta: Insights into Potential Therapeutic Applications for Osteoarthritis.AAPS PharmSciTech. 2024 Jun 18;25(6):139. doi: 10.1208/s12249-024-02851-5. AAPS PharmSciTech. 2024. PMID: 38890179
-
Evaluating larvicidal, ovicidal and growth inhibiting activity of five medicinal plant extracts on Culex pipiens (Diptera: Culicidae), the West Nile virus vector.Sci Rep. 2024 Aug 23;14(1):19660. doi: 10.1038/s41598-024-69449-6. Sci Rep. 2024. PMID: 39191818 Free PMC article.
References
-
- Prestrelski S.J., Pikal K.A., Arakawa T. Optimization of Lyophilization Conditions for Recombinant Human Interleukin-2 by Dried-State Conformational Analysis Using Fourier-Transform Infrared Spectroscopy. Pharm. Res. Off. J. Am. Assoc. Pharm. Sci. 1995;12:1250–1259. doi: 10.1023/A:1016296801447. - DOI - PubMed
Publication types
Grants and funding
LinkOut - more resources
Full Text Sources
Other Literature Sources
