. 2021 Apr 11;10(4):459.
doi: 10.3390/pathogens10040459.

The Major Constituent of Green Tea, Epigallocatechin-3-Gallate (EGCG), Inhibits the Growth of HPV18-Infected Keratinocytes by Stimulating Proteasomal Turnover of the E6 and E7 Oncoproteins

Affiliations

The Major Constituent of Green Tea, Epigallocatechin-3-Gallate (EGCG), Inhibits the Growth of HPV18-Infected Keratinocytes by Stimulating Proteasomal Turnover of the E6 and E7 Oncoproteins

Jason K W Yap et al. Pathogens. .

Abstract

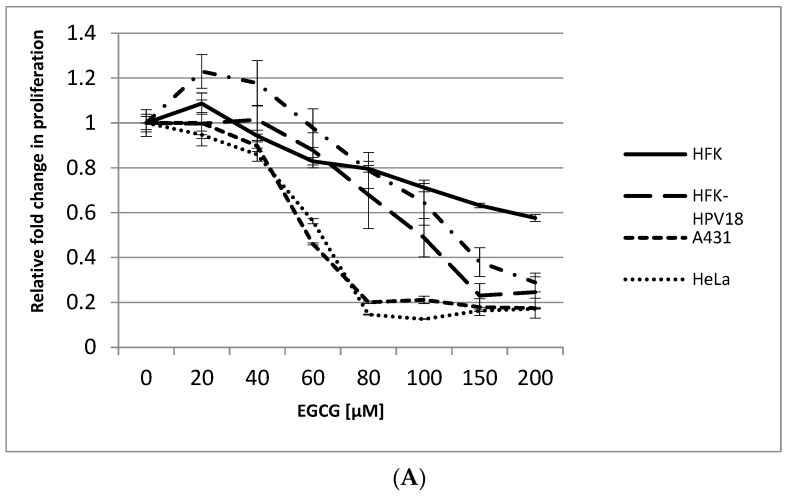
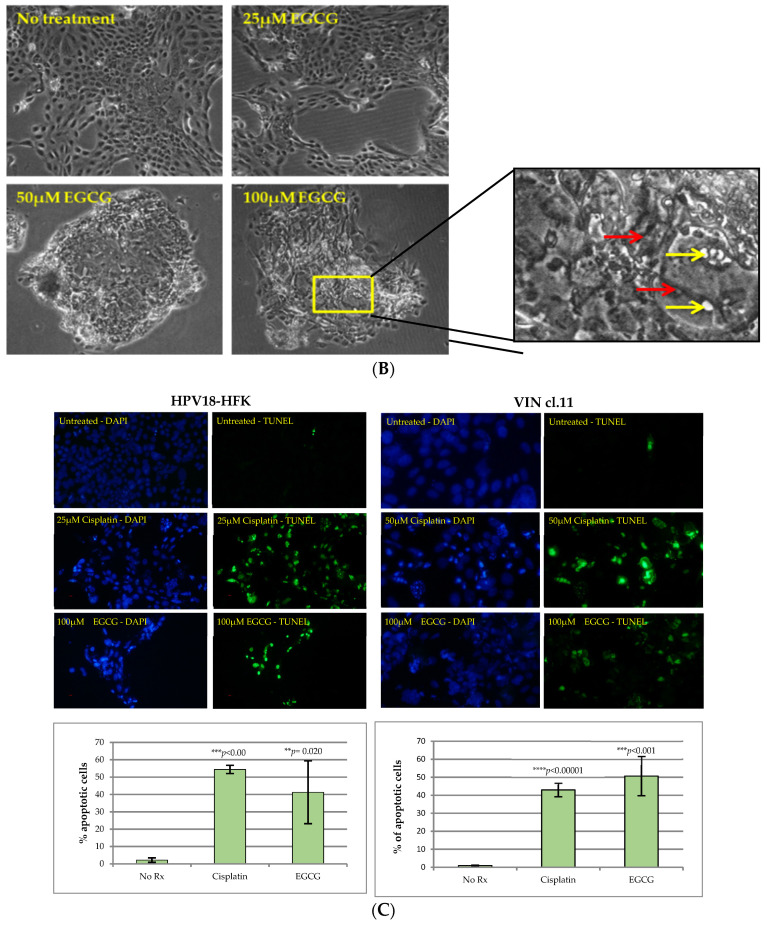
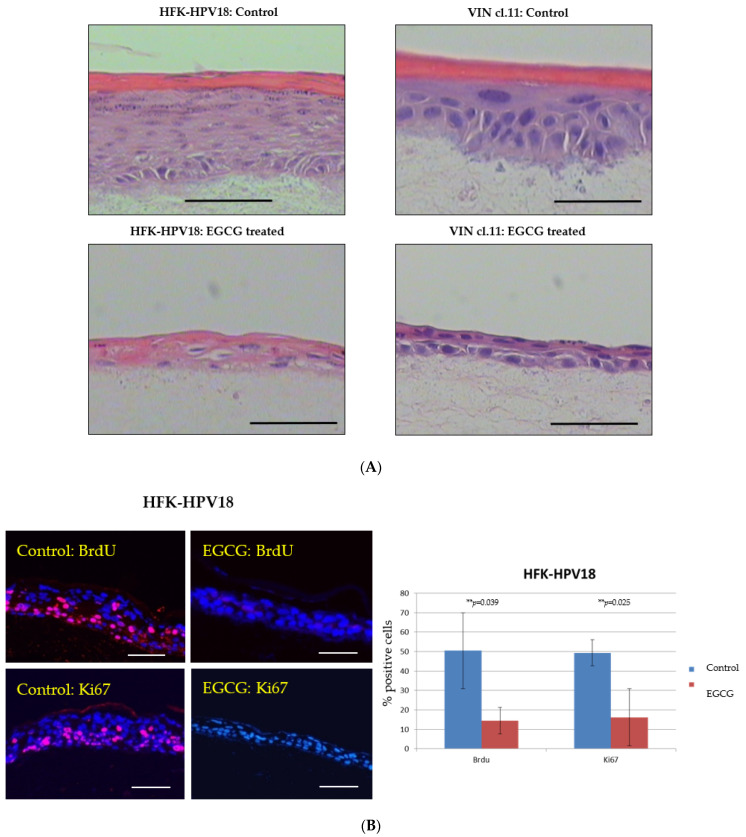
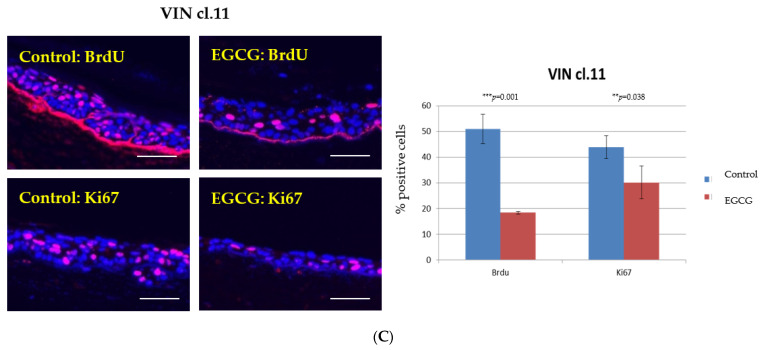
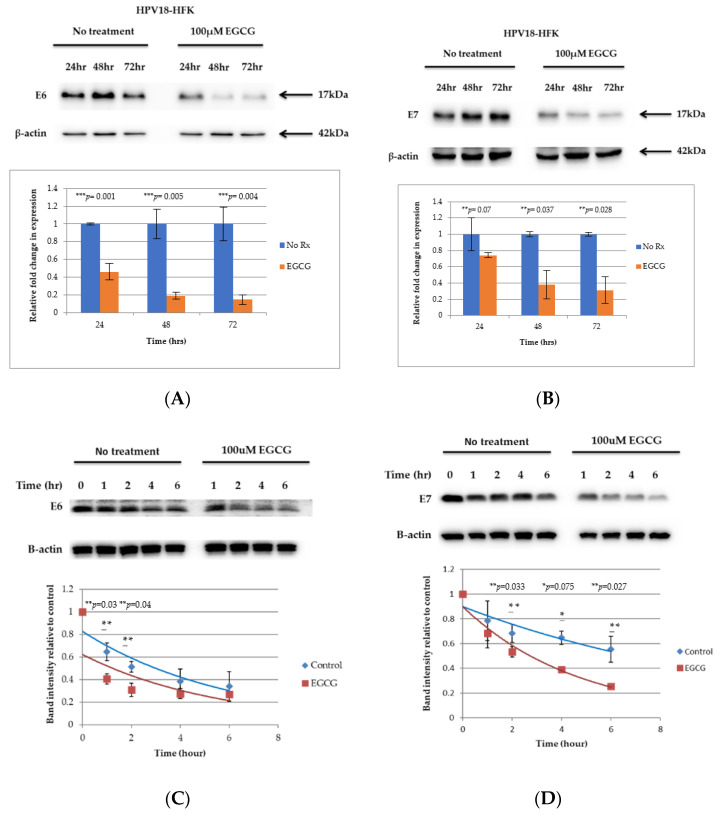
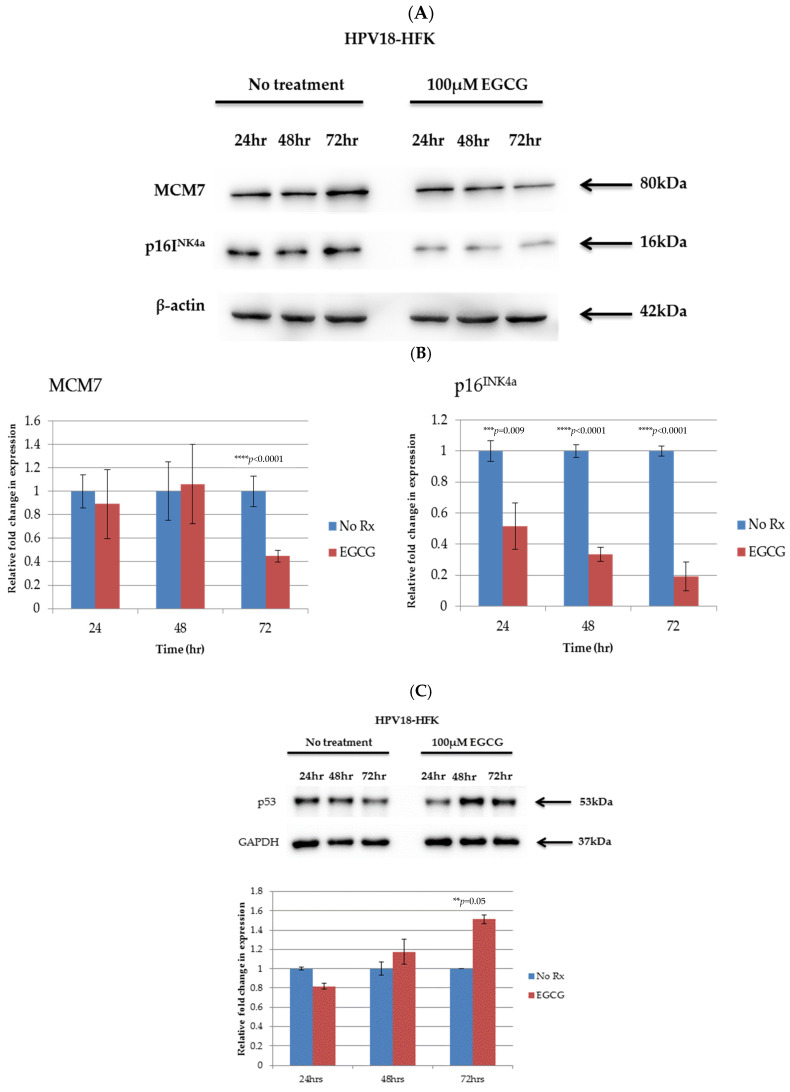
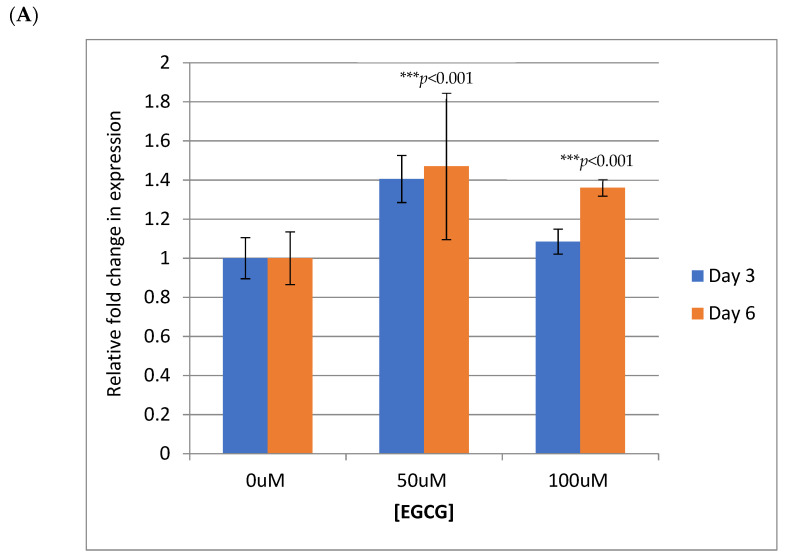
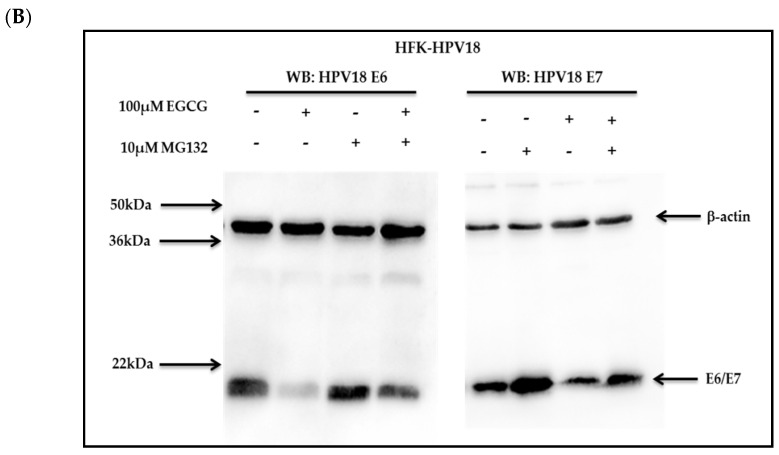
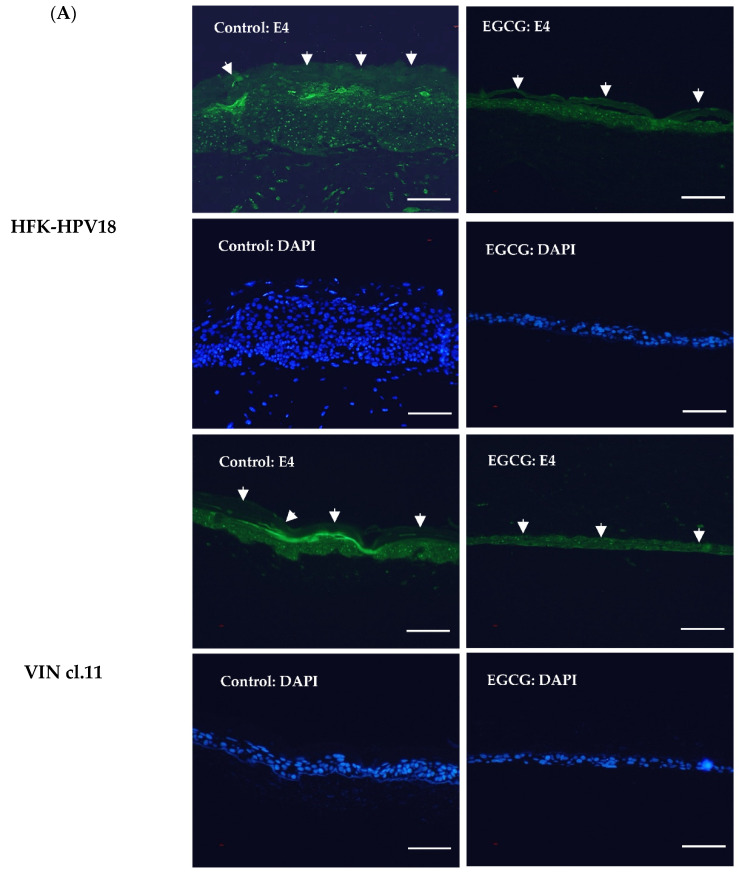
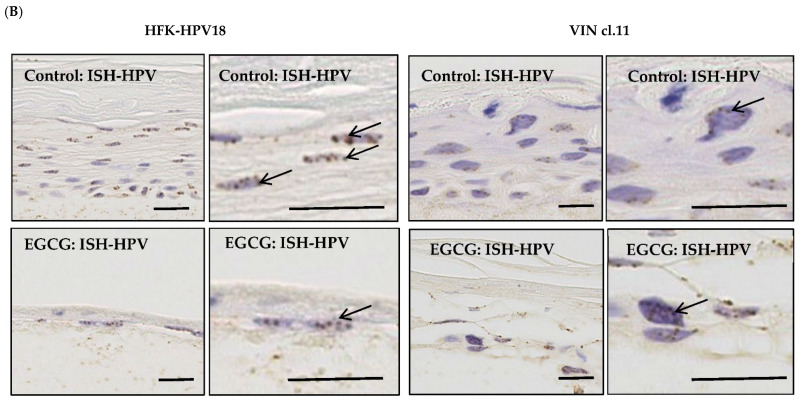
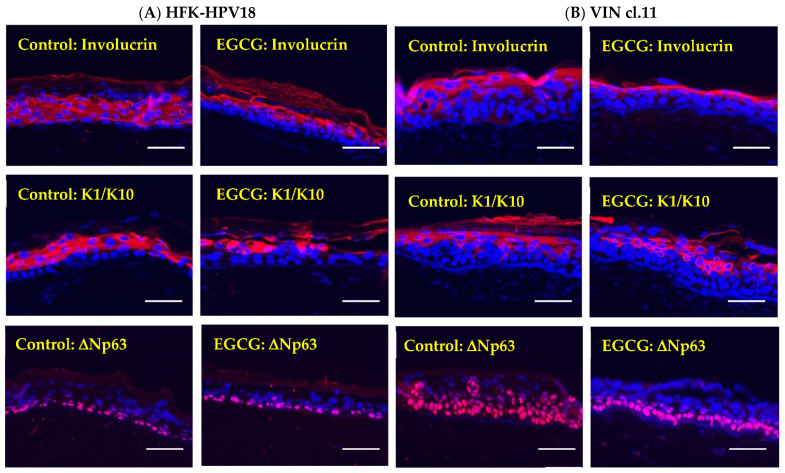
Epigallocatechin-3-gallate (EGCG), the primary bioactive polyphenol in green tea, has been shown to inhibit the growth of human papilloma virus (HPV)-transformed keratinocytes. Here, we set out to examine the consequences of EGCG treatment on the growth of HPV18-immortalised foreskin keratinocytes (HFK-HPV18) and an authentic HPV18-positive vulvar intraepithelial neoplasia (VIN) clone, focusing on its ability to influence cell proliferation and differentiation and to impact on viral oncogene expression and virus replication. EGCG treatment was associated with degradation of the E6 and E7 oncoproteins and an upregulation of their associated tumour suppressor genes; consequently, keratinocyte proliferation was inhibited in both monolayer and organotypic raft culture. While EGCG exerted a profound effect on cell proliferation, it had little impact on keratinocyte differentiation. Expression of the late viral protein E4 was suppressed in the presence of EGCG, suggesting that EGCG was able to block productive viral replication in differentiating keratinocytes. Although EGCG did not alter the levels of E6 and E7 mRNA, it enhanced the turnover of the E6 and E7 proteins. The addition of MG132, a proteasome inhibitor, to EGCG-treated keratinocytes led to the accumulation of the E6/E7 proteins, showing that EGCG acts as an anti-viral, targeting the E6 and E7 proteins for proteasome-mediated degradation.

Keywords: epigallocatechin-3-gallate; human papilloma virus; vulval intraepithelial neoplasia.


Conflict of interest statement

The authors declare no conflict of interest.

Figures

Figure 1
Figure 1
Characterisation of human papilloma virus (HPV)18-positive usual vulvar intraepithelial neoplasia (uVIN)-derived clone—VIN cl.11. (A) A representative karyotype from one of three major clones identified in primary cultures of the VIN cl.11. Chromosome alignment of G-banded chromosomes taken from one major clone found in early-passage cultures of VIN cl.11. This analysis confirmed the near-tetraploid nature of chromosomes and the absence of a Y chromosome. (B) Hematoxylin and eosin (H&E)-stained sections from organotypic raft cultures grown at the air–liquid interface for 14 days. Both VIN cl. 11 and HFK-HPV18 rafts displayed evidence of parakeratosis, but VIN cl.11 appeared less organized, with areas of immature and large nucleated cells extending to the granular layer, a feature suggestive of dysplastic changes that resembles uVIN. Scale = 10 μm.
Figure 2
Figure 2
Epigallocathecin-3-gallate (EGCG) inhibits cell proliferation and induces apoptosis in HFK-HPV18 and VIN cl.11. (A). Normal human foreskin keratinocytes (HFK), HPV18-positive keratinocytes (HFK-HPV18, VIN cl.11) and cancer cell lines (A431, HeLa) were treated with increasing concentrations of EGCG, and proliferation was measured 72 h later using the BrdU ELISA assay kit (Roche). The fold change in proliferation of EGCG-treated cells was measured against untreated cells (control). Cell proliferation decreased as the concentration of EGCG increased. Data shown are the average of three independent experiments. (B). HFK-HPV18 cells were cultured in in the presence of 25, 50 and 100 μM EGCG for 72 h, and cell morphology was captured by phase microscopy Magnification ×200. Inset: high-power close-up of intracellular vacuoles in cells treated with 100 μM EGCG. EGCG treated cells assumed a spindle-like appearance (red arrows) with intracellular vacuole (yellow arrows) at 100µM. Magnification ×400. (C). HFK-HPV18 and VIN cl.11 cells were cultured in the presence of 100 μM EGCG for 72 h or 25 μM cisplatin for 24 h; the latter was used as a positive control to induce apoptosis. TUNEL assay was used to label apoptotic cell (Green), and cell nuclei were counterstained with DAPI (blue). No Rx = non treated. Magnification ×200. TUNEL-positive cells were expressed as a percentage of total cell nuclei. Unpaired Student t-test was used to determine the level of significance for the difference in the proportion of apoptotic cells in drug-treated and untreated cells (n = 3) (** p-value <0.05, *** p-value 0.001, **** p-value 0.0001).
Figure 2
Figure 2
Epigallocathecin-3-gallate (EGCG) inhibits cell proliferation and induces apoptosis in HFK-HPV18 and VIN cl.11. (A). Normal human foreskin keratinocytes (HFK), HPV18-positive keratinocytes (HFK-HPV18, VIN cl.11) and cancer cell lines (A431, HeLa) were treated with increasing concentrations of EGCG, and proliferation was measured 72 h later using the BrdU ELISA assay kit (Roche). The fold change in proliferation of EGCG-treated cells was measured against untreated cells (control). Cell proliferation decreased as the concentration of EGCG increased. Data shown are the average of three independent experiments. (B). HFK-HPV18 cells were cultured in in the presence of 25, 50 and 100 μM EGCG for 72 h, and cell morphology was captured by phase microscopy Magnification ×200. Inset: high-power close-up of intracellular vacuoles in cells treated with 100 μM EGCG. EGCG treated cells assumed a spindle-like appearance (red arrows) with intracellular vacuole (yellow arrows) at 100µM. Magnification ×400. (C). HFK-HPV18 and VIN cl.11 cells were cultured in the presence of 100 μM EGCG for 72 h or 25 μM cisplatin for 24 h; the latter was used as a positive control to induce apoptosis. TUNEL assay was used to label apoptotic cell (Green), and cell nuclei were counterstained with DAPI (blue). No Rx = non treated. Magnification ×200. TUNEL-positive cells were expressed as a percentage of total cell nuclei. Unpaired Student t-test was used to determine the level of significance for the difference in the proportion of apoptotic cells in drug-treated and untreated cells (n = 3) (** p-value <0.05, *** p-value 0.001, **** p-value 0.0001).
Figure 3
Figure 3
EGCG inhibits the proliferation of HFK-HPV18 and VIN cl.11 in organotypic raft culture. (A) EGCG inhibits the proliferation of HFK-HPV18 (top) and VIN cl.11 (bottom) in organotypic raft culture. Raft cultures were allowed to stratify for 7 days before 100 μM EGCG was added to the growth media for an additional 7 days prior to fixation and processing for histology and histocytochemical staining. H&E-stained sections of formalin-fixed paraffin embedded (FFPE) samples showing the overall morphology of HFK-HPV18 and VIN cl.11 cells grown in organotypic raft culture. Rafts cultures treated with 100 μM EGCG were significantly thinner compared to control (untreated) raft cultures. Scale = 5 μm. (B) Immunofluorescence staining for anti-BrdU label or Ki67 (Pink) and with DAPI counterstaining (Blue) to identify cell nuclei in (B) HFK-HPV18 and (C) VIN cl.11 raft sections (Right panels). Scale = 5 μm. Summary of the results obtained for cells incorporating BrdU label or staining positive for Ki67 in control and EGCG-treated raft cultures. The total number of cell nuclei (DAPI-stained) and those nuclei labelled with BrdU or Ki67 were counted manually. Results are presented as the proportion of cells stained positive for the appropriate proliferative markers. ** p < 0.05, *** p < 0.001, two-tailed Student unpaired t-test indicates that the difference in BrdU or Ki67 expression is significant when compared to control (n = 3).
Figure 3
Figure 3
EGCG inhibits the proliferation of HFK-HPV18 and VIN cl.11 in organotypic raft culture. (A) EGCG inhibits the proliferation of HFK-HPV18 (top) and VIN cl.11 (bottom) in organotypic raft culture. Raft cultures were allowed to stratify for 7 days before 100 μM EGCG was added to the growth media for an additional 7 days prior to fixation and processing for histology and histocytochemical staining. H&E-stained sections of formalin-fixed paraffin embedded (FFPE) samples showing the overall morphology of HFK-HPV18 and VIN cl.11 cells grown in organotypic raft culture. Rafts cultures treated with 100 μM EGCG were significantly thinner compared to control (untreated) raft cultures. Scale = 5 μm. (B) Immunofluorescence staining for anti-BrdU label or Ki67 (Pink) and with DAPI counterstaining (Blue) to identify cell nuclei in (B) HFK-HPV18 and (C) VIN cl.11 raft sections (Right panels). Scale = 5 μm. Summary of the results obtained for cells incorporating BrdU label or staining positive for Ki67 in control and EGCG-treated raft cultures. The total number of cell nuclei (DAPI-stained) and those nuclei labelled with BrdU or Ki67 were counted manually. Results are presented as the proportion of cells stained positive for the appropriate proliferative markers. ** p < 0.05, *** p < 0.001, two-tailed Student unpaired t-test indicates that the difference in BrdU or Ki67 expression is significant when compared to control (n = 3).
Figure 4
Figure 4
EGCG downregulates E6 and E7 in HFK-HPV18 keratinocytes by enhancing their turnover. (A,B) HFK-HPV18 cells were treated with 100 μM EGCG for 24, 48 and 72 h, and 30 μg of total protein lysate was resolved by SDS-PAGE. The levels of (A) E6 and (B) E7 were then determined by Western immunoblotting analysis. Densitometric analysis of representative Western blots for E6 and E7 were normalised against β-actin and are shown in graphical form. Fold change in protein expression was compared to that of untreated cells (control). Unpaired Student t-test confirmed that the difference in protein expression was significant between control and EGCG treated cells (** p-values 0.01–0.009; *** p-values 0.001–0.005) (n = 3). HFK-HPV18 cells were treated with and without 100 μM EGCG in the presence of 100 μg/mL cycloheximide (CHX) to inhibit protein synthesis. Cells were harvested at 0, 1, 2, 4 and 6 h post CHX treatment, 30 μg of total protein lysate was resolved by SDS-PAGE and expression of either (C) HPV18 E6 or (D) HPV18 E7 and β-actin was determined by Western blotting analysis. Densitometric analysis of the Western blots. E6 and E7 densitometry values were normalised against β-actin. The fold change in E6 and E7 expression was compared against that of untreated cells (control). Unpaired Student t-test indicates that the difference in band intensity was significant between control and EGCG treated cells (** p-values of <0.05, * p-value of <0.1) (n = 3).
Figure 5
Figure 5
Downregulation of HPV-18 E6 and E7 and altered expression of E6- and E7-associated targets (MCM7, p16INK4a, DNMT1/3 and p53) in HFK-HPV18 keratinocytes. HFK-HPV18 cells were treated with 100 μM EGCG for 24, 48 and 72 h, and 30 μg of total protein lysate was resolved by SDS-PAGE. (A) The levels of MCM7 and p16INK4a proteins were then determined by Western immunoblotting analysis. (B) Densitometric analysis of representative Western blots for E6, E7, MCM7 and p16INK4a were normalised against β-actin and shown in graphical form. Fold change in protein expression was compared to that of untreated cells (control). ** p < 0.05. Unpaired Student t-test was used to determine if the difference in protein expression was significant when compared to control (n = 3). No Rx = No treatment (C) HFK-HPV18 cells were treated with 100 μM EGCG for 24, 48 and 72 h, and the levels of p53 were determined by Western blotting analysis. Densitometry analysis of the blots (lower panel). p53 densitometry values were normalised against GAPDH. The fold change in p53 expression was compared against untreated cells (No Rx). Student unpaired t-test indicated that the difference in p53 expression was significant between control and EGCG treated cells (** p-value 0.05; *** p-value 0.001–0.005; **** p-value 0.0001) (n = 3).
Figure 6
Figure 6
EGCG does not affect E6/E7 transcription but promotes degradation of the E6 and E7 proteins by enhancing their turnover through the proteasome. (A) HFK-HPV18 cells were treated with 50 μM or 100 μM EGCG for 3 and 6 days. RNA was isolated, andqPCR performed to quantify the relative fold change in E6/E7 transcripts pre- and postEGCG treatment. Expression levels were normalised to levels of endogenous β2-microglobulin in the samples. Data were analysed using the relative 2ΔΔCT method using 7500 SDS software (n = 3). *** denotes a p-value of <0.001 by Student unpaired t-test. (B). HFK-HPV18 cells were treated with 10 μM MG132 for 6 h, 100 μM EGCG for 72 h or 100 μM EGCG for 72 h followed by 10 μM MG132 for 6 h. Cells were lysed in RIPA buffer, and 30 μg of total protein lysate was resolved by SDS-PAGE. The levels of HPV18 E6, E7 and β-actin were determined by Western immunoblotting analysis (n = 3).
Figure 6
Figure 6
EGCG does not affect E6/E7 transcription but promotes degradation of the E6 and E7 proteins by enhancing their turnover through the proteasome. (A) HFK-HPV18 cells were treated with 50 μM or 100 μM EGCG for 3 and 6 days. RNA was isolated, andqPCR performed to quantify the relative fold change in E6/E7 transcripts pre- and postEGCG treatment. Expression levels were normalised to levels of endogenous β2-microglobulin in the samples. Data were analysed using the relative 2ΔΔCT method using 7500 SDS software (n = 3). *** denotes a p-value of <0.001 by Student unpaired t-test. (B). HFK-HPV18 cells were treated with 10 μM MG132 for 6 h, 100 μM EGCG for 72 h or 100 μM EGCG for 72 h followed by 10 μM MG132 for 6 h. Cells were lysed in RIPA buffer, and 30 μg of total protein lysate was resolved by SDS-PAGE. The levels of HPV18 E6, E7 and β-actin were determined by Western immunoblotting analysis (n = 3).
Figure 7
Figure 7
EGCG treatment inhibits the expression of the replication-associated protein E4 but does not influence HPV genome copy number in raft cultures. (A) FFPE sections of control and EGCG-treated HFK-HPV18 and VIN cl.11 rafts were subjected to immunocytochemical staining with an antiserum specific for HPV18 E4 (Green) and counterstained with DAPI (Blue) to label cell nuclei. Positive staining for the E4 protein in suprabasal keratinocyte layers of rafts generated from HFK-HPV18 and VIN cl.11 keratinocytes, but a lack of staining in rafts treated with EGCG (n = 3). Thick white arrows denote the outermost differentiated layers in HFK-HPV18 and VIN cl.11. Scale = 5 μm. (B) The same sections were subjected to in situ hybridisation (ISH) using an HPV-specific DNA probe. Specific binding of the HPV-specific DNA probe (denoted by black arrows) was observed in the nuclei of both HPV18-infected cell lines. EGCG treatment did not alter the intensity of staining of the HPV DNA probe (n = 3). Scale = 5 μm.
Figure 7
Figure 7
EGCG treatment inhibits the expression of the replication-associated protein E4 but does not influence HPV genome copy number in raft cultures. (A) FFPE sections of control and EGCG-treated HFK-HPV18 and VIN cl.11 rafts were subjected to immunocytochemical staining with an antiserum specific for HPV18 E4 (Green) and counterstained with DAPI (Blue) to label cell nuclei. Positive staining for the E4 protein in suprabasal keratinocyte layers of rafts generated from HFK-HPV18 and VIN cl.11 keratinocytes, but a lack of staining in rafts treated with EGCG (n = 3). Thick white arrows denote the outermost differentiated layers in HFK-HPV18 and VIN cl.11. Scale = 5 μm. (B) The same sections were subjected to in situ hybridisation (ISH) using an HPV-specific DNA probe. Specific binding of the HPV-specific DNA probe (denoted by black arrows) was observed in the nuclei of both HPV18-infected cell lines. EGCG treatment did not alter the intensity of staining of the HPV DNA probe (n = 3). Scale = 5 μm.
Figure 8
Figure 8
EGCG treatment is not associated with significant changes in the expression of keratinocyte differentiation proteins in HFK-HPV18 and VIN cl.11 rafts. FFPE sections of (A) HFK-HPV18 and (B) VIN cl.11 rafts were stained with antisera specific for involucrin, K1/10 and ΔNp63 (Pink) and counterstained with DAPI (Blue) to label cell nuclei. Similar patterns of expression of involucrin and K1/10 were observed in control and EGCG-treated rafts. However, while there was no change in the expression and localisation of ΔNp63 in control and EGCG-treated HFK-HPV18 rafts, ΔNp63 staining became “re-polarised” to the basal layer in EGCG-treated VIN cl.11 raft cultures compared to control untreated rafts (n = 3). Scale = 5 μm.

References

    1. De Vuyst H., Clifford G.M., Nascimento M.C., Madeleine M.M., Franceschi S. Prevalence and type distribution of human papillomavirus in carcinoma and intraepithelial neoplasia of the vulva, vagina and anus: A meta-analysis. Int. J. Cancer. 2009;124:1626–1636. doi: 10.1002/ijc.24116. - DOI - PubMed
    1. Hillemanns P., Wang X. Integration of HPV-16 and HPV-18 DNA in vulvar intraepithelial neoplasia. Gynecol. Oncol. 2006;100:276–282. doi: 10.1016/j.ygyno.2005.10.003. - DOI - PubMed
    1. Judson P.L., Habermann E.B., Baxter N.N., Durham S.B., Virnig B.A. Trends in the incidence of invasive and in situ vulvar carcinoma. Obstet. Gynecol. 2006;107:1018–1022. doi: 10.1097/01.AOG.0000210268.57527.a1. - DOI - PubMed
    1. Baandrup L., Varbo A., Munk C., Johansen C., Frisch M., Kjaer S.K. In situ and invasive squamous cell carcinoma of the vulva in Denmark 1978–2007—A nationwide population-based study. Gynecol. Oncol. 2011;122:45–49. doi: 10.1016/j.ygyno.2011.03.016. - DOI - PubMed
    1. Van Seters M., van Beurden M., de Craen A.J. Is the assumed natural history of vulvar intraepithelial neoplasia III based on enough evidence? A systematic review of 3322 published patients. Gynecol. Oncol. 2005;97:645–651. doi: 10.1016/j.ygyno.2005.02.012. - DOI - PubMed

LinkOut - more resources