. 2021 Apr 17;21(8):2844.
doi: 10.3390/s21082844.

Whispering Gallery Mode Resonators for Precision Temperature Metrology Applications

Affiliations

Whispering Gallery Mode Resonators for Precision Temperature Metrology Applications

Giovanni Gugliandolo et al. Sensors (Basel). .

Abstract

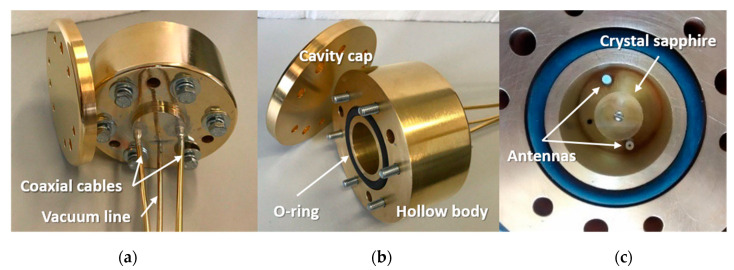
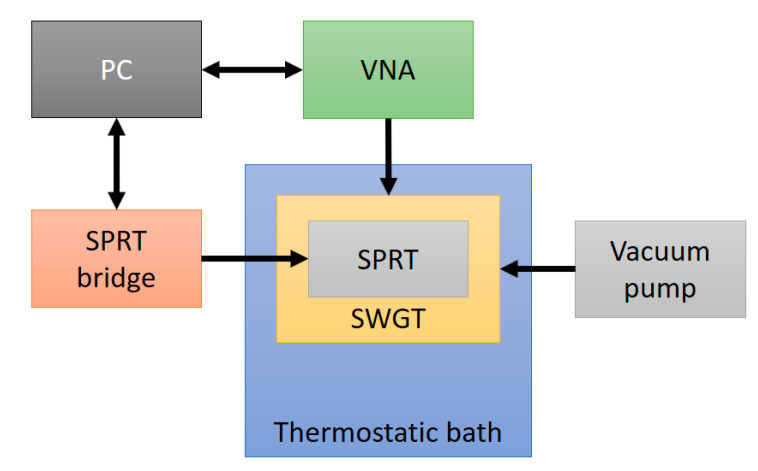
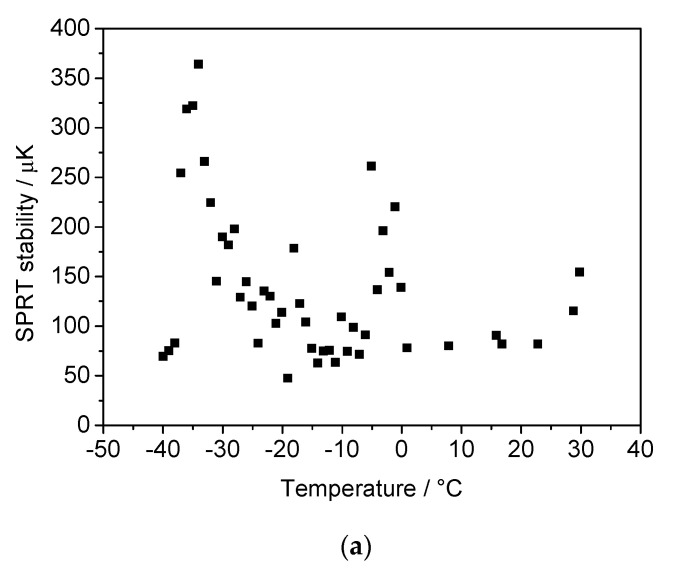
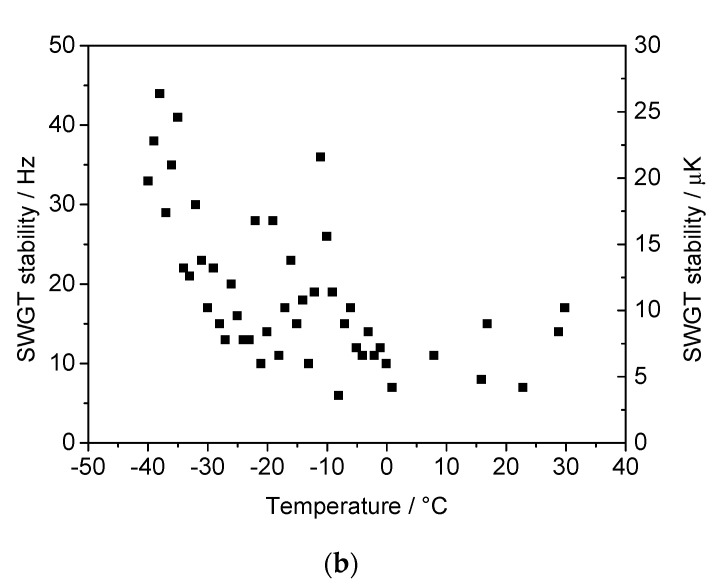
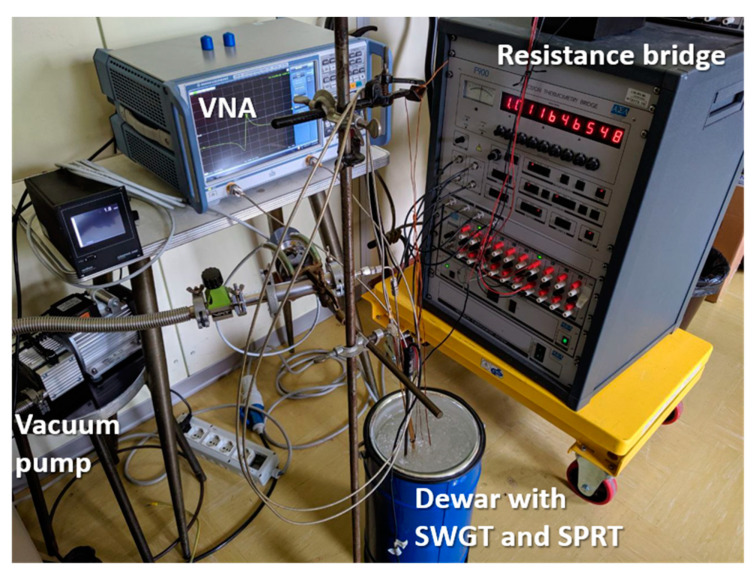
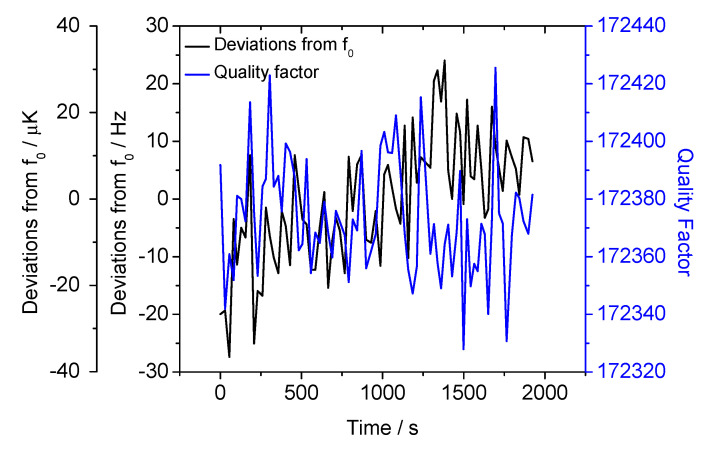
In this work, the authors exploited the whispering gallery mode (WGM) resonator properties as a thermometer. The sensor is made of a cylindrical sapphire microwave resonator in the center of a gold-plated copper cavity. Two coaxial cables act as antennas and excite the WGM standing waves in the cylindrical sapphire at selected resonance frequencies in the microwave range. The system affords a high quality factor that enables temperature measurements with a resolution better than 15 µK and a measurement standard uncertainty of 1.2 mK, a value approximately three times better than that achieved in previous works. The developed sensor could be a promising alternative to platinum resistance thermometers, both as a transfer standard in industrial applications and as an interpolating instrument for the dissemination of the kelvin.

Keywords: metrology; microwave resonators; temperature measurements; thermometry; whispering gallery modes.


Conflict of interest statement

The authors declare no conflict of interest.

Figures

Figure 1
Figure 1
SWGT prototype fabricated. The three panels in the figure report different views of the device: (a) top part of the cavity with the two coaxial cables brazed and the vacuum line; (b) bottom part of the cavity without the cap, the sealing O-ring and six bolts are visible) and (c) 17.6-mm crystal sapphire placed inside the cavity (external diameter = 100 mm) with the exciting antennas.
Figure 2
Figure 2
Magnitude of the resonator transmission coefficient (S21) with different antennas length (l). Only the fitted Lorentzian function of the measured spectrum is reported here. The shorter are the antennas, the higher is the quality factor and the lower is the peak amplitude.
Figure 3
Figure 3
Quality factor and peak amplitude as a function of the antennas length (l). In the final design two 0.5-mm long antennas have been fabricated as a compromise between these two quantities.
Figure 4
Figure 4
Computer electromagnetic simulations: electric energy densities at resonance. In the frequency range from 6 to 14 GHz, five WGM resonances have been found: (a) WGMn=2; (b) WGMn=3; (c) WGMn=4; (d) WGMn=5 and (e) WGMn=6. The five panels report the expected electromagnetic field distribution at the WGM resonances.
Figure 5
Figure 5
Schematic of the measurement setup. The SWGT was hosted in a thermostatic bath and the microwave resonator was connected to the vacuum pump. The WGM resonant frequencies were detected by a VNA while a SWGT reference temperature was measured by a SPRT and a precision thermometry bridge. Both the VNA and the resistance bridge were controlled by a PC.
Figure 6
Figure 6
Lorentzian fitting of the frequency spectrum: real and imaginary part. The spectrum was acquired with a resolution of 2.5 kHz. In both cases the fitted functions are perfectly superimposed to the acquired data points.
Figure 7
Figure 7
Residuals of the Lorentzian fitting. The scatter is within ±2 × 10⁻⁵ of the S21 transmission coefficient scale; their probability distribution function is normal as a proof of a good mathematical modeling of the resonance.
Figure 8
Figure 8
Change of the resonator spectrum with temperature.
Figure 9
Figure 9
Measurements at five WGM resonances in the temperature range from −40 to 0 °C. (a) Frequency fractional change of the developed prototype as a function of the temperature. Small oscillations have been observed in WGMn=2 and WGMn=3 probably caused by issues in the temperature bath control system. (b) Q factor change with the temperature.
Figure 9
Figure 9
Measurements at five WGM resonances in the temperature range from −40 to 0 °C. (a) Frequency fractional change of the developed prototype as a function of the temperature. Small oscillations have been observed in WGMn=2 and WGMn=3 probably caused by issues in the temperature bath control system. (b) Q factor change with the temperature.
Figure 10
Figure 10
(a) Resonant frequency for WGMn=5 as a function of the temperature: a 5th order polynomial function (red line) was used to fit the experimental data points. (b) Calibration fit residuals: all the points are within ±0.6 mK.
Figure 10
Figure 10
(a) Resonant frequency for WGMn=5 as a function of the temperature: a 5th order polynomial function (red line) was used to fit the experimental data points. (b) Calibration fit residuals: all the points are within ±0.6 mK.
Figure 11
Figure 11
(a) Stability of the temperature calibration bath in terms of standard deviation at each temperature set point. (b) Stability of the resonant frequency in terms of standard deviation expressed in Hz and converted in temperature unit. The SWGT temperature measurement is more stable compared to the bath temperature because of the large copper cavity thermal mass, which was able to filter out the bath temperature fluctuations.
Figure 11
Figure 11
(a) Stability of the temperature calibration bath in terms of standard deviation at each temperature set point. (b) Stability of the resonant frequency in terms of standard deviation expressed in Hz and converted in temperature unit. The SWGT temperature measurement is more stable compared to the bath temperature because of the large copper cavity thermal mass, which was able to filter out the bath temperature fluctuations.
Figure 12
Figure 12
Measurement setup for the ice melting point stability test: SWGT inside the Dewar flask with the SPRT. They are connected to the VNA and the resistance bridge, respectively.
Figure 13
Figure 13
SWGT resonance frequency and Q factor deviations when the microwave resonator is placed inside a melting ice bath.
Figure 14
Figure 14
Comparison between the measurement stability of SWGT (black squares) and SPRT (red circles). In this plot the SPRT resistance deviations have been converted into equivalent frequency deviations. The SWGT measurement stability is about five times better than the SPRT.
Figure 15
Figure 15
Comparison between the measurement repeatability of SWGT (black squares) and SPRT (red circles). Additionally, in this case the SWGT performs better.

Similar articles

Cited by

References

    1. Hallil H., Menini P., Aubert H. New microwave gas detector using dielectric resonator based on a whispering-gallery-mode; Proceedings of the 2009 European Microwave Conference (EuMC); Rome, Italy. 28 September–2 October 2009; pp. 1097–1100. - DOI
    1. Lemieux-Leduc C., Guertin R., Bianki M., Peter Y. Gas Sensing with SU-8 Whispering Gallery Mode Resonators; Proceedings of the 2018 International Conference on Optical MEMS and Nanophotonics (OMN); Lausanne, Switzerland. 29 July–2 August 2018; pp. 1–2. - DOI
    1. Righini G., Soria S. Biosensing by WGM Microspherical Resonators. Sensors. 2016;16:905. doi: 10.3390/s16060905. - DOI - PMC - PubMed
    1. Reynolds T., Henderson M.R., François A., Riesen N., Hall J.M.M., Afshar S.V., Nicholls S.J., Monro T.M. Optimization of whispering gallery resonator design for biosensing applications. Opt. Express. 2015;23:17067–17076. doi: 10.1364/OE.23.017067. - DOI - PubMed
    1. Pongruengkiat W., Pechprasarn S. Whispering-Gallery Mode Resonators for Detecting Cancer. Sensors. 2017;17:2095. doi: 10.3390/s17092095. - DOI - PMC - PubMed

LinkOut - more resources