. 2021 Apr 15;10(4):772.
doi: 10.3390/plants10040772.

Olive Cultivars Susceptible or Tolerant to Xylella fastidiosa Subsp. pauca Exhibit Mid-Term Different Metabolomes upon Natural Infection or a Curative Treatment

Affiliations

Olive Cultivars Susceptible or Tolerant to Xylella fastidiosa Subsp. pauca Exhibit Mid-Term Different Metabolomes upon Natural Infection or a Curative Treatment

Chiara Roberta Girelli et al. Plants (Basel). .

Abstract

Xylella fastidiosa subsp. pauca, is a bacterial phytopathogen associated with the "olive quick decline syndrome" (OQDS) causing severe economic losses to olive groves in Salento area (Apulia, Italy). In a previous work, we analyzed by 1H-NMR the metabolic pattern of naturally infected Ogliarola salentina and Cellina di Nardò susceptible cultivars untreated and treated with a zinc-copper citric acid biocomplex and we observed the treatment related variation of the disease biomarker quinic acid. In this study, we focused also on the Leccino cultivar, known to exhibit tolerance to the disease progression. The 1H-NMR-based metabolomic approach was applied with the aim to characterize the overall metabolism of tolerant Leccino in comparison with the susceptible cultivars Ogliarola salentina and Cellina di Nardò under periodic mid-term treatment. In particular, we studied the leaf extract molecular patterns of naturally infected trees untreated and treated with the biocomplex. The metabolic Leccino profiles were analyzed for the first time and compared with those exhibited by the susceptible Cellina di Nardò and Ogliarola salentina cultivars. The study highlighted a specificity in the metabolic response of the tolerant Leccino compared to susceptible cultivars. These differences provide useful information to describe the defensive mechanisms underlying the change of metabolites as a response to the infection, and the occurrence of different levels of disease, season and treatment effects for olive cultivars.

Keywords: 1H-NMR spectroscopy; Xylella fastidiosa; metabolomics; susceptible cultivar; tolerant cultivar.


Conflict of interest statement

The authors declare no conflict of interest.

Figures

Figure 1
Figure 1
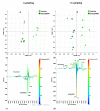
(a) Principal components analysis (PCA) t1/t2 scores plot for naturally infected Ogliarola salentina, Cellina di Nardò and Leccino leaf samples. Symbols were colored according to the sampling periods. (b) Line plot for the model, indicating the 1H-NMR chemical shifts of the signals, characteristic of specific metabolites, discriminating the classes along t[1] and colored according to the correlation-scaled loading p(corr).
Figure 2
Figure 2
Orthogonal partial least square–discriminant analysis (OPLS-DA) t[1]/t[2] scores plot for untreated (a) and treated (b) naturally infected Leccino, Cellina di Nardò and Ogliarola salentina leaf samples comparing the I and II sampling periods.
Figure 3
Figure 3
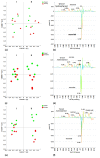
OPLS-DA t[1]/t[2] scores plot for infected Ogliarola salentina (triangle symbols) (a), Cellina di Nardò (circle symbols) (c) and Leccino (diamond symbols) (e), leaf samples related to I and II sampling periods. Red colored symbols indicated untreated sample. Green colored symbols indicated Dentamet®-treated samples. (bf) S-line plots for Ogliarola salentina (b), Cellina di Nardò (d) and Leccino (f) related models visualizing the p(ctr)[1] loading colored according to the absolute value of the correlation loading, p(corr)[1].
Figure 4
Figure 4
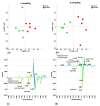
OPLS-DA t[1]/t[2] scores plot for infected control (red triangles) and Dentamet®-treated (green triangles) Ogliarola salentina leaf samples from I (a) and II (b) samplings. S-line plots for the I (c) and II (d) sampling related models visualizes the p(ctr)[1] loading colored according to the absolute value of the correlation loading, p(corr)[1].
Figure 5
Figure 5
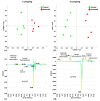
OPLS-DA t[1]/t[2] scores plot for infected control (red circles) and Dentamet®-treated (green circles) Cellina di Nardò leaf samples from I (a) and II (b) samplings. S-line plots for the I (c) and II (d) sampling related models visualizes the p(ctr)[1] loading colored according to the absolute value of the correlation loading, p(corr)[1].
Figure 6
Figure 6
OPLS-DA t[1]/t[2] scores plot for infected control (red diamonds) and Dentamet® treated (green diamonds) Leccino leaf samples from I (a) and II (b) samplings. S-line plots for the I (c) and II (d) sampling related models visualizes the p(ctr)[1] loading colored according to the absolute value of the correlation loading, p(corr)[1].
Figure 7
Figure 7
OPLS-DA t[1]/t[2] scores plot for Leccino and susceptible cultivar considering, infected control untreated leaf samples considering the first (a) and the second sampling (b). Different symbol style for Cellina di Nardò (circles) and Ogliarola salentina (triangles) susceptible cultivars are reported. S-line plots for the first (c) and the second sampling (d) related models visualizes the p(ctr)[1] loading colored according to the absolute value of the correlation loading, p(corr)[1]. Infected control trees.
Figure 8
Figure 8
OPLS-DA t[1]/t[2] scores plot for infected Dentamet®-treated Leccino and susceptible cultivar leaf samples, considering the first (a) and the second (b) sampling. Different symbol styles for Cellina di Nardò (circles) and Ogliarola salentina (triangles) susceptible cultivars are reported. S-line plots for the, infected Dentamet®-treated considering the first (c) and the second (d) sampling related models visualizes the p(ctr)[1] loading colored according to the absolute value of the correlation loading, p(corr)[1].
Figure 9
Figure 9
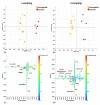
(a) OPLS-DA t[1]/t[2] scores plot for healthy Dentamet®-treated Leccino and susceptible cultivar leaf sample. Different symbol styles for Cellina di Nardò (circles) and Ogliarola salentina (triangles) susceptible cultivars are reported. (b) S-line plots for the model visualizing the p(ctr)[1] loading colored according to the absolute value of the correlation loading, p(corr)[1].
Figure 10
Figure 10
PCA t[1]/t[2] scores plot (three components gave R2X = 0.783 and Q2 = 0.631) for healthy and naturally infected Leccino, Cellina di Nardò and Ogliarola salentina leaf samples collected in the early springtime sampling. Healthy and naturally infected samples were collected in Grottaglie (Taranto province) and Galatone (Lecce Province), respectively. Different symbol styles for Leccino (diamonds), Cellina di Nardò (circles) and Ogliarola salentina (triangles) are reported.

References

    1. Sardaro R., Fucilli V., Acciani C. Measuring the value of rural landscape in support of preservation policies. Sci. Reg. 2015:125–138. doi: 10.3280/scre2015-002005. - DOI
    1. ISTAT. [(accessed on 25 September 2020)]; Available online: http://dati.istat.it/
    1. Martelli G.P. The current status of the quick decline syndrome of olive in southern Italy. Phytoparasitica. 2016;44:1–10. doi: 10.1007/s12600-015-0498-6. - DOI
    1. Cimato A., Sani G., De Rinaldis G., Calogiuri A. Recupero, Conservazione, Selezione e Caratterizzazione delle Varietà Autoctone. Camera di Commercio, Industria, Artigianato e Agricoltura; Lecce, Italy: 2001. Il germoplasma olivicolo in provincia di Lecce.
    1. Del Coco L., De Pascali S.A., Fanizzi F.P. NMR-metabolomic study on monocultivar and blend salento EVOOs including some from secular olive trees. Food Nutr. Sci. 2014;5:89–95.

LinkOut - more resources