

Seroprevalence of SARS-CoV-2 Infection among Occupational Groups from the Bucaramanga Metropolitan Area, Colombia
- PMID: 33920843
- PMCID: PMC8071134
- DOI: 10.3390/ijerph18084172
Seroprevalence of SARS-CoV-2 Infection among Occupational Groups from the Bucaramanga Metropolitan Area, Colombia
Abstract
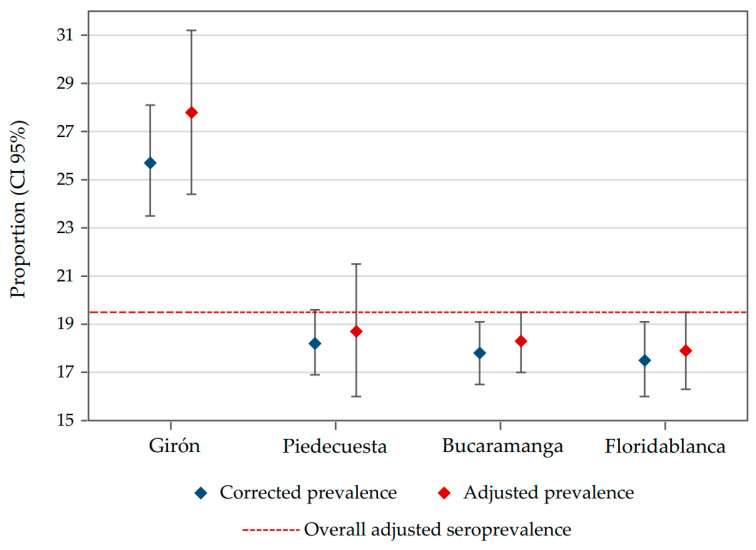
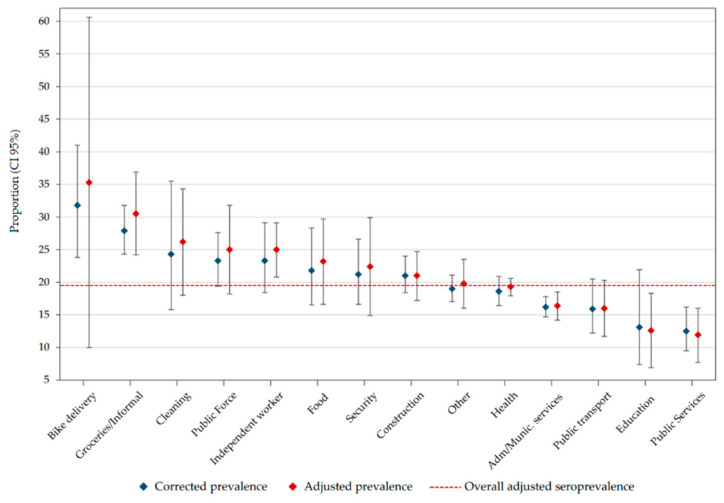
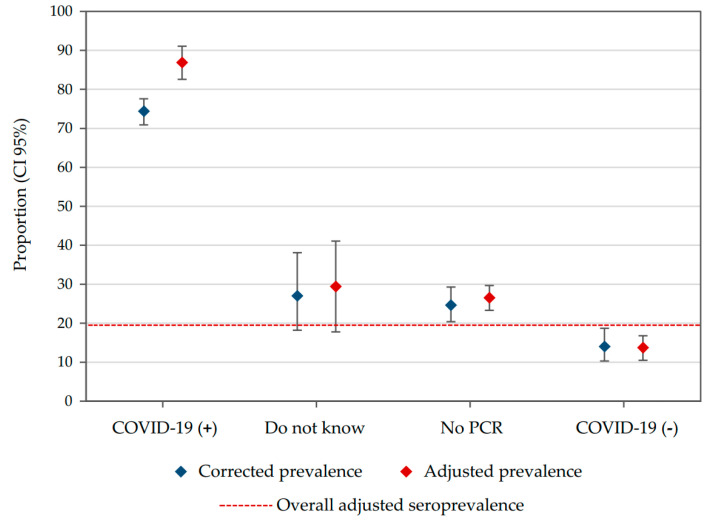
The negative effects of coronavirus disease 2019 (COVID-19) pandemic have impacted the world economy due to the absence from work because of SARS-CoV-2 infection in workers, among other reasons. However, some economic areas are essential to society and people must continue working outside the home to support economic reactivation; their serological profile could be different from that of the global population. Cross-sectional study: Workers from health, construction, public transportation, public force, bike delivery messengers, independent or informal commerce areas, and residents of Bucaramanga or its metropolitan area were invited to participate. All participants self-completed a virtual survey and a blood test was taken to assess IgG and IgM with the ARC COV2 test. Seroprevalence was estimated considering a complex survey design, correcting for a finite population effect and adjusting for test performance. A total of 7045 workers were enrolled; 59.9% were women and most were residents of Bucaramanga and working in health occupations. The global adjusted seroprevalence was 19.5% (CI: 95% 18.6-20.4), being higher for Girón (27.9%; 95% CI: 24.5-31.30). Workers with multiple contact with people during working hours or using public transportation to go to work had a higher frequency of seropositivity for SARS-CoV-2. The seroprevalence among workers living in these four municipalities from the Colombian northeast area is still low.
Keywords: coronavirus infections; occupational exposure; occupational health; prevalence; seroepidemiologic studies.
Conflict of interest statement
The authors declare no conflict of interest.
Figures
Similar articles
-
SARS-CoV-2 Seroprevalence in Those Utilizing Public Transportation or Working in the Transportation Industry: A Rapid Review.Int J Environ Res Public Health. 2022 Sep 15;19(18):11629. doi: 10.3390/ijerph191811629. Int J Environ Res Public Health. 2022. PMID: 36141897 Free PMC article. Review.
-
[Seroprevalence of anti-SARS-CoV-2 IgG/IgM antibodies in Borgosesia (Piedmont Region, Northern Italy) population: a surveillance strategy in post-lockdown period?].Epidemiol Prev. 2020 Sep-Dec;44(5-6 Suppl 2):200-206. doi: 10.19191/EP20.5-6.S2.119. Epidemiol Prev. 2020. PMID: 33412811 Italian.
-
SARS-CoV-2 in eight municipalities of the Colombian tropics: high immunity, clinical and sociodemographic outcomes.Trans R Soc Trop Med Hyg. 2022 Feb 1;116(2):139-147. doi: 10.1093/trstmh/trab094. Trans R Soc Trop Med Hyg. 2022. PMID: 34185868 Free PMC article.
-
Seroprevalence of the SARS-CoV-2 antibody in healthcare workers: a multicentre cross-sectional study in 10 Colombian cities.Occup Environ Med. 2022 Jun;79(6):388-395. doi: 10.1136/oemed-2021-107487. Epub 2021 Nov 5. Occup Environ Med. 2022. PMID: 34740981 Free PMC article.
-
Seroprevalence of Immunoglobulin M and G Antibodies against SARS-CoV-2 Virus: A Systematic Review and Meta-Analysis Study.Iran J Immunol. 2021 Mar;18(1):34-46. doi: 10.22034/iji.2021.87723.1824. Iran J Immunol. 2021. PMID: 33787512
Cited by
-
SARS-CoV-2 Seroprevalence in Those Utilizing Public Transportation or Working in the Transportation Industry: A Rapid Review.Int J Environ Res Public Health. 2022 Sep 15;19(18):11629. doi: 10.3390/ijerph191811629. Int J Environ Res Public Health. 2022. PMID: 36141897 Free PMC article. Review.
-
Longitudinal study of SARS-CoV-2 infections in different employee groups of long distance train services from June 2020 until February 2021 in Germany.Epidemiol Infect. 2022 Apr 20;150:1-22. doi: 10.1017/S095026882200070X. Online ahead of print. Epidemiol Infect. 2022. PMID: 35440359 Free PMC article.
-
[SARS-CoV-2 seroprevalence and associated factors among migrants with a vocation for permanence, Bucaramanga, ColombiaSoroprevalencia de SARS-CoV-2 e fatores associados em migrantes com vocaao de permanencia, Bucaramanga, Colombia.].Rev Cuid. 2023 Mar 29;13(3):e2657. doi: 10.15649/cuidarte.2657. eCollection 2022 Sep-Dec. Rev Cuid. 2023. PMID: 40115359 Free PMC article. Spanish.
-
Omicron-B.1.1.529 leads to widespread escape from neutralizing antibody responses.bioRxiv [Preprint]. 2021 Dec 22:2021.12.03.471045. doi: 10.1101/2021.12.03.471045. bioRxiv. 2021. Update in: Cell. 2022 Feb 3;185(3):467-484.e15. doi: 10.1016/j.cell.2021.12.046. PMID: 34981049 Free PMC article. Updated. Preprint.
-
SARS-CoV-2 Omicron-B.1.1.529 leads to widespread escape from neutralizing antibody responses.Cell. 2022 Feb 3;185(3):467-484.e15. doi: 10.1016/j.cell.2021.12.046. Epub 2022 Jan 4. Cell. 2022. PMID: 35081335 Free PMC article.
References
-
- Informe de Políticas Sobre los Efectos de la COVID-19 en América Latina y el Caribe. UNFPA América Latina y el Caribe. 2020. [(accessed on 1 March 2021)]; Available online: https://lac.unfpa.org/es/publications/informe-de-pol%C3%ADticas-sobre-lo....
-
- Informe de Política Monetaria—Abril de 2020. Banco de la República (Banco Central de Colombia). 2020. [(accessed on 1 March 2021)]; Available online: https://www.banrep.gov.co/es/informe-politica-monetaria-abril-2020.
-
- Comisión Económica Para América Latina y el Caribe. Enfrentar los Efectos Cada Vez Mayores del COVID-19 Para Una Reactivación Con Igualdad: Nuevas Proyecciones. 2020. [(accessed on 5 March 2021)]; Available online: https://www.cepal.org/es/publicaciones/45782-enfrentar-efectos-cada-vez-....
MeSH terms
Substances
LinkOut - more resources
Full Text Sources
Other Literature Sources
Medical
Miscellaneous
