. 2021 Apr 12;11(4):487.
doi: 10.3390/brainsci11040487.

The Relationship between Oscillations in Brain Regions and Functional Connectivity: A Critical Analysis with the Aid of Neural Mass Models

Affiliations

The Relationship between Oscillations in Brain Regions and Functional Connectivity: A Critical Analysis with the Aid of Neural Mass Models

Giulia Ricci et al. Brain Sci. .

Abstract

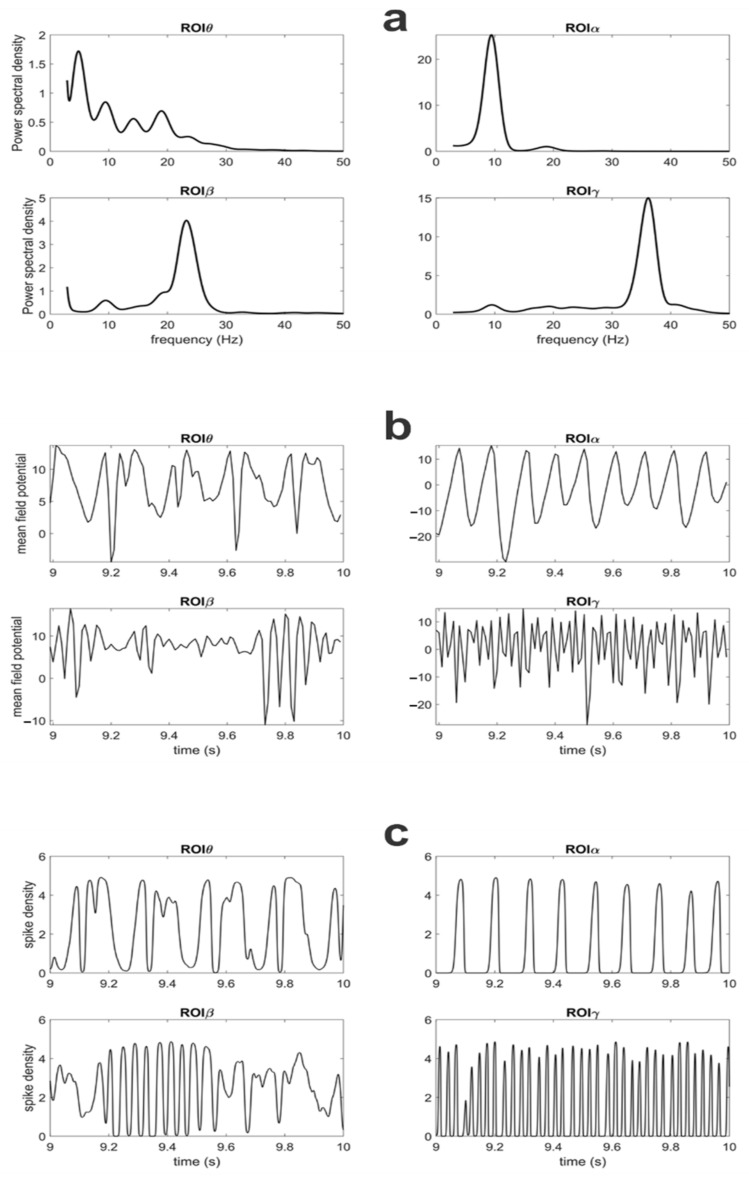
Propagation of brain rhythms among cortical regions is a relevant aspect of cognitive neuroscience, which is often investigated using functional connectivity (FC) estimation techniques. The aim of this work is to assess the relationship between rhythm propagation, FC and brain functioning using data generated from neural mass models of connected Regions of Interest (ROIs). We simulated networks of four interconnected ROIs, each with a different intrinsic rhythm (in θ, α, β and γ ranges). Connectivity was estimated using eight estimators and the relationship between structural connectivity and FC was assessed as a function of the connectivity strength and of the inputs to the ROIs. Results show that the Granger estimation provides the best accuracy, with a good capacity to evaluate the connectivity strength. However, the estimated values strongly depend on the input to the ROIs and hence on nonlinear phenomena. When a population works in the linear region, its capacity to transmit a rhythm increases drastically. Conversely, when it saturates, oscillatory activity becomes strongly affected by rhythms incoming from other regions. Changes in functional connectivity do not always reflect a physical change in the synapses. A unique connectivity network can propagate rhythms in very different ways depending on the specific working conditions.

Keywords: Granger causality; connectivity; cortical rhythms; excitatory and inhibitory synapses; neural mass models; nonlinear neural phenomena.


Conflict of interest statement

The authors declare no conflict of interest.

Figures

Figure 1
Figure 1
(a) Scheme of the neural mass model simulating the dynamics in a single Region of Interest (ROI). Blue continuous lines with arrows indicate glutamatergic excitatory synapses; red dash-dotted lines with open squares indicate GABAergic faster inhibitory synapses; brown dotted lines with open circles indicate GABAergic slower inhibitory synapses. Symbol Cij denotes the synaptic contacts among the neural populations where the first subscript and the second subscript represent the postsynaptic population and presynaptic population, respectively. up and uf represent inputs to the pyramidal neuron population and to the fast inhibitory interneuron population, respectively. These inputs can come from the external environment (Ip and If, respectively), from noise (np and nf, respectively) or from glutamatergic synapses from pyramidal neurons in other ROIs. (b) an example of excitatory connections between two ROIs via a direct link from the pyramidal neurons of the source ROI to the pyramidal neurons of the target ROI. (c) an example of a bisynaptic inhibitory connection, from the pyramidal neurons of the source ROI to the fast inhibitory neurons of the target ROI (which, in turn, inhibit pyramidal neurons in the target ROI).
Figure 2
Figure 2
Connectivity networks among the four ROIs used in the present work (dashed red lines and continuous black lines denote inhibitory and excitatory connections, respectively). The network in (A) simulates a possible physiological connectivity from occipital (or thalamic) regions to motor regions and temporal/frontal regions. This network, by varying the strength of a single connection or the input value to a single ROI, was used to obtain the results shown in Figures 6–13 using the functional connectivity (FC) metrics based on Granger causality (but see also Figure S4 in Supplementary Materials part 2 for the other FC metrics). The simple loop network in (B) allows a straightforward analysis of rhythm propagation in a chain of interconnected ROIs; the corresponding results are reported in Supplementary Materials part 2 (Figures S5 and S6).
Figure 3
Figure 3
Power spectral densities of potential for the pyramidal population in the four different ROIs (a) simulated with the connectivity as in Figure 2A and all inputs as great as 400. Power spectral densities (PSDs) have been obtained by computing the Welch periodogram on membrane potentials of pyramidal neurons. Parameters for each ROI and noise levels are shown in Table S1 of Supplementary Materials part 1. (b,c) represent the temporal pattern of membrane potential of pyramidal neurons and their spike densities, respectively, during the last second of the simulation.
Figure 4
Figure 4
ROC curves (a) and precision–recall curves (b) obtained with the different FC estimators using the data obtained from 100 randomly generated connectivity networks among the four ROIs. The area under the ROC curve for each estimator is reported in Table 1.
Figure 5
Figure 5
Relationship between the connectivity estimated with the temporal Granger causality and the true connectivity, obtained using the data from 100 randomly generated connectivity networks. It is worth noting that, in these nets, connections were randomly generated between 0 and 40 (step 10). Points are mean values at each connection strength, and bars denote standard deviations. The estimator is able to grasp the monotonic increase in connectivity. It is worth noting the large SDs occur especially when the connectivity is high and when a connection emerges from the ROIβ. See discussion.
Figure 6
Figure 6
Values of connectivity among the ROIs estimated with the temporal Granger estimator, with reference to the network in Figure 2A, when one connection is progressively varied in the x-axis (from 0 to 50, with step of 10), and the other connections are maintained at the basal value as in Figure 2A. It is worth noting that the estimator is able to detect the progressive increase in a single synaptic strength, while the other estimates remain almost constant. As an exception, we observed that the increase in a synapse entering into ROIγ is often associated with a decrease in another synapse entering the same ROI. It is also worth noting the higher sensitivity of the estimator to the connection γ → θ.
Figure 7
Figure 7
Upper panels: Values of connectivity among the ROIs estimated with the temporal Granger causality, with reference to the network in Figure 2A, when the input to pyramidal neurons in ROIβ was progressively varied from 0 to 800, as in the x-axis, and all other inputs and connections were maintained at the basal value, as in Figure 2A. It is worth noting the strong effect that the input change has on the connections which involve the ROIβ (in particular the output connection β → γ and the input connection γ → β). Additionally, the connection between ROIγ and ROIθ is affected. Bottom panels: connectivity graphs obtained from the estimates using a threshold as low as 0.015 (the threshold is depicted as a horizontal black line in the upper panels).
Figure 8
Figure 8
Upper panels: Values of connectivity among the ROIs estimated with the temporal Granger causality, with reference to the network in Figure 2A, when the input to pyramidal neurons in ROIγ was progressively varied from 200 to 1000, as in the x-axis, and all other inputs and connections were maintained at the basal value, as in Figure 2A. It is worth noting the strong effect that the input change has on several connections which involve the ROIγ. Bottom panels: connectivity graphs obtained from the estimates using a threshold as low as 0.015 (the threshold is depicted as a horizontal black line in the upper panels).
Figure 9
Figure 9
Upper panels: Values of connectivity among the ROIs estimated with the temporal Granger causality, with reference to the network in Figure 2A, when the input to pyramidal neurons in ROIθ was progressively varied from 0 to 800, as in the x-axis, and all other inputs and connections were maintained at the basal value, as in Figure 2A. It is worth noting the strong effect that the input change has on the connections which involve the ROIθ. Bottom panels: connectivity graphs obtained from the estimates using a threshold as low as 0.015 (the threshold is depicted as a horizontal black line in the upper panels).
Figure 10
Figure 10
Upper panels: Values of connectivity among the ROIs estimated with the temporal Granger causality with reference to the network in Figure 2A, when the input to pyramidal neurons in ROIα was progressively varied from 0 to 800, as in the x-axis, and all other inputs and connections were maintained at the basal value, as in Figure 2A. It is worth noting that all estimated connections from ROIα to the other regions increase significantly. Many other connections increase too with the appearance of spurious terms. Bottom panels: connectivity graphs obtained from the estimates using a threshold as low as 0.015 (the threshold is depicted as a horizontal black line in the upper panels). The emergence of spurious connections is evident from these graphs.
Figure 11
Figure 11
Values of connectivity among the ROIs estimated with the spectral Granger causality with reference to the network in Figure 2A and plotted as a function of frequency (note the use of different y-axes to emphasize the different cases). The estimator reproduced the network connectivity quite well: the exchange of rhythms between ROIβ and ROIγ (a) and between ROIγ and ROIθ (c) is evident; the coupling between ROIθ and ROIβ is negligible (b); and the α rhythm is clearly transmitted from ROIα to the other regions (df).
Figure 12
Figure 12
Values of connectivity among the ROIs estimated with the spectral Granger causality, with reference to the network in Figure 2A but with the input to ROIβ reduced from 400 down to 100. The values are plotted as a function of frequency (note the use of different y-axes to emphasize the different cases). From the comparison of these panels with those in Figure 11 emerges that: the absence of α rhythm transmitted from ROIβ to ROIγ is evident (a); the coupling between ROIθ and ROIβ is negligible (b); the transmission γ→θ is significantly reduced, while that θ → γ is increased (c); the α rhythm transmission from ROIα to ROIβ (d) and from ROIα to ROIγ is increased (e); while the α rhythm transmission from ROIα to ROIθ (f) is similar.
Figure 13
Figure 13
Values of connectivity among the ROIs estimated with the spectral Granger causality, with reference to the network in Figure 2A but with the input to ROIα increased from 200 to 400. The values are plotted as a function of frequency (note the use of different y-axes to emphasize the different cases). From the comparison of these panels with those in Figure 11 emerges that: the α rhythm transmitted from ROIα to the other regions becomes almost sinusoidal (high and sharp spectra (df)); the rhythm exchange between ROIβ and ROIγ (a) and between ROIθ and ROIγ (c) are significantly altered, with the presence of components in the α range; finally, spurious connections appear between ROIβ and ROIθ (b), both in the β and α ranges. Comparing this figure with the corresponding bottom panel in Figure 10, the spectral Granger causality provides similar information as the temporal Granger causality, but with emphasis on the frequency bands.

References

    1. Reid A.T., Headley D.B., Mill R.D., Sanchez-Romero R., Uddin L.Q., Marinazzo D., Lurie D.J., Valdés-Sosa P.A., Hanson S.J., Biswal B.B., et al. Advancing Functional Connectivity Research from Association to Causation. Nat. Neurosci. 2019;22:1751–1760. doi: 10.1038/s41593-019-0510-4. - DOI - PMC - PubMed
    1. Friston K., Moran R., Seth A.K. Analysing Connectivity with Granger Causality and Dynamic Causal Modelling. Curr. Opin. Neurobiol. 2013;23:172–178. doi: 10.1016/j.conb.2012.11.010. - DOI - PMC - PubMed
    1. Wang H.E., Bénar C.G., Quilichini P.P., Friston K.J., Jirsa V.K., Bernard C. A Systematic Framework for Functional Connectivity Measures. Front. Neurosci. 2014;8:405. doi: 10.3389/fnins.2014.00405. - DOI - PMC - PubMed
    1. Bastos A.M., Schoffelen J.-M. A Tutorial Review of Functional Connectivity Analysis Methods and Their Interpretational Pitfalls. Front. Syst. Neurosci. 2015;9:175. doi: 10.3389/fnsys.2015.00175. - DOI - PMC - PubMed
    1. Grefkes C., Eickhoff S.B., Nowak D.A., Dafotakis M., Fink G.R. Dynamic Intra- and Interhemispheric Interactions during Unilateral and Bilateral Hand Movements Assessed with FMRI and DCM. Neuroimage. 2008;41:1382–1394. doi: 10.1016/j.neuroimage.2008.03.048. - DOI - PubMed

LinkOut - more resources