. 2021 Apr 12;21(8):2710.
doi: 10.3390/s21082710.

Nonlinear T-Wave Time Warping-Based Sensing Model for Non-Invasive Personalised Blood Potassium Monitoring in Hemodialysis Patients: A Pilot Study

Affiliations

Nonlinear T-Wave Time Warping-Based Sensing Model for Non-Invasive Personalised Blood Potassium Monitoring in Hemodialysis Patients: A Pilot Study

Flavio Palmieri et al. Sensors (Basel). .

Abstract

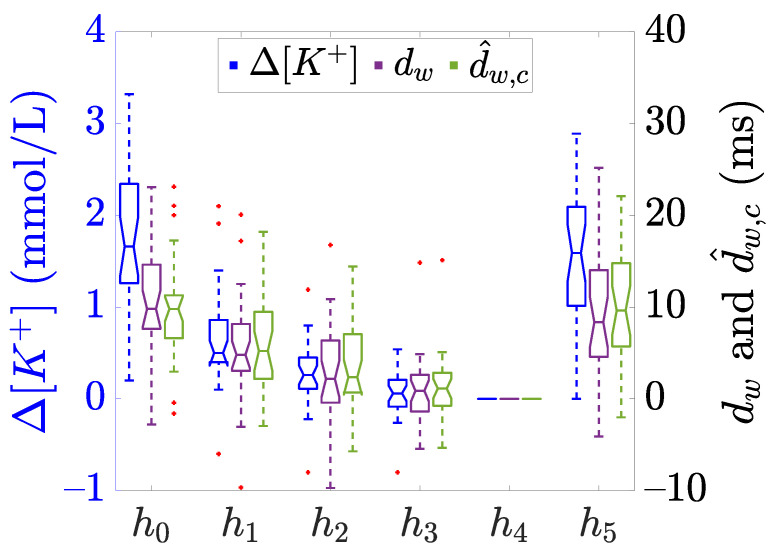
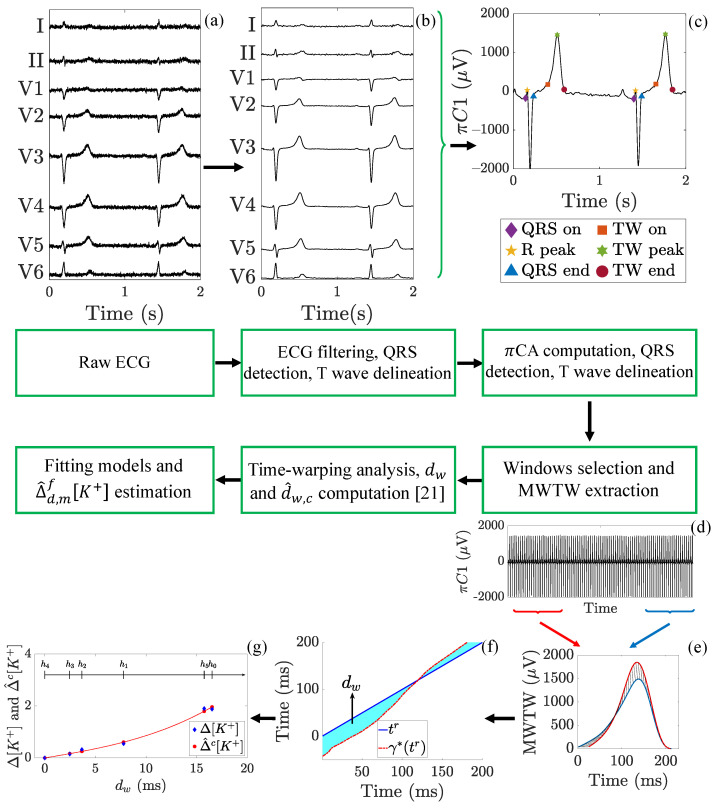
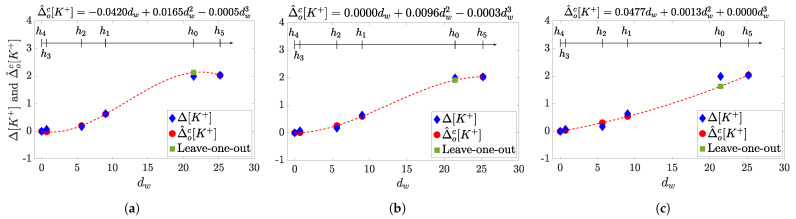
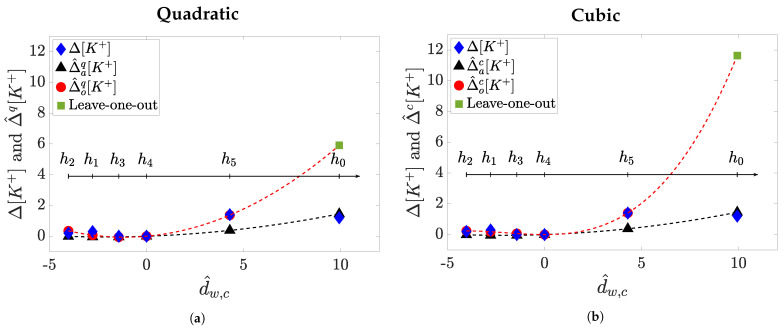
Background: End-stage renal disease patients undergoing hemodialysis (ESRD-HD) therapy are highly susceptible to malignant ventricular arrhythmias caused by undetected potassium concentration ([K+]) variations (Δ[K+]) out of normal ranges. Therefore, a reliable method for continuous, noninvasive monitoring of [K+] is crucial. The morphology of the T-wave in the electrocardiogram (ECG) reflects Δ[K+] and two time-warping-based T-wave morphological parameters, dw and its heart-rate corrected version dw,c, have been shown to reliably track Δ[K+] from the ECG. The aim of this study is to derive polynomial models relating dw and dw,c with Δ[K+], and to test their ability to reliably sense and quantify Δ[K+] values.

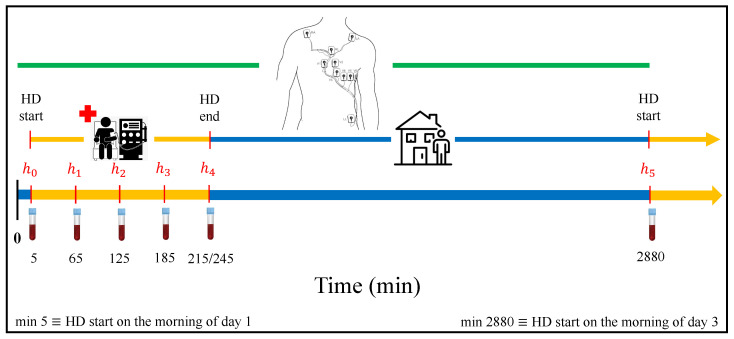
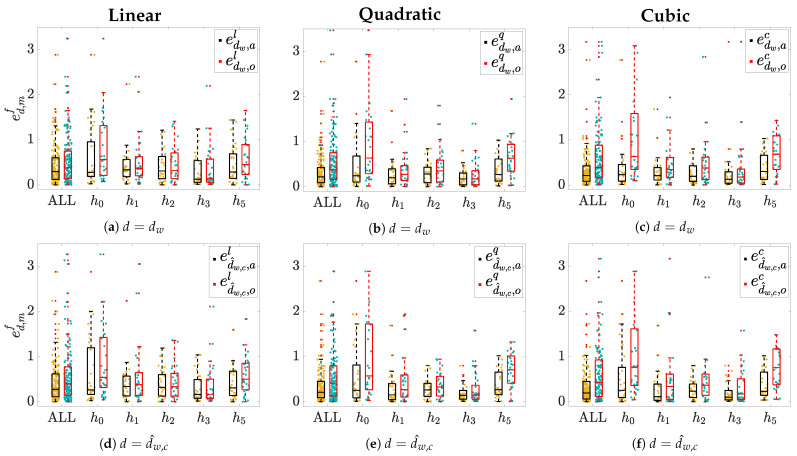
Methods: 48-hour Holter ECGs and [K+] values from six blood samples were collected from 29 ESRD-HD patients. For every patient, dw and dw,c were computed, and linear, quadratic, and cubic fitting models were derived from them. Then, Spearman's (ρ) and Pearson's (r) correlation coefficients, and the estimation error (ed) between Δ[K+] and the corresponding model-estimated values (Δ^[K+]) were calculated.

Results and discussions: Nonlinear models were the most suitable for Δ[K+] estimation, rendering higher Pearson's correlation (median 0.77 ≤r≤ 0.92) and smaller estimation error (median 0.20 ≤ed≤ 0.43) than the linear model (median 0.76 ≤r≤ 0.86 and 0.30 ≤ed≤ 0.40), even if similar Spearman's ρ were found across models (median 0.77 ≤ρ≤ 0.83).

Conclusion: Results support the use of nonlinear T-wave-based models as Δ[K+] sensors in ESRD-HD patients.

Keywords: T-wave morphology; electrocardiogram; noninvasive potassium sensing; periodic component analysis; personalised medicine; time warping.


Conflict of interest statement

The authors declare no conflict of interest. The funders had role in the design of the study but they had no role in the collection, analyses, or interpretation of data nor in the writing of the manuscript, or in the decision to publish the results.

Figures

Figure 1
Figure 1
Data acquisition protocol. Holter electrocardiogram (ECG) signals of end-stage renal disease patients undergoing hemodialysis (ESRD-HD) patients were acquired throughout 48 h, starting 5 min before the beginning of the HD therapy. Six blood samples were collected at the beginning of the therapy (h0), each hour during the HD (h1, h2, h3), at the end (h4, at minute 215th or 245th, depending on the HD duration) and before the beginning of the next HD session (h5).
Figure 2
Figure 2
Boxplots showing the distribution of Δ[K+] (blue) and the described πCT-based time warping biomarkers dw (purple) and d^w,c (green), computed at each time points (h0 to h5), see Figure 1. The central line of the boxplots represents the median, the edges of the box are the 25-th and 75-th percentiles, and the whiskers extend to the most extreme data points not considered as outliers. The notches represent the 95% confidence interval of the median, calculated as q21.57(q3q1)/n and q2 + 1.57(q3q1)/n being q2 the median, q1 and q3 are the 25-th and 75-th percentiles, respectively, and n is the sample size. Finally, red “+” denotes outliers. Data adapted from [20,21].
Figure 3
Figure 3
Flow chart showing the ECG processing steps performed in this study. (a) Raw ECG (the eight independent leads I, II, V1 to V6 are shown) obtained from one of the enrolled ESRD-HD patients (see Section 2). (b) Preprocessed ECG as described in Section 3.1. (c) πCA is applied and both QRS complexes and T-waves (TW in the legend) are detected and delineated as detailed in Section 3.2. (d) From 2-min wide windows, (e) a mean warped T-wave (MWTW) is extracted and (f) T-wave morphology markers dw and d^w,c are computed as stated in Section 3.3. (g) The fitting models for Δ^d,mf[K+] estimation are evaluated as in Section 3.5. In this example, a cubic model with m = a is presented.
Figure 4
Figure 4
Estimation error (ed,mf(p,hi)) distributions across patients for each hour hi and when pooling all samples together (ALL). Panels (a,d) show results for linear models f = l; panels (b,e) show the quadratic and panels f = q; and (c,f) show the cubic model f = c. Yellow dots represent individual error values when m = a, while light-blue ones denote those obtained when m = o. Corresponding boxplots are depicted on top of each distribution: The black ones represent the errors in m = a while the red ones represents error in case of m = o. “+” denotes outliers.
Figure 5
Figure 5
Examples of cubic models (red dotted lines) computed for a given patient by imposing different parameter restrictions for leave-on-out cross-validation method, the corresponding equations are reported above each panel. The resulting model without restrictions on {αc,βc,γc} is in panel (a), while those from imposing αc ≥ 0, or full constrained model are presented in (b,c) respectively. In each panel: The blue diamonds represent measured Δ[K+] values at the hours {h0,h1,h2,h3,h4,h5}; while red dots are the estimated Δ^dw,oc[K+] corresponding to the computed dw used in the training set and computed at {h1,h2,h3,h4,h5}; the green square is the estimated Δ^dw,oc[K+] corresponding to the dw at h0, the hour excluded from the training set in this example, and then the one with higher risk for error in the estimation. See that only full set of parameters forced to be positive result in a monotonic, physiologically plausible, function.
Figure 6
Figure 6
Example of leave-one-out model prediction (m = o) at h0 compared to a m = a approach for a given patient. The quadratic models (f = q) are depicted in panel (a) while the cubic ones (f = c) are in panel (b). In each panel: The blue diamonds represent measured Δ[K+] values at each hour {h0,h1,h2,h3,h4,h5}; the black triangles are the estimated Δ^d^w,c,af[K+] while the red dots are Δ^d^w,c,of[K+] corresponding to the d^w,c used in the training set {h1,h2,h3,h4,h5}, and the green square is the predicted Δ^d^w,c,of[K+] corresponding to the d^w,c at h0, the hour excluded from the training set. The blackdashed line is the model in m = a while the red-dashed line accounts for the model in m = o.

References

    1. Segall L., Nistor I., Covic A. Heart Failure in Patients with Chronic Kidney Disease: A Systematic Integrative Review. BioMed Res. Int. 2014;2014 doi: 10.1155/2014/937398. - DOI - PMC - PubMed
    1. Collins A.J., Foley R.N., Herzog C., Chavers B., Gilbertson D., Ishani A., Kasiske B., Liu J., Mau L.-W., McBean M., et al. US Renal Data System 2010 Annual Data Report. Am. J. Kidney Dis. 2011;51(Suppl. 1):e1–e526. doi: 10.1053/j.ajkd.2010.10.007. - DOI - PubMed
    1. London G.M. The Clinical Epidemiology of Cardiovascular Diseases in Chronic Kidney Disease: Cardiovascular Disease in Chronic Renal Failure: Pathophysiologic Aspects. Semin. Dial. 2003;16:85–94. doi: 10.1046/j.1525-139X.2003.16023.x. - DOI - PubMed
    1. Johnson D.W., Craven A.M., Isbel N.M. Modification of cardiovascular risk in hemodialysis patients: An evidence-based review. Hemodial. Int. 2007;11:1–14. doi: 10.1111/j.1542-4758.2007.00146.x. - DOI - PubMed
    1. Perl J., Chan C. Timing of sudden death relative to the hemodialysis procedure. Nat. Rev. Nephrol. 2006;2:668–669. doi: 10.1038/ncpneph0345. - DOI - PubMed

LinkOut - more resources