. 2021 Apr 12;21(8):2717.
doi: 10.3390/s21082717.

Cityscape LoRa Signal Propagation Predicted and Tested Using Real-World Building-Data Based O-FDTD Simulations and Experimental Characterization

Affiliations

Cityscape LoRa Signal Propagation Predicted and Tested Using Real-World Building-Data Based O-FDTD Simulations and Experimental Characterization

Ricardo M R Adão et al. Sensors (Basel). .

Abstract

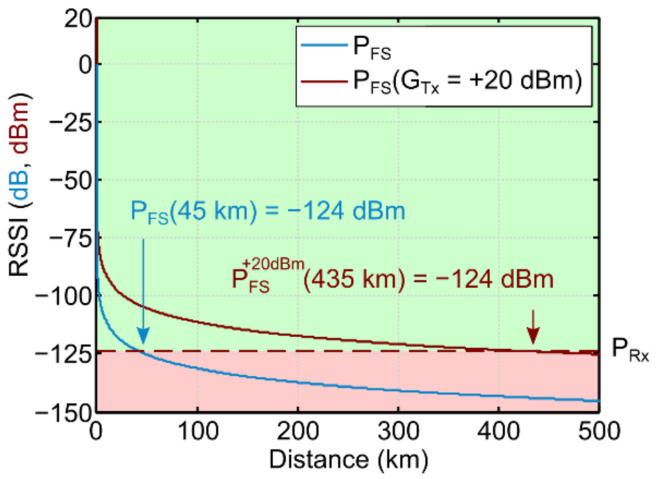
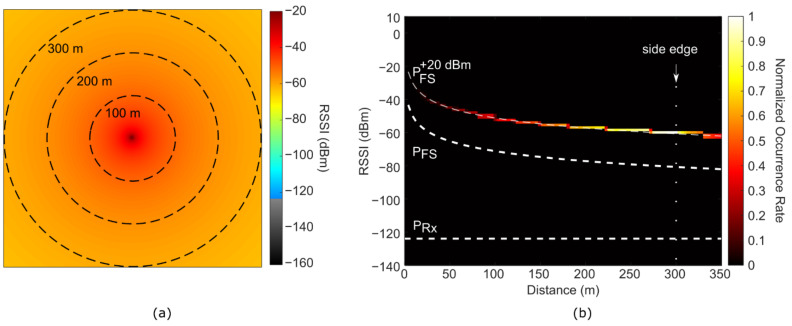
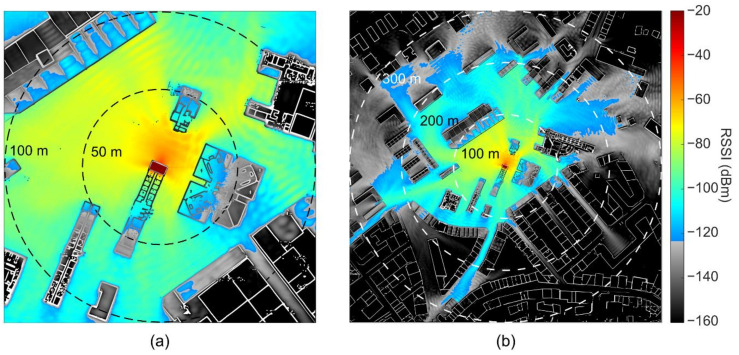
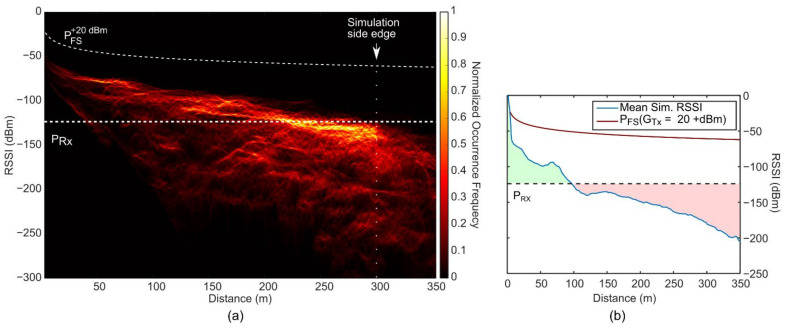
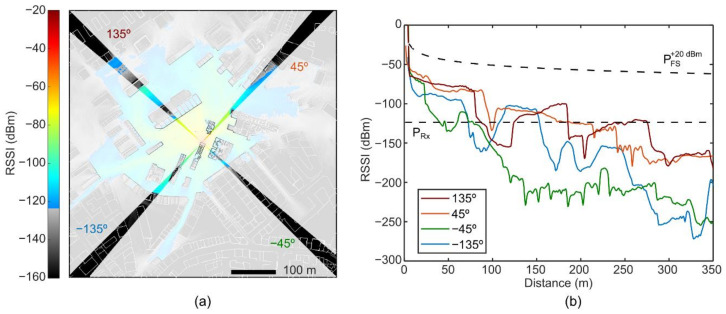
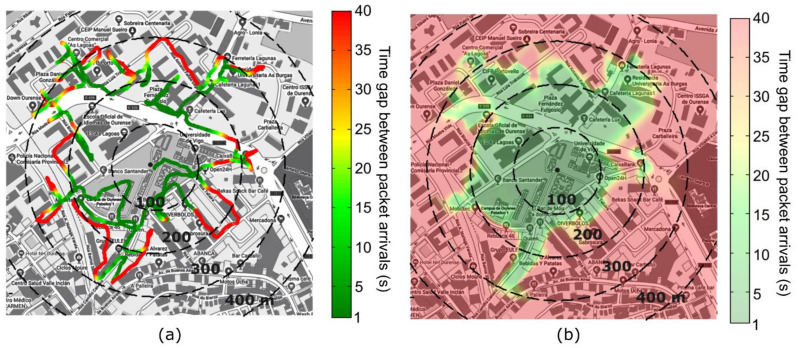
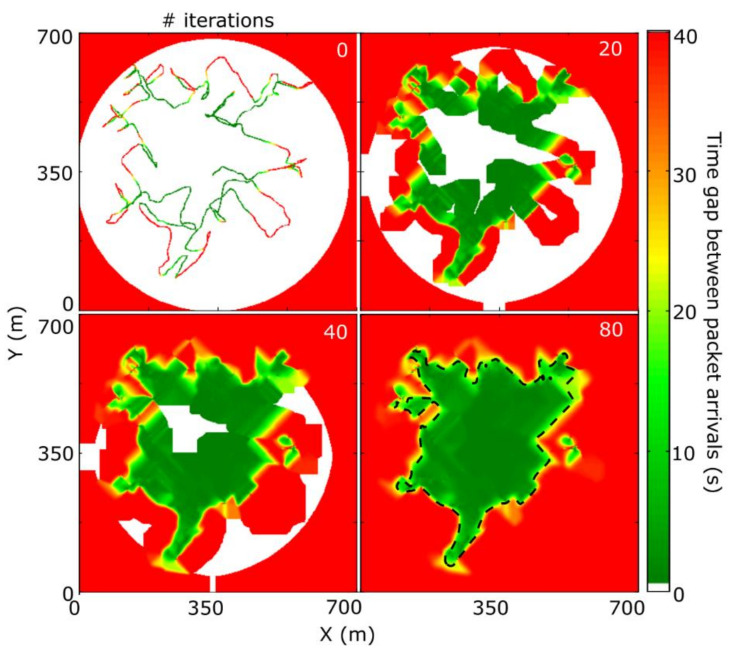
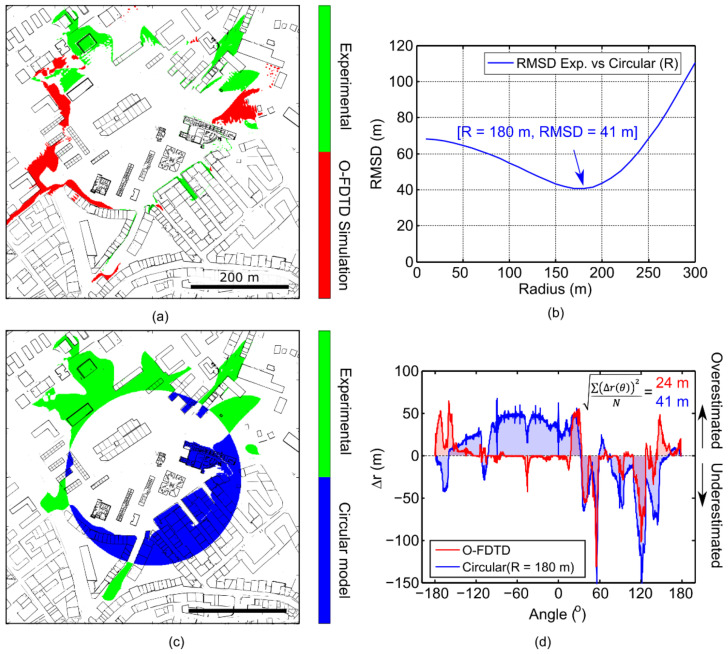
The age of the Internet of Things (IoT) and smart cities calls for low-power wireless communication networks, for which the Long-Range (LoRa) is a rising star. Efficient network engineering requires the accurate prediction of the Received Signal Strength Indicator (RSSI) spatial distribution. However, the most commonly used models either lack the physical accurateness, resolution, or versatility for cityscape real-world building distribution-based RSSI predictions. For this purpose, we apply the 2D electric field wave-propagation Oscillator Finite-Difference Time-Domain (O-FDTD) method, using the complex dielectric permittivity to model reflection and absorption effects by concrete walls and the receiver sensitivity as the threshold to obtain a simulated coverage area in a 600 × 600 m2 square. Further, we report a simple and low-cost method to experimentally determine the signal coverage area based on mapping communication response-time delays. The simulations show a strong building influence on the RSSI, compared against the Free-Space Path (FSPL) model. We obtain a spatial overlap of 84% between the O-FDTD simulated and experimental signal coverage maps. Our proof-of-concept approach is thoroughly discussed compared to previous works, outlining error sources and possible future improvements. O-FDTD is demonstrated to be most promising for both indoors and outdoors applications and presents a powerful tool for IoT and smart city planners.

Keywords: Internet of Things (IoT); LoRa; O-FDTD simulations; RF propagation; RSSI; smart city.


Conflict of interest statement

The authors declare no conflict of interest. The funders had no role in the design of the study; in the collection, analyses, or interpretation of data; in the writing of the manuscript, or in the decision to publish the results.

Figures

Figure 1
Figure 1
Implemented Long-Range (LoRa) Gateway system. (a) Schematic of the LoRa communication test device equipped with various sensors on an electronic breadboard. (b) Diagram of the communication process.
Figure 2
Figure 2
A plot of the calculated free-space Received Signal Strength Indicator (RSSI), PFS power decay over distance, for an 868 MHz LoRa signal. The estimated receiver sensitivity PRx = −124 dBm yields maximum coverage distances of 45 km (blue) and 435 km (orange) for transmitter gains GTx of 0 dBm and +20 dBm, respectively.
Figure 3
Figure 3
Theoretical free-space Received Signal Strength Indicator (RSSI) distribution of an 868 MHz LoRa signal over distance with a transmitter gain of GTx = +20 dBm. (a) 2D representation of free-space RSSI in a radius of 300 m. (b) 2D histogram of combined RSSI and distance occurrences in the RSSI map shown in (a). The color scale indicates the relative occurrence rate, normalized to the number of map pixels. The dashed white lines represent the free-space RSSI (PFS) for GTx of 0 and +20 dBm, and the receiver sensitivity PRx of −124 dBm, as indicated by the labels. The vertical dotted line indicates the 300 m spatial observation window used in the RSSI map representation in (a).
Figure 4
Figure 4
O-FDTD simulation of LoRa Received Signal Strength Indicator (RSSI) in Ourense for a signal source located indoors (center of the map). The building wall lines from Google Maps are overlaid onto the simulations for improved visualization. (a) Close-up 200 × 200 m2 map. (b) Zoom-out (full) 600 × 600 m2 map. The false color map turns to grayscale for RSSI values below the calculated receiver sensitivity of −124 dBm.
Figure 5
Figure 5
Statistical analysis of the real-world building-based O-FDTD simulated Received Signal Strength Indicator (RSSI). (a) 2D histogram of combined RSSI and distance occurrences in the simulated RSSI map. The color scale indicates the relative occurrence rate, normalized to the number of map pixels. The dashed white lines represent the free-space RSSI (PFS) for transmitter gains GTx of 0 and +20 dBm, and the receiver sensitivity PRx of −124 dBm, as indicated by the labels. The vertical dotted line indicates the 300 m spatial observation window used in the simulated RSSI map. (b) Free-space RSSI, PFS(GTx = +20 dBm) (orange) in comparison to the mean O-FDTD simulated RSSI over distance (blue). The green and red highlights indicate the distances for which the simulated RSSI is, on average, above and below the receiver sensitivity.
Figure 6
Figure 6
Distance dynamics of O-FDTD simulated Received Signal Strength Indicator (RSSI) for a sample of regions within the simulated cityscape maps. (a) Map of the arbitrarily selected propagation directions, with Δθ = 5° and θ = −135°, −45°, 45°, and 135°. The vivid and faded-colored regions indicate the analyzed and disregarded areas. (b) Mean RSSI over distance for each of the selected propagation directions.
Figure 7
Figure 7
Mapping of time gap between packet arrivals around the LoRa gateway receiver. (a) Time gap between packet arrivals measured along the trajectory used to determine the edge of the signal coverage area. (b) Interpolated map of time gap between packet arrivals, obtained by expanding the results in (a) in all directions. The displayed city maps were retrieved from Google Maps [51].
Figure 8
Figure 8
Expansion of experimental time gaps between packet arrivals measured along a line trajectory around the LoRa gateway into a map of time gap between packet arrivals, using an iterative flood-like interpolation algorithm. The four subplots show the results after 0 (starting point), 20, 40, and 80 iterations. The dashed line indicates the edge of the coverage area, defined as the interface where the time gap between packet arrivals equals 20 s.
Figure 9
Figure 9
Correlation between simulation and experimental results. (a) Overlay of the experimentally determined coverage area onto the simulated Received Signal Strength Indicator (RSSI) map. (b) Color-coded overlay of (red) O-FDTD simulation only, (green) experimental only, and (yellow) overlapping coverage areas (CA). Spatial overlap of 84% between the simulated and experimental coverage areas is identified. (c) Histogram of covered distances and (d) circular coverage within the experimental (green) and simulated (red) coverage areas. The red, yellow, and green shades relate directly to the regions identified in (b).
Figure 10
Figure 10
Correlation between the edges of the simulation and experimental coverage areas. (a) Color-coded overlay of O-FDTD simulation (red), experimental (green) coverage differences. (b) Minimization of the Root Mean Squared Differences (RMSD) between the experimental coverage area and a path-loss circular model. (c) Color-coded overlay of optimized circular model (blue), experimental (green) coverage differences. (d) Deviations of the O-FDTD (red) and optimized circle (blue) models from the experimentally determined coverage in dependence of the detection angle, with a 0.2 o resolution. Effective RMSD of 24 and 41 m are determined, respectively.

References

    1. Centenaro M., Vangelista L., Zanella A., Zorzi M. Long-range communications in unlicensed bands: The rising stars in the IoT and smart city scenarios. IEEE Wirel. Commun. 2016;23:60–67. doi: 10.1109/MWC.2016.7721743. - DOI
    1. Raza U., Kulkarni P., Sooriyabandara M. Low Power Wide Area Networks: An Overview. IEEE Commun. Surv. Tutor. 2017;19:855–873. doi: 10.1109/COMST.2017.2652320. - DOI
    1. LoRa Alliance LoRaWAN 1.1 Specification 2017, 101. [(accessed on 4 April 2021)]; Available online: https://lora-alliance.org/resource_hub/lorawan-specification-v1-1/
    1. Tome M.D.C., Nardelli P.H.J., Alves H. Long-Range Low-Power Wireless Networks and Sampling Strategies in Electricity Metering. IEEE Trans. Ind. Electron. 2018;66:1629–1637. doi: 10.1109/TIE.2018.2816006. - DOI
    1. Ahlers D., Driscoll P., Kraemer F., Anthonisen F., Krogstie J. A Measurement-Driven Approach to Understand Urban Greenhouse Gas Emissions in Nordic Cities; Proceedings of the NIK-2016 Conference; Bergen, Norway. 28–30 November 2016.

LinkOut - more resources