Review
. 2021 Apr 19;13(8):1966.
doi: 10.3390/cancers13081966.

Systematic Review and Network Meta-Analysis of Anaplastic Lymphoma Kinase (ALK) Inhibitors for Treatment-Naïve ALK-Positive Lung Cancer

Affiliations
Review

Systematic Review and Network Meta-Analysis of Anaplastic Lymphoma Kinase (ALK) Inhibitors for Treatment-Naïve ALK-Positive Lung Cancer

Cheng-Hao Chuang et al. Cancers (Basel). .

Abstract

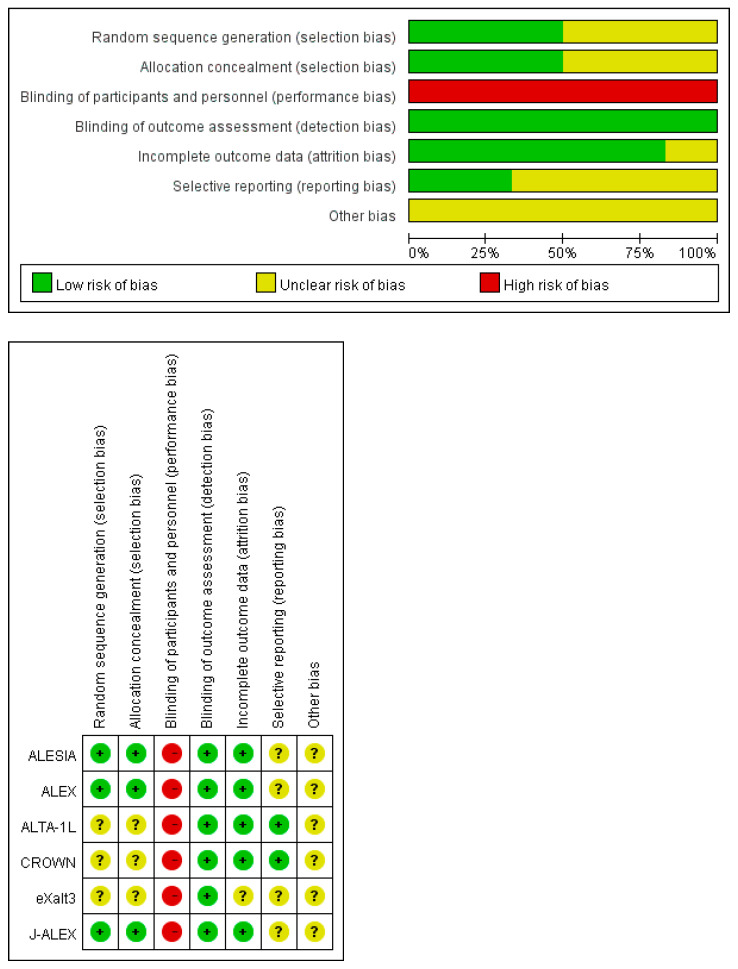
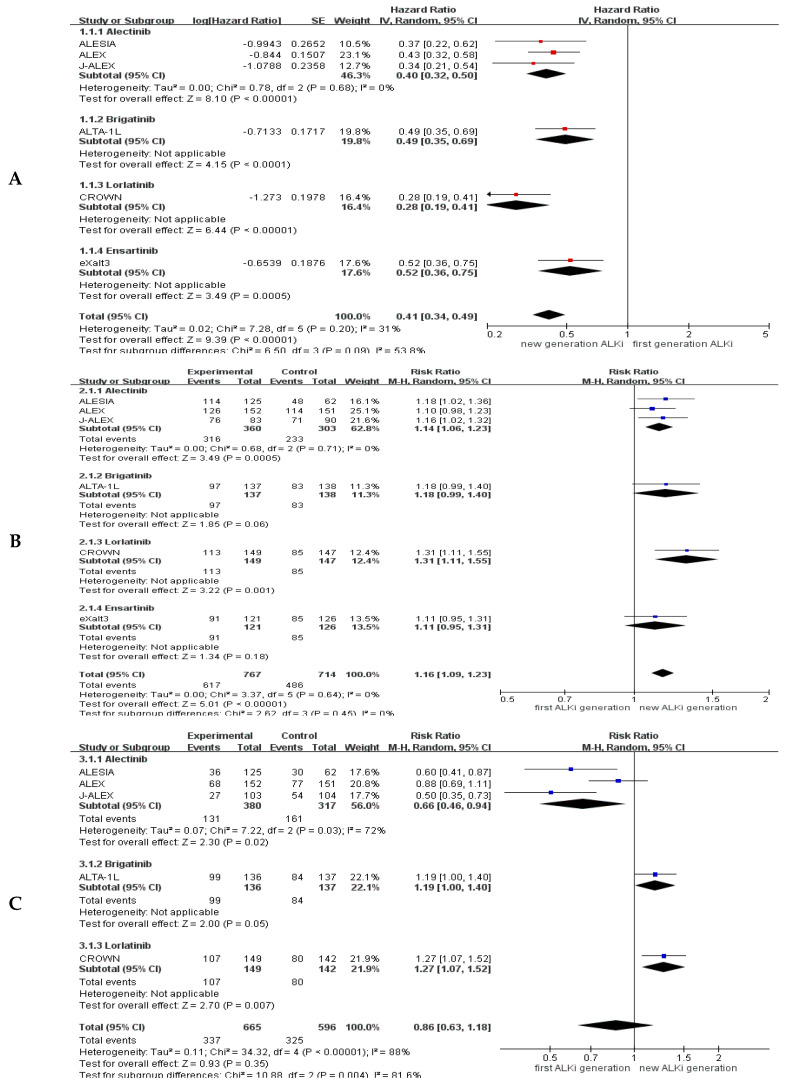
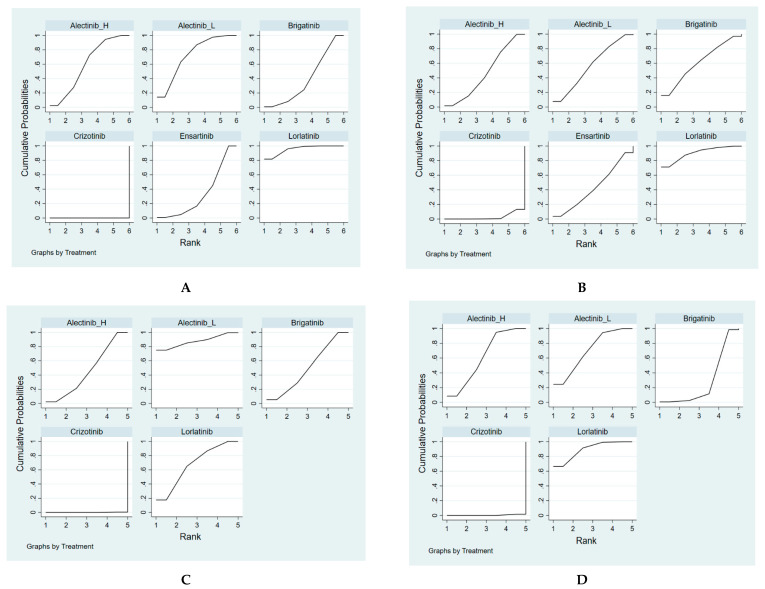
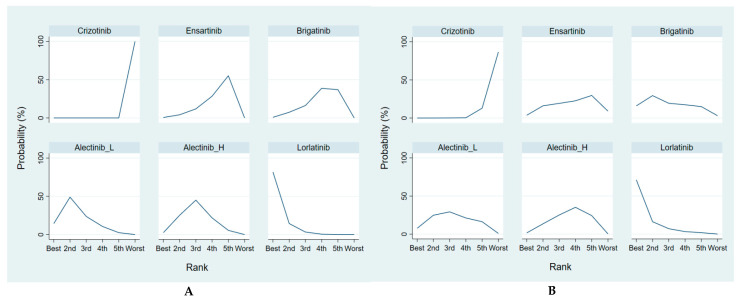
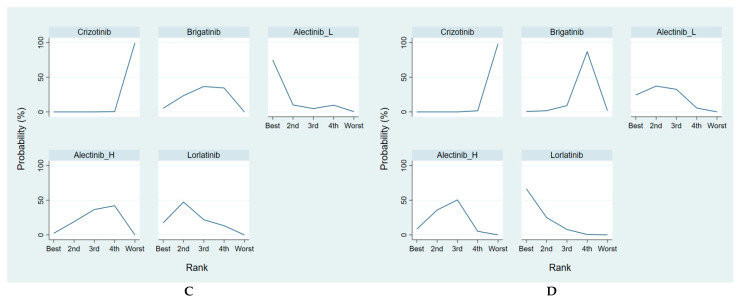
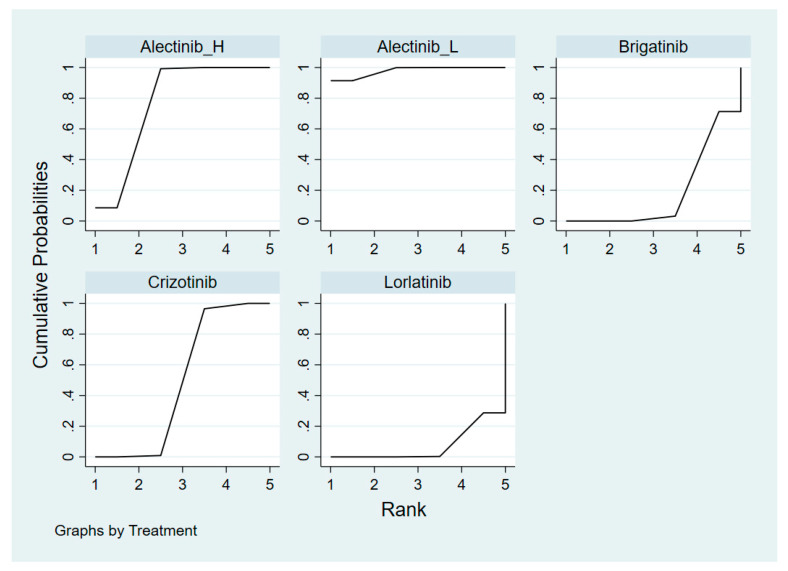
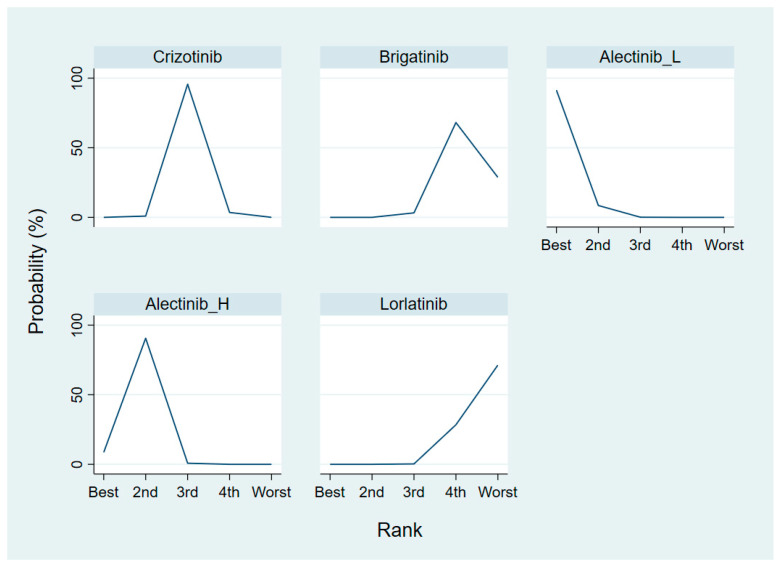
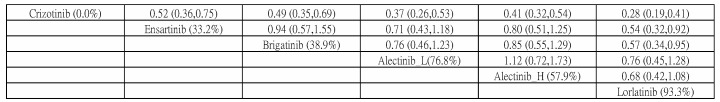
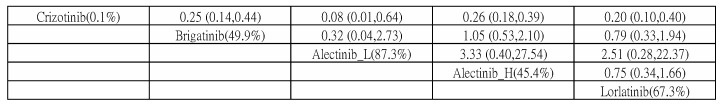
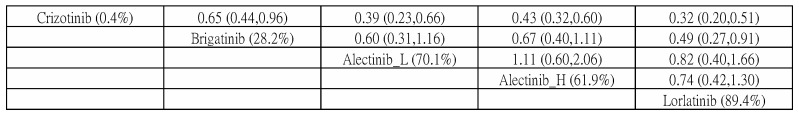
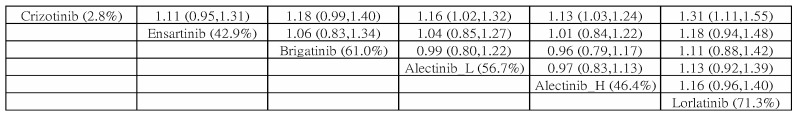
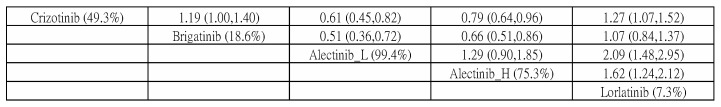
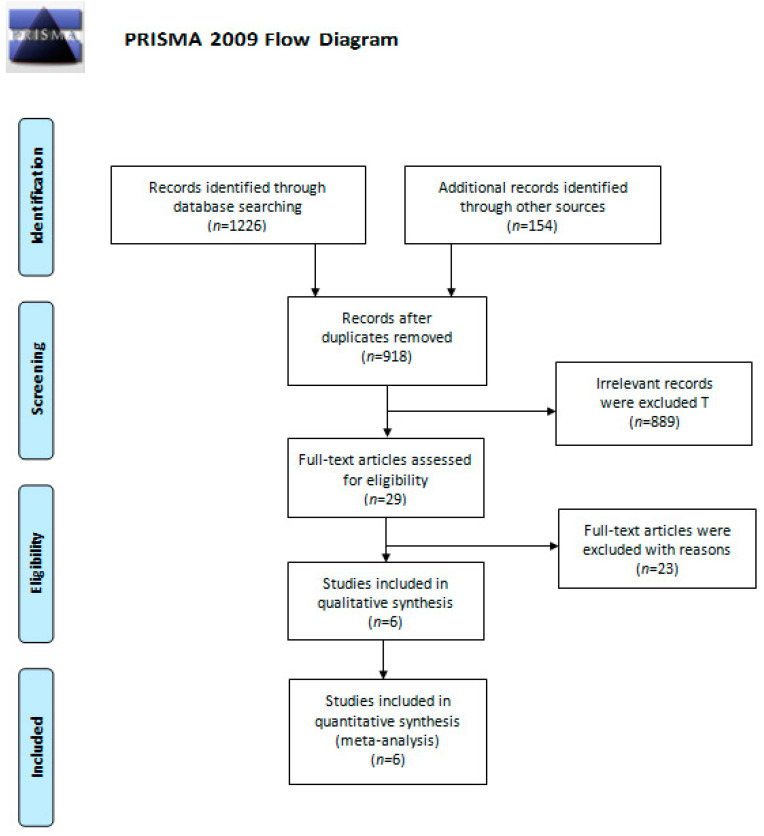
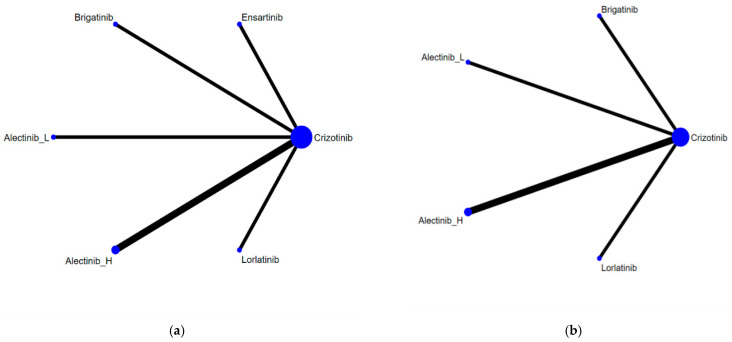
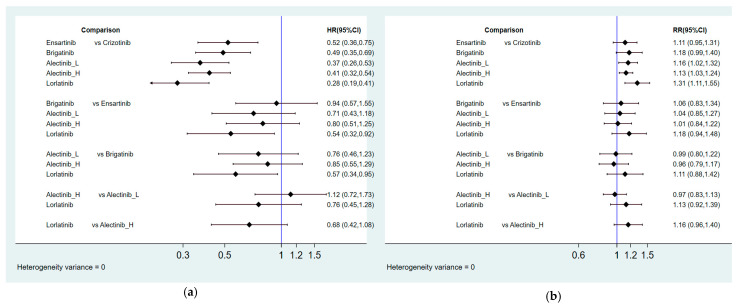
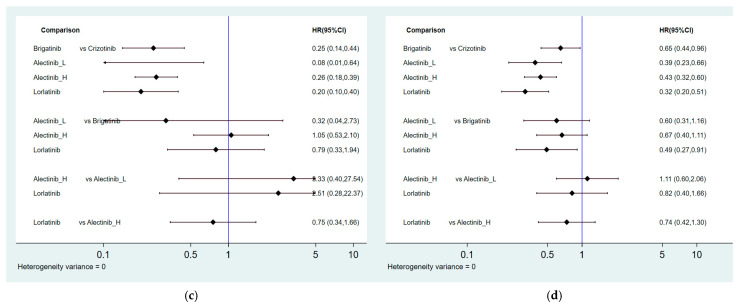
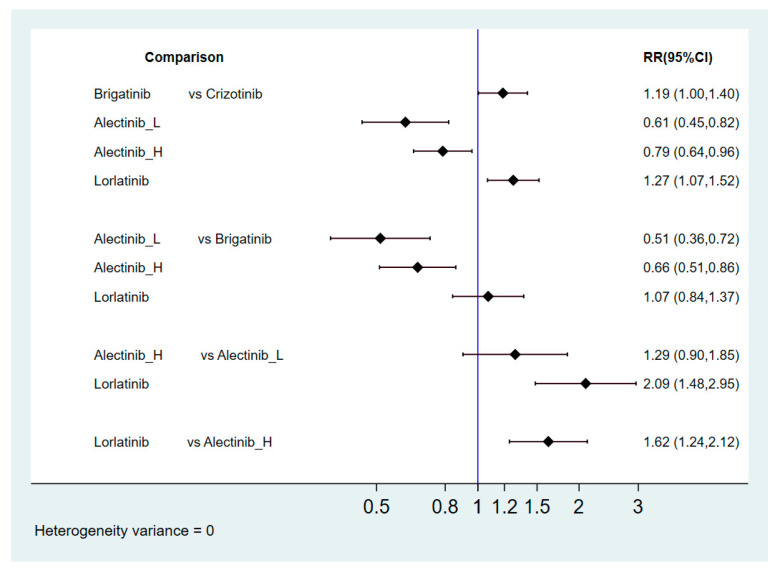
Several anaplastic lymphoma kinase inhibitors (ALKIs) have demonstrated excellent efficacy on overall survival (OS), progression-free survival (PFS), objective response rate (ORR), and also better adverse effect (AE) profiles compared to cytotoxic chemotherapy in advanced stage anaplastic lymphoma kinase (ALK) rearrangement-positive non-small cell lung cancer (NSCLC) in phase III randomized clinical trials (RCTs). We conducted this systematic review and network meta-analysis to provide a ranking of ALKIs for treatment-naïve ALK-positive patients in terms of PFS, ORR, and AEs. In addition, a sub-group analysis of treatment benefits in patients with baseline brain metastasis was also conducted. Contrast-based analysis was performed for multiple treatment comparisons with the restricted maximum likelihood approach. Treatment rank was estimated using the surface under the cumulative ranking curve (SUCRA), as well as the probability of being the best (Prbest) reference. All next-generation ALKIs were superior to crizotinib in PFS but lorlatinib and brigatinib had increased AEs. The probability of lorlatinib being ranked first among all treatment arms was highest (SUCRA = 93.3%, Prbest = 71.8%), although there were no significant differences in pairwise comparisons with high- (600 mg twice daily) and low- (300 mg twice daily) dose alectinib. In subgroup analysis of patients with baseline brain metastasis, low-dose alectinib had the best PFS (SUCRA = 87.3%, Prbest = 74.9%). Lorlatinib was associated with the best ranking for ORR (SUCRA = 90.3%, Prbest = 71.3%), although there were no significant differences in pairwise comparisons with the other ALKIs. In addition, low-dose alectinib had the best safety performance (SUCRA = 99.4%, Prbest = 97.9%). Lorlatinib and low-dose alectinib had the best PFS and ORR in the overall population and baseline brain metastasis subgroup, respectively. Low-dose alectinib had the lowest AE risk among the available ALKIs. Further head-to-head large-scale phase III RCTs are needed to verify our conclusions.

Keywords: ALK inhibitor; alectinib; brigatinib; ceritinib; crizotinib; ensartinib; lorlatinib; network meta-analysis.


Conflict of interest statement

The authors declare no conflict of interest.

Figures

Figure A1
Figure A1
Quality assessment using the Risk of Bias tool (ROB tool).
Figure A2
Figure A2
Forest plots and pooled effect sizes for efficacy and safety comparisons. (A) Forest plot and pooled hazard ratio for PFS; (C) Forest plot and pooled response ratio for ORR; (B) Forest plot and pooled risk ratio for grade 3–5 AEs.
Figure A3
Figure A3
Cumulative ranking probability for PFS and ORR. (A) Cumulative ranking probability for PFS; (B) Cumulative ranking probability for ORR; (C) Cumulative ranking probability for PFS among the patients with baseline brain metastasis; (D) Cumulative ranking probability for PFS among the patients without baseline brain metastasis.
Figure A4
Figure A4
Probability of being the best treatment with regards to PFS and ORR. (A) Probability of being the best treatment with regards to PFS; (B) Probability of being the best treatment with regards to ORR; (C) Probability of being the best treatment with regards to PFS among the patients with baseline brain metastasis; (D) Probability of being the best treatment with regards to PFS among the patients without baseline brain metastasis.
Figure A4
Figure A4
Probability of being the best treatment with regards to PFS and ORR. (A) Probability of being the best treatment with regards to PFS; (B) Probability of being the best treatment with regards to ORR; (C) Probability of being the best treatment with regards to PFS among the patients with baseline brain metastasis; (D) Probability of being the best treatment with regards to PFS among the patients without baseline brain metastasis.
Figure A5
Figure A5
Cumulative ranking probability for safety in grade 3–5 AEs.
Figure A6
Figure A6
Probability of being the best treatment with regards to safety.
Figure A7
Figure A7
Pairwise comparisons for PFS.
Figure A8
Figure A8
Pairwise comparisons for PFS among patients with baseline brain metastasis.
Figure A9
Figure A9
Pairwise comparisons for PFS among patients without baseline brain metastasis.
Figure A10
Figure A10
Overall response rate.
Figure A11
Figure A11
Grade 3–5 adverse events.
Figure 1
Figure 1
The PRIMSA flow diagram.
Figure 2
Figure 2
Network constructions for comparisons in PFS, ORR, and grade 3–5 AEs: (a) Network constructions for PFS and ORR; (b) Network constructions for PFS subgroup analysis and grade 3–5 AEs.
Figure 3
Figure 3
Summary of effect sizes for efficacy comparison: (a) Pairwise comparisons for PFS; (b) Pairwise comparisons for ORR; (c) Pairwise comparisons for PFS among patients with baseline brain metastasis; (d) Pairwise comparisons for PFS among patients without baseline brain metastasis.
Figure 3
Figure 3
Summary of effect sizes for efficacy comparison: (a) Pairwise comparisons for PFS; (b) Pairwise comparisons for ORR; (c) Pairwise comparisons for PFS among patients with baseline brain metastasis; (d) Pairwise comparisons for PFS among patients without baseline brain metastasis.
Figure 4
Figure 4
Risk ratio for safety comparisons in grade 3–5 AEs.

References

    1. Govindan R., Page N., Morgensztern D., Read W., Tierney R., Vlahiotis A., Spitznagel E.L., Piccirillo J. Changing epidemiology of small-cell lung cancer in the United States over the last 30 years: Analysis of the surveillance, epidemiologic, and end results database. J. Clin. Oncol. 2006;24:4539–4544. doi: 10.1200/JCO.2005.04.4859. - DOI - PubMed
    1. Travis W.D., Brambilla E., Riely G.J. New pathologic classification of lung cancer: Relevance for clinical practice and clinical trials. J. Clin. Oncol. 2013;31:992–1001. doi: 10.1200/JCO.2012.46.9270. - DOI - PubMed
    1. Herbst R.S., Morgensztern D., Boshoff C. The biology and management of non-small cell lung cancer. Nature. 2018;553:446–454. doi: 10.1038/nature25183. - DOI - PubMed
    1. Molina J.R., Yang P., Cassivi S.D., Schild S.E., Adjei A.A. Non-small cell lung cancer: Epidemiology, risk factors, treatment, and survivorship. Mayo Clin. Proc. 2008;83:584–594. doi: 10.1016/S0025-6196(11)60735-0. - DOI - PMC - PubMed
    1. Jemal A., Siegel R., Ward E., Hao Y., Xu J., Murray T., Thun M.J. Cancer statistics, 2008. CA Cancer J. Clin. 2008;58:71–96. doi: 10.3322/CA.2007.0010. - DOI - PubMed

LinkOut - more resources