. 2021 Apr 22;11(5):621.
doi: 10.3390/biom11050621.

Overcoming the Challenges of High Quality RNA Extraction from Core Needle Biopsy

Affiliations

Overcoming the Challenges of High Quality RNA Extraction from Core Needle Biopsy

Hanne Locy et al. Biomolecules. .

Abstract

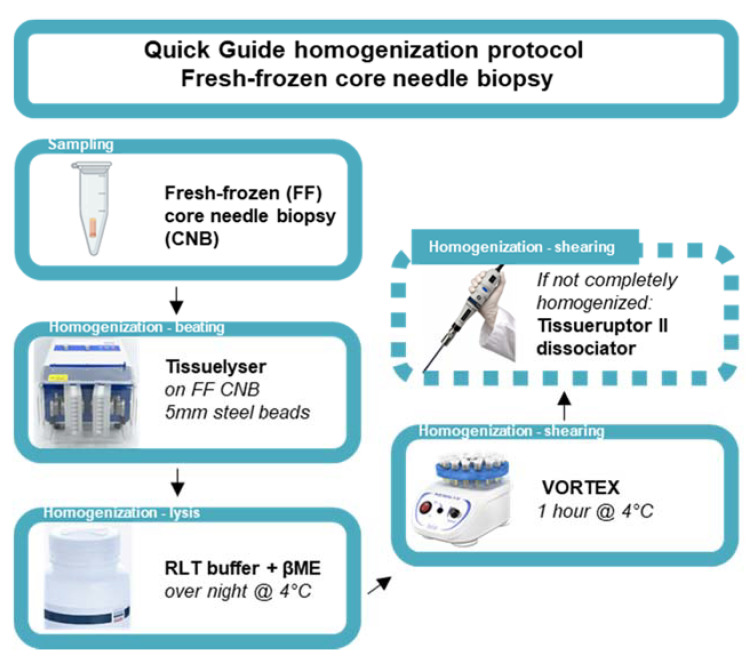
The use of gene expression profiling (GEP) in cancer management is rising, as GEP can be used for disease classification and diagnosis, tailoring treatment to underlying genetic determinants of pharmacological response, monitoring of therapy response, and prognosis. However, the reliability of GEP heavily depends on the input of RNA in sufficient quantity and quality. This highlights the need for standard procedures to ensure best practices for RNA extraction from often small tumor biopsies with variable tissue handling. We optimized an RNA extraction protocol from fresh-frozen (FF) core needle biopsies (CNB) from breast cancer patients and from formalin-fixed paraffin-embedded (FFPE) tissue when FF CNB did not yield sufficient RNA. Methods to avoid ribonucleases andto homogenize or to deparaffinize tissues and the impact of tissue composition on RNA extraction were studied. Additionally, RNA's compatibility with the nanoString nCounter® technology was studied. This technology platform enables GEP using small RNA fragments. After optimization of the protocol, RNA of high quality and sufficient quantity was obtained from FF CNB in 92% of samples. For the remaining 8% of cases, FFPE material prepared by the pathology department was used for RNA extraction. Both resulting RNA end products are compatible with the nanoString nCounter® technology.

Keywords: RNA; biopsy; breast cancer; formalin-fixed paraffin-embedded; fresh-frozen; gene expression.


Conflict of interest statement

The authors declare no conflict of interest. The funders had no role in the design of the study; in the collection, analyses, or interpretation of data; in the writing of the manuscript, or in the decision to publish the results.

Figures

Figure 1
Figure 1
Quick guide of the homogenization protocol of fresh-frozen core needle biopsies. Schematic representation of an optimized homogenization protocol starting from ultrasound guided sampling of FF, BC CNB. Homogenization entails the disruption of BC tissue using steel beads in the Tissuelyser instrument (beating method). Next, lysis is performed using Qiagen RNA lysis buffer (RLT buffer) containing βME, followed by a one-hour vortex step at 4 °C (shearing method). If the tumor tissue is not completely homogenized, an additional dissociation step can be included using the Tissueruptor II dissociator (shearing method).
Figure 2
Figure 2
Quick guide to the ribonuclease-free macrodissection of FFPE specimens. Schematic representation of ribonuclease-free macrodissection of FFPE core needle specimens starting with the renewal of gloves for handling every new FFPE specimen, deparaffinizing the microtome, mounting a new blade, and initiating RNase-free macrodissection with the subsequent treatment of the instrument, work area, and gloves with RNase-ZAP reagent, 1 mM NaOH, Milli-Q water, and 100% ethanol (EtOH).
Figure 3
Figure 3
Mechanical disruption of fresh-frozen core needle BC samples allows RNA extraction. (A) Graph summarizing variation of RNA yield expressed in ng by depicting the minimum value, first quartile (Q1), median, third quartile (Q3), and maximum value of RNA yield. Each sample for which RNA extraction was successful is depicted as a separate symbol. (B) Graph summarizing the variation of RNA yield per mg input by depicting the minimum value, first quartile (Q1), median, third quartile (Q3), and maximum value of RNA yield per mg input material (ng/mg). (C) Graph summarizing RNA purity by depicting the minimum value, Q1, median, Q3, and maximum value of A260/A280. (D,E) Graph summarizing the integrity of the obtained RNA by depicting the minimum value, Q1, median, Q3, and maximum of the RIN and DV200 values, respectively (n = 81).
Figure 4
Figure 4
Tissue composition of snap-frozen core needle biopsies affects RNA yield. (A) Graph summarizing the RNA yield (y-axis, µg) in function of the amount of input material (x-axis, mg) for all samples for which RNA was obtained (n = 81). The nonparametric Spearman correlation was calculated for samples for which RNA extraction was successful to evaluate the relationships between yield and input. The Spearman R was −0.048 with a two-tailed p-value of 0.617. (B) Graph summarizing the RNA yield per input (ng/mg) for all samples divided in the BC molecular subtypes; luminal A + B (n = 65), HER2+ (n = 2), and TNBC (n = 3). The Kruskal–Wallis test was applied to evaluate significance and a p-value of 0.936 was obtained. Each symbol represents an individual sample. (C) Graph summarizing the RNA yield per input (ng/mg) for all samples divided in the BC histological subtypes; invasive ductal BC (n = 60) and invasive lobular BC (n = 7). The Mann–Whitney test was performed to evaluate significance and a p-value of 0.062 was obtained. Each symbol represents an individual sample.
Figure 5
Figure 5
FFPE samples can serve as back-up starting material when RNA extraction from snap-frozen core needle biopsies fails. (A) Graph summarizing the RNA yield by depicting the minimum value, Q1, median, Q3, and maximum value of RNA yield from patients in which RNA extraction from FF BC CNB failed (n = 7). Each symbol represents an individual sample. (B) Graph summarizing RNA purity by depicting the minimum value, Q1, median, Q3, and maximum value of A260/A280. (C,D) Graph summarizing the integrity of the obtained RNA (n = 7) by depicting the RIN and DV200 values in function of archiving time (represented on the x-axis as months of storage at room temperature (RT)).
Figure 6
Figure 6
RNA derived from FF or FFPE BC core needle biopsies can be used in the nanoString nCounter® technology; however, they are best not combined for comparison of GEP. (A) Graph representing principal component analysis (PCA) with principle component (PC)1 on the x-axis indicating 46% variance and PC2 on the y-axis indicating 13% of variance. Independent BC samples are colored by sample type (FF samples in pink, FFPE samples in blue, n = 12). (B) Boxplots depicting variation of raw counts of FF (n = 6) and FFPE (n = 6) samples of all included genes (n = 770). The median value and upper and lower quartiles are represented. Whiskers were drawn according to the Tukey method. (C) Boxplots depicting normalized counts of FF (n = 6) and FFPE (n = 6) samples using the RUV methodology (RUVSeq package).

Similar articles

Cited by

References

    1. Haferlach T., Schmidts I. The power and potential of integrated diagnostics in acute myeloid leukaemia. Br. J. Haematol. 2019;188:36–48. doi: 10.1111/bjh.16360. - DOI - PMC - PubMed
    1. Cucchi D.G., Bachas C., Heuvel-Eibrink M.M.V.D., Arentsen-Peters S.T., Kwidama Z.J., Schuurhuis G.J., Assaraf Y.G., De Haas V., Kaspers G.J., Cloos J. Harnessing Gene Expression Profiles for the Identification of Ex Vivo Drug Response Genes in Pediatric Acute Myeloid Leukemia. Cancers. 2020;12:1247. doi: 10.3390/cancers12051247. - DOI - PMC - PubMed
    1. Wang J., Song J., Gao Z., Huo X., Zhang Y., Wang W., Qi J., Zheng S. Analysis of gene expression profiles of non-small cell lung cancer at different stages reveals significantly altered biological functions and candidate genes. Oncol. Rep. 2017;37:1736–1746. doi: 10.3892/or.2017.5380. - DOI - PubMed
    1. Chen Y., Yang X., Xu Y., Cao J., Chen L. Genomic analysis of drug resistant small cell lung cancer cell lines by combining mRNA and miRNA expression profiling. Oncol. Lett. 2017;13:4077–4084. doi: 10.3892/ol.2017.5967. - DOI - PMC - PubMed
    1. Apostolou P., Iliopoulos A.C., Parsonidis P., Papasotiriou I. Gene expression profiling as a potential predictor between normal and cancer samples in gastrointestinal carcinoma. [(accessed on 30 November 2020)];Oncotarget. 2019 10:3328–3338. doi: 10.18632/oncotarget.26913. Available online: http://www.ncbi.nlm.nih.gov/pubmed/31164955. - DOI - PMC - PubMed

Publication types

MeSH terms

LinkOut - more resources