. 2021 Apr 22;22(9):4387.
doi: 10.3390/ijms22094387.

Celecoxib as a Valuable Adjuvant in Cutaneous Melanoma Treated with Trametinib

Affiliations

Celecoxib as a Valuable Adjuvant in Cutaneous Melanoma Treated with Trametinib

Diana Valentina Tudor et al. Int J Mol Sci. .

Abstract

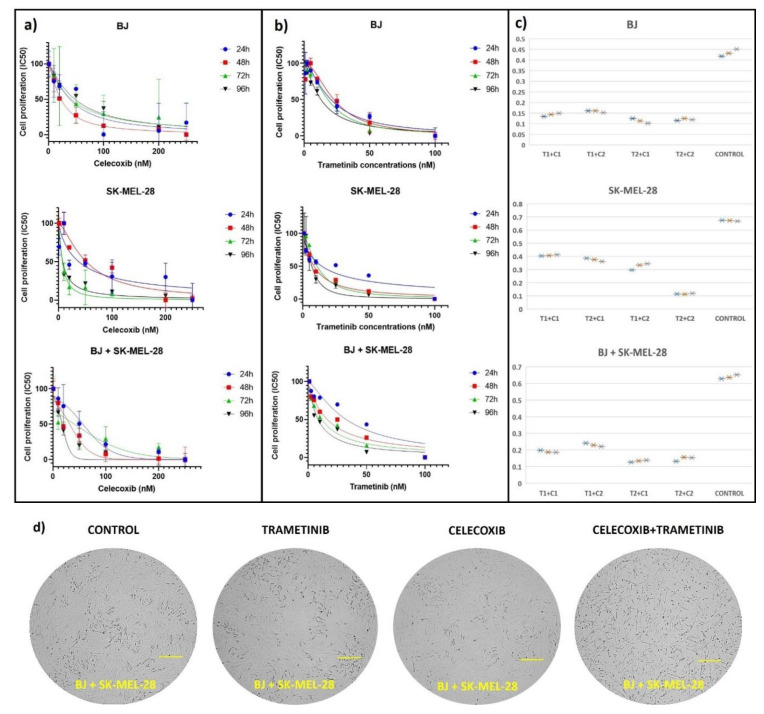
Background: Melanoma patients stop responding to targeted therapies mainly due to mitogen activated protein kinase (MAPK) pathway re-activation, phosphoinositide 3 kinase/the mechanistic target of rapamycin (PI3K/mTOR) pathway activation or stromal cell influence. The future of melanoma treatment lies in combinational approaches. To address this, our in vitro study evaluated if lower concentrations of Celecoxib (IC50 in nM range) could still preserve the chemopreventive effect on melanoma cells treated with trametinib.

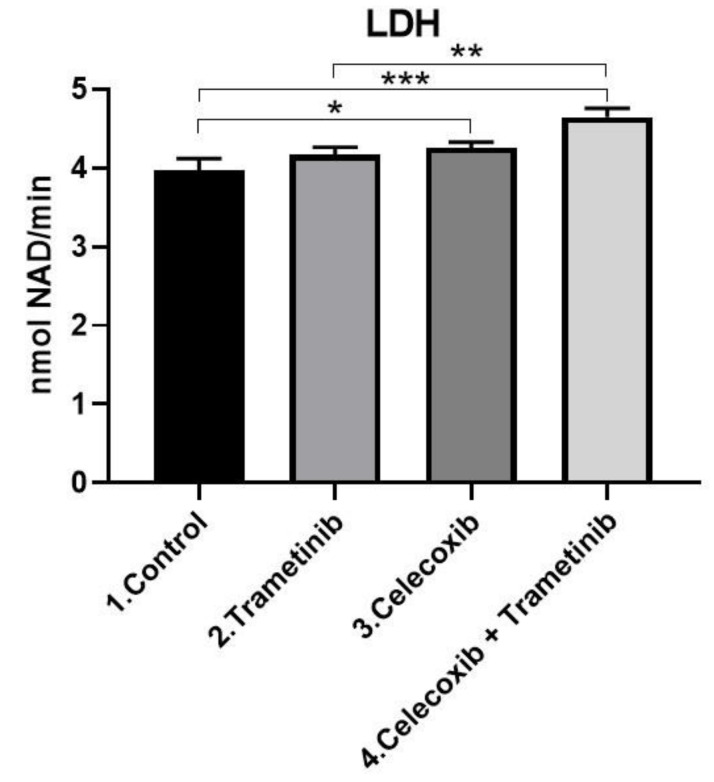
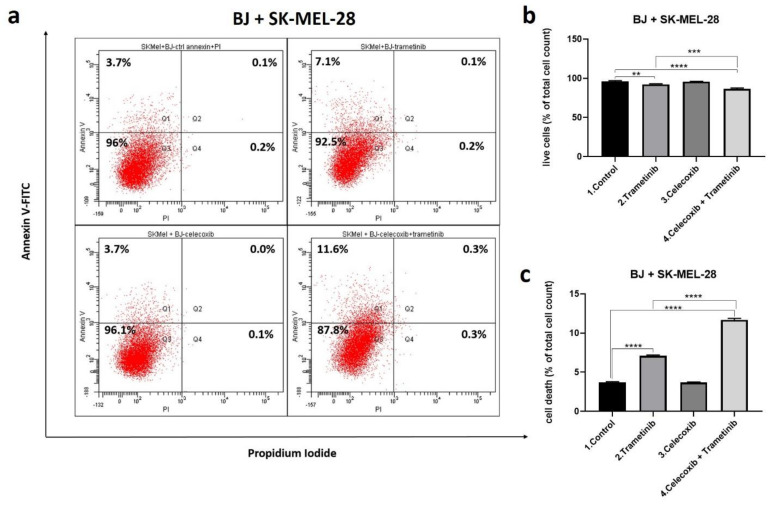
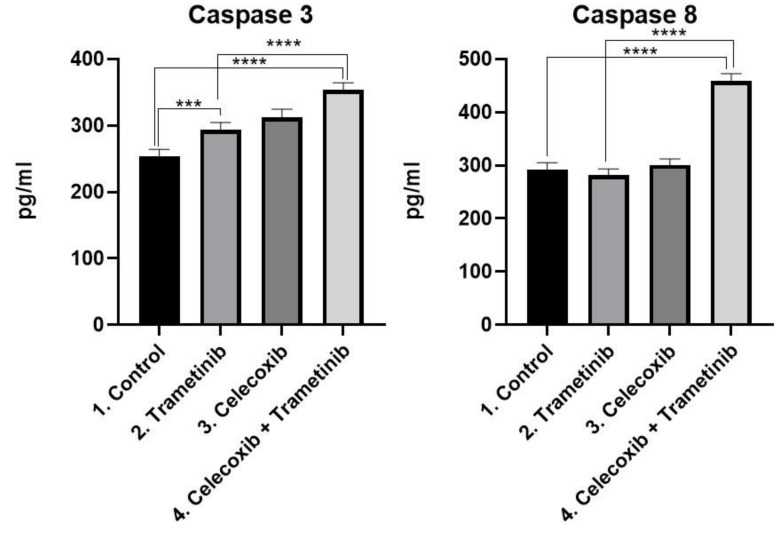
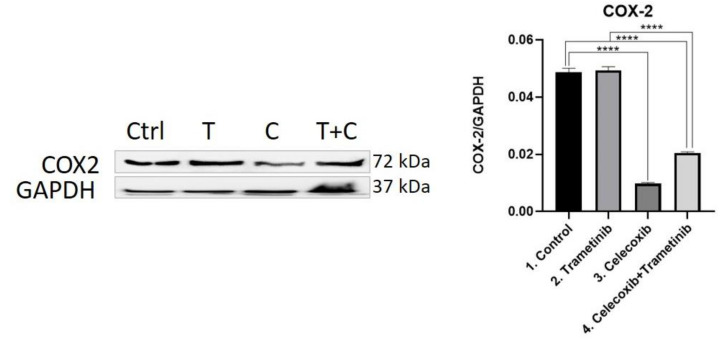
Materials and methods: All experiments were conducted on SK-MEL-28 human melanoma cells and BJ human fibroblasts, used as co-culture. Co-culture cells were subjected to a celecoxib and trametinib drug combination for 72 h. We focused on the evaluation of cell death mechanisms, melanogenesis, angiogenesis, inflammation and resistance pathways.

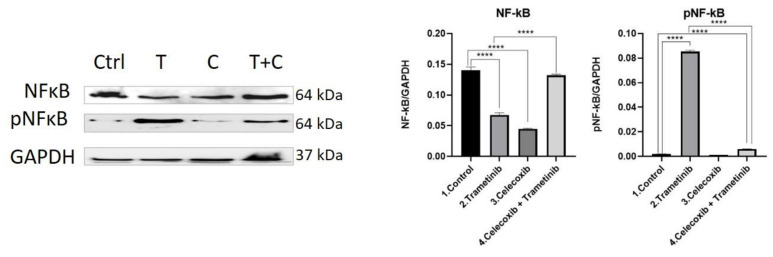
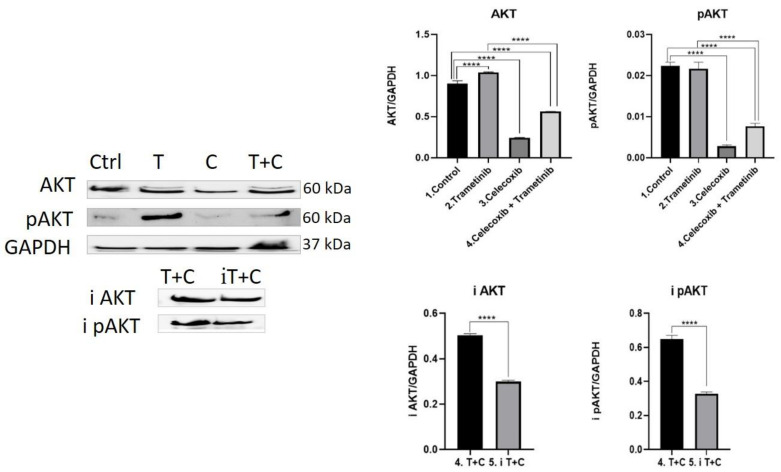
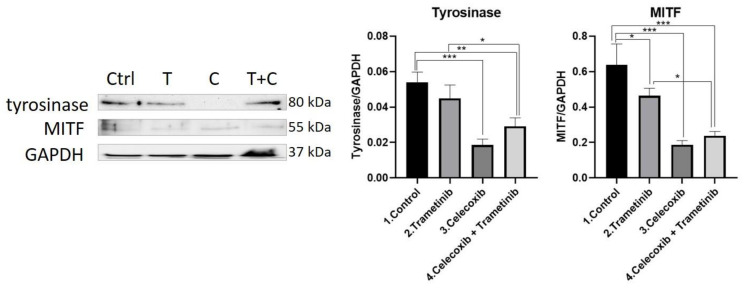
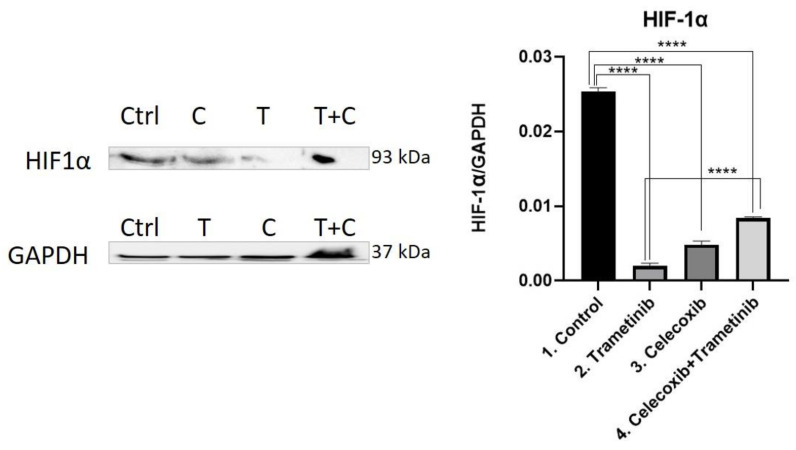
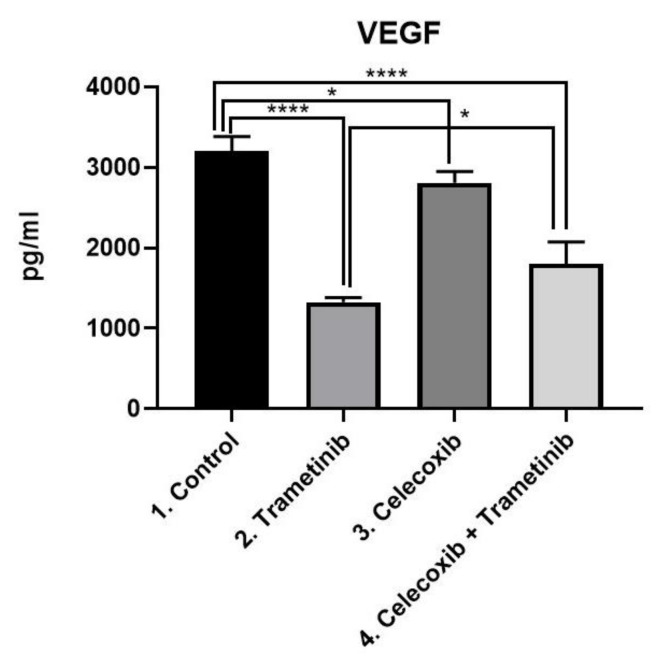
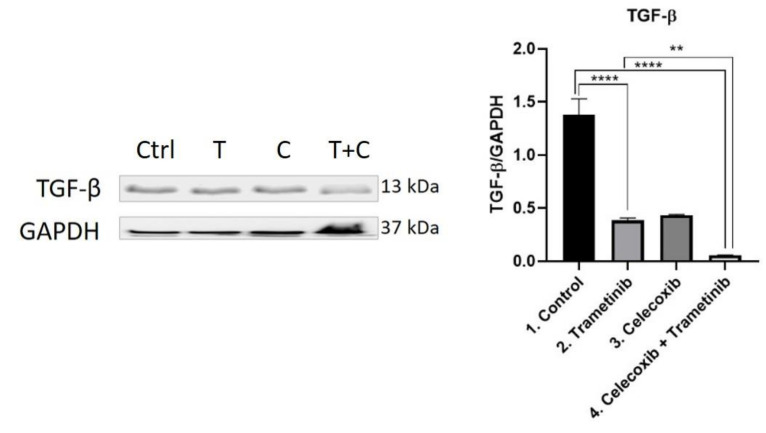
Results: Low-dose celecoxib significantly enhanced the melanoma response to trametinib. The therapeutic combination reduced nuclear transcription factor (NF)-kB (p < 0.0001) and caspase-8/caspase-3 activation (p < 0.0001), inhibited microphthalmia transcription factor (MITF) and tyrosinase (p < 0.05) expression and strongly down-regulated the phosphatidylinositol-3-kinase/protein kinase B (PI3K/AKT) signaling pathway more significantly than the control or trametinib group (p < 0.0001).

Conclusion: Low concentrations of celecoxib (IC50 in nM range) sufficed to exert antineoplastic capabilities and enhanced the therapeutic response of metastatic melanoma treated with trametinib.

Keywords: COX-2; celecoxib; inflammation; melanoma; trametinib.


Conflict of interest statement

No conflict of interest to declare.

Figures

Figure 1
Figure 1
Cell proliferation testing after exposure to celecoxib and trametinib. Each cell line, SK-MEL-28 and BJ cell cultures, as well as the co-cultured cells were exposed to different concentrations of celecoxib (for 24, 48, 72, 96 h) (a), trametinib (for 24, 48, 72, 96 h) (b) and to the celecoxib (C1 = 20 nM and C2 = 50 nM) and trametinib (T1 = 25 nM and T2 = 50 nM) drug combination for 72 h (c). Both (a,b) IC50 graphs were generated using GraphPad Software, nonlinear regression (curve fit) and illustrate mean values ± standard error of the mean (SEM), n = 3 for each sample. The third panel from both (a,b) graphs illustrates cell viability results after treating co-culture cells with celecoxib or trametinib separately. The suitable drug combination was chosen after analyzing cell viability after 72 h exposure to four different drug combinations via Excel–Box and Whisker. Each drug combination was testes in triplicate and was illustrated as asterix (*) after Tecan reading (c). Cell viability of the BJ + SK-MEL-28 co-culture diminished with increasing concentrations of celecoxib and trametinib, in a dose and time dependent manner. At the end of the protocol, following different exposure regiments, cells were observed in each group as shown in (d).
Figure 2
Figure 2
Cell membrane damage. Comparative analysis following T + C exposure compared with the control showed greater cytosolic LDH enzyme release in the last group (p < 0.001). LDH levels were even significantly higher than the group treated with celecoxib (p < 0.01). Quantitative results were expressed in nmol NAD+/min. * p < 0.05, *** p < 0.001 vs. control, untreated cells; ** p < 0.01 vs. trametinib. Each bar represents mean ± standard deviation (n = 3).
Figure 3
Figure 3
Cell death assessment after 72 h. Comparative FACS analysis following T + C treatment versus control in SK-MEL-28 and BJ fibroblasts co-culture cells; quantitative FACS results for BJ + SK-MEL-28 are expressed as % of total cell count-annexin V and PI positive cells, from the total cell number (a); viable cells (b) as well as early and late apoptosis (c) were statistically analyzed. Cell death induced by celecoxib group was not significant. Celecoxib used alone did not alter cell viability, while celecoxib added to trametinib enhanced apoptosis mediated cell death in the last group compared to control and trametinib group. ** p < 0.01, **** p < 0.0001 vs. control, untreated cells and *** p < 0.001, **** p < 0.0001 vs. trametinib group. Each bar represents mean ± standard deviation (n = 3).
Figure 4
Figure 4
ELISA analysis of caspase-3 and caspase-8 activation as markers for apoptosis. Protein levels of caspase-8 and caspase-3 (pg/mL) in BJ + SK-MEL-28 co-culture cells treated with T + C therapeutic combination for 72 h. *** p < 0.001, **** p < 0.0001 vs. control or untreated cells and **** p < 0.0001 vs. trametinib group. Each bar represents mean ± standard deviation (n = 3).
Figure 5
Figure 5
Western blot analysis of NF-kB and pNF-kB. Protein expression of NF-kB and pNF-kB in BJ+ SK-MEL-28 co-culture treated with trametinib (25 nM) and celecoxib (50 nM). WB bands were analyzed by densitometry and results were normalized to GAPDH. The left panel illustrates WB bands (Ctrl = control, T = trametinib, C = celecoxib, T + C = trametinib + celecoxib), while right panels illustrate the quantitative analysis of WB results (1 = control, 2 = trametinib, 3 = celecoxib, 4 = celecoxib + trametinib). **** p < 0.0001 vs. control cells; **** p < 0.0001 vs. trametinib group. Each bar represents mean ± standard deviation (n = 3).
Figure 6
Figure 6
Western blot analysis of AKT pathway activation. Protein expression pan AKT, pan pAKT, i AKT and i pAKT in co-culture cells treated with trametinib (25 nM) and celecoxib (50 nM). WB bands were analyzed by densitometry and results were normalized to GAPDH. The left panel illustrates WB bands (Ctrl = control, T = trametinib, C = celecoxib, T + C = trametinib + celecoxib), while right panels illustrate the quantitative analysis of WB results (1 = control, 2 = trametinib, 3 = celecoxib, 4 = celecoxib + trametinib, 5 = AKT pathway inhibitor + celecoxib + trametinib). **** p < 0.0001. Each bar represents mean ± standard deviation (n = 3).
Figure 7
Figure 7
Western blot analysis of tyrosinase and MITF. Protein expression of tyrosinase and MITF in the 2D melanoma model. WB bands were analyzed by densitometry and results were normalized to GAPDH. The left panel illustrates WB bands (Ctrl = control, T = trametinib, C = celecoxib, T + C = trametinib + celecoxib), while right panels illustrate the quantitative analysis of WB results (1 = control, 2 = trametinib, 3 = celecoxib, 4 = celecoxib + trametinib). * p < 0.05, ** p < 0.01, *** p < 0.001. Each bar represents mean ± standard deviation (n = 3).
Figure 8
Figure 8
Western blot analysis of COX-2. Protein expression of COX-2 in BJ + SK-MEL-28 co-culture cells. WB bands were analyzed by densitometry and results were normalized to GAPDH. The left panel illustrates WB bands (Ctrl = control, T = trametinib, C = celecoxib, T + C = trametinib + celecoxib), while right panels illustrate the quantitative analysis of WB results (1 = control, 2 = trametinib, 3 = celecoxib, 4 = celecoxib + trametinib). **** p < 0.0001. Each bar represents mean ± standard deviation (n = 3).
Figure 9
Figure 9
Western blot analysis of HIF-1α. Protein expression of HIF-1α in BJ + SK-MEL-28 co-culture cells. WB bands were analyzed by densitometry and results were normalized to GAPDH. The left panel illustrates WB bands (Ctrl = control, T = trametinib, C = celecoxib, T + C = trametinib + celecoxib), while right panels illustrate the quantitative analysis of WB results (1 = control, 2 = trametinib, 3 = celecoxib, 4 = celecoxib + trametinib). **** p < 0.0001. Each bar represents mean ± standard deviation (n = 3).
Figure 10
Figure 10
ELISA analysis of VEGF. Protein expression of VEGF (pg/mL) in SK-MEL-28 + BJ co-culture cells treated with T + C therapeutic combination for 72 h. * p < 0.05, **** p < 0.0001 vs. control, untreated cells and * p < 0.05 vs. trametinib group. Each bar represents mean ± standard deviation (n = 3).
Figure 11
Figure 11
Western blot analysis of TGF-β. Protein expression of TGF-β in BJ + SK-MEL-28 co-culture cells. WB bands were analyzed by densitometry and results were normalized to GAPDH. The left panel illustrates WB bands (Ctrl = control, T = trametinib, C = celecoxib, T + C = trametinib + celecoxib), while right panels illustrate the quantitative analysis of WB results (1 = control, 2 = trametinib, 3 = celecoxib, 4 = celecoxib + trametinib). ** p < 0.01, **** p < 0.0001. Each bar represents mean ± standard deviation (n = 3).

References

    1. Roesch A., Melanoma B.C. Braun-Falco’s Dermatology. Springer; Berlin/Heidelberg, Germany: 2020. pp. 1–7.
    1. Whiteman D.C., Green A.C., Olsen C.M. The growing burden of invasive melanoma: Projections of incidence rates and numbers of new cases in six susceptible populations through 2031. J. Investig. Dermatol. 2016;136:1161–1171. doi: 10.1016/j.jid.2016.01.035. - DOI - PubMed
    1. Leonardi G.C., Falzone L., Salemi R., Zanghì A., Spandidos D.A., Mccubrey J.A., Candido S., Libra M. Cutaneous melanoma: From pathogenesis to therapy. Int. J. Oncol. 2018;52:1071–1080. doi: 10.3892/ijo.2018.4287. - DOI - PMC - PubMed
    1. Fang S., Xu T., Xiong M., Zhou X., Wang Y., Haydu L.E., Ross M.I., Gershenwald J.E., Prieto V.G., Cormier J.N., et al. Role of immune response, inflammation and tumor immune response–related cytokines/chemokines in melanoma progression. J. Invest. Dermatol. 2019;139:2352–2358. doi: 10.1016/j.jid.2019.03.1158. - DOI - PMC - PubMed
    1. Schadendorf D., van Akkooi A.C., Berking C., Griewank K.G., Gutzmer R., Hauschild A., Stang A., Roesch A., Ugurel S. Melanoma. Lancet. 2018;392:971–984. doi: 10.1016/S0140-6736(18)31559-9. - DOI - PubMed

MeSH terms