. 2021 Apr 23;9(5):461.
doi: 10.3390/biomedicines9050461.

Ectopic FOXP3 Expression in Combination with TGF-β1 and IL-2 Stimulation Generates Limited Suppressive Function in Human Primary Activated Thymocytes Ex Vivo

Affiliations

Ectopic FOXP3 Expression in Combination with TGF-β1 and IL-2 Stimulation Generates Limited Suppressive Function in Human Primary Activated Thymocytes Ex Vivo

Jorge Gallego-Valle et al. Biomedicines. .

Abstract

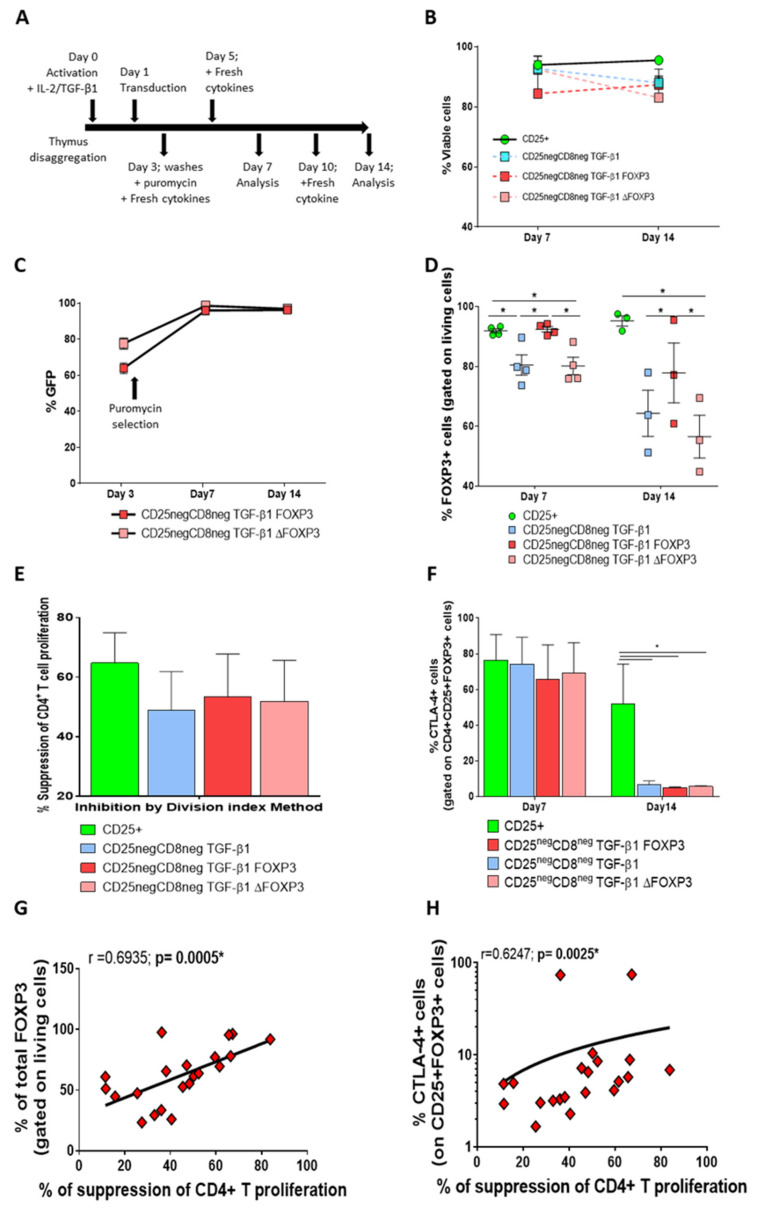
Regulatory T cells (Tregs), which are characterized by the expression of the transcription factor forkhead box P3 (FOXP3), are the main immune cells that induce tolerance and are regulators of immune homeostasis. Natural Treg cells (nTregs), described as CD4+CD25+FOXP3+, are generated in the thymus via activation and cytokine signaling. Transforming growth factor beta type 1 (TGF-β1) is pivotal to the generation of the nTreg lineage, its maintenance in the thymus, and to generating induced Treg cells (iTregs) in the periphery or in vitro arising from conventional T cells (Tconvs). Here, we tested whether TGF-β1 treatment, associated with interleukin-2 (IL-2) and CD3/CD28 stimulation, could generate functional Treg-like cells from human thymocytes in vitro, as it does from Tconvs. Additionally, we genetically manipulated the cells for ectopic FOXP3 expression, along with the TGF-β1 treatment. We demonstrated that TGF-β1 and ectopic FOXP3, combined with IL-2 and through CD3/CD28 activation, transformed human thymocytes into cells that expressed high levels of Treg-associated markers. However, these cells also presented a lack of homogeneous suppressive function and an unstable proinflammatory cytokine profile. Therefore, thymocyte-derived cells, activated with the same stimuli as Tconvs, were not an appropriate alternative for inducing cells with a Treg-like phenotype and function.

Keywords: FOXP3; engineering cells; human thymocytes; regulatory T cells.


Conflict of interest statement

The authors declare that they have no competing interest.

Figures

Figure 1
Figure 1
Viability and phenotype after cell isolation and throughout the cell culture. CD25+ and CD25-negative (CD25neg) fractions are the positive and negative fractions of CD25+ selection from the thymocytes. The viability and phenotype of each fraction were analyzed by flow cytometry. (A) Dot plots represent the percentage of viability, CD4/CD8 subsets, and CD25/FOXP3 surface labeling of each fraction on the day of cell isolation. Dot plots belong to one representative experiment from 14 samples. (CD4SP, CD4+ simple positive cells; CD8SP, CD8+ simple positive cells; and DP, CD4+/CD8+ double positive cells). (B) Evolution of average percentages of viable cells throughout 10 days of culture. (C) Fold expansion of the cells between Days 3 and 7 of culture. Each symbol corresponds to an individual. (D) Evolution of average percentages of cells with the CD25+FOXP3+ phenotype gated on living cells throughout 10 days of culture. (E) Evolution of the average percentages of the CD39 marker on CD25+FOXP3+ subset throughout 10 days of culture. (F) Evolution of the average percentages of the CTLA-4 marker on the CD25+FOXP3+ subset throughout 10 days of culture. The mean + SEM of 14 independent experiments in each condition is shown. * Significant difference when p < 0.05. A * above each point condition represents a significant difference for this condition against CD25+. A lateral * with connection lines represents significant differences between TGF-β1-treated and untreated conditions for each fraction.
Figure 2
Figure 2
Suppression of CellTrace Violet (CTVio) allogeneic PBMC proliferation by peripheral and thymus-derived cells. (A) Percentage of suppression of proliferation of CD4+ CTVio cells after co-culture with tCD25+ or peripheral CD25+ (nTregs) for 7 days, with different ratios of effector cells/CTVio cells. The percentage of suppression was calculated following the division index method. Each symbol corresponds to an individual. (B) Percentage of suppression of proliferation of CD4+ CTVio cells after co-culture with CD25+ and TGF-β1-treated CD25neg derived from the thymus or peripheral blood. Negative values correspond to an increase in proliferation. Each symbol corresponds to an individual. * represents a significant difference for the condition compared to CD25+, and ns means non-significant. (C) Correlation and linear regression (black line) between the percentage of suppression of CD4+ CTVio cells and percentage of CTLA-4 (on CD25neg and TGF-β1-treated CD25neg, gated on living cells). (D) Correlation and linear regression (black line) between the percentage of suppression of CD4+ CTVio cells and percentage of CD39+ cells (on CD25neg and TGF-β1-treated CD25neg, gated on living cells). Each symbol corresponds to an individual. Correlations were determined by Spearman’s rank correlation, and r is the Spearman correlation coefficient. * p < 0.05 was considered to be statistically significant.
Figure 3
Figure 3
Cell phenotype before and after the suppressive assay. After 7 days of culture, CD25+ and TGF-β1-treated CD25neg (effector cells) were co-cultured with CTVio allogenic PBMCs for 3 days, with an effector cell/CTVio cell ratio of 2:1. (A) The top panels show dot plots that represent the percentage of CD25/FOXP3 surface markers of each fraction on the day of the suppressive assay setup. The lower panels show dot plots that represent the gating strategy used after the suppressive assay, which mixed thymus-derived cells and CTVio cells. To analyze the thymus-derived cell surface markers, cells were gated on CTVio-negative cells. The dot plots are from a single representative experiment of 3–4 experiments. (B) Bar graph representing the frequency of CD25+FOXP3+ (left), CTLA-4+ (middle), and CD39+ (right) gated on living CTVio-negative cells before and after the suppressive assay throughout Day 3 of co-culture. Each symbol corresponds to an individual. And ns means non-significant.
Figure 4
Figure 4
Viability and functionality of the efficiently FOXP3-transduced thymocytes. (A) Schematic representation of the experimental protocol, from thymus disaggregation to Days 0–14. The arrows indicate the day and procedure performed at each step. (B) The percentage of viable cells for each condition was determined on Days 7 and 14 post-culture by flow cytometry (mean ± SEM of 3–4 independent experiments). (C) Analysis of frequencies of transduced cells by flow cytometry after transduction with a vector encoding FOXP3, green fluorescent protein (GFP), and puromycin sequences (mean ± SEM of four independent experiments). The arrow represents the moment of puromycin treatment. (D) Percentage of cells expressing intracellular FOXP3, gated on living cells, determined by flow cytometry on Days 7 and 14 post-culture (mean ± SEM of 3–4 independent experiments). (E) Percentage of suppression of CD4+ CTVio target cell proliferation, calculated by using the division index method (mean ± SEM of three independent experiments). (F) Bar graph of CTLA-4 expression on the CD4+CD25+FOXP3+ subset on Days 7 and 14 post-culture by flow cytometry (mean ± SEM of four independent experiments). * p < 0.05 was considered to be significant when comparing conditions. (G) Correlation between the frequency of suppression of CD4+ T CTVio cell proliferation and frequency of total FOXP3+ cells (gated on living cells). (H) Correlation between the frequency of suppression of the CD4+ T CTVio cell proliferation frequency of CTLA-4+ (gated on CD4+CD25+FOXP3+). Correlations were determined by Spearman’s rank correlation and considered to be statistically significant, * when p < 0.05. Each symbol corresponds to an individual.
Figure 5
Figure 5
Cytokine expression of thymus-derived cells after restimulation. On Day 7, the TGF-β1-treated CD25neg and CD25+ fractions were restimulated with anti-CD3/CD28 beads (NT) as the control condition or were restimulated with anti-CD3/CD28 beads under Th1- or Th17-polarizing conditions. (A) Frequencies of IFN-γ-producing cells, measured by flow cytometry. The mean + SEM of three independent experiments are shown. (B) IL-17 (pg/mL) levels from the supernatant were measured by ELISA. The mean + SEM of two independent experiments are shown. (C) Frequencies of IL-10-producing cells were measured by flow cytometry. The mean + SEM of three independent experiments are shown. (D) Percentages of CD25+FOXP3+ cells gated on living cells were measured by flow cytometry. The mean + SEM of three independent experiments are shown. * p < 0.05 was considered to be significant when comparing conditions. We also analyzed cytokine production in cells restimulated without a polarizing environment. (E) Example of the gating strategy for selecting cytokine-producing cells in the CD25negCD8neg fraction, according to the expression of FOXP3. Intracellular IL-2-, IL-10-, or IFN-γ-producing cells in FOXP3+ and FOXP3neg subsets were assessed by flow cytometry. (F) We then calculated the frequencies of cytokines detected in the total cells (FOXP3+ and FOXP3neg subsets) (mean ± SEM of 3–4 independent experiments). * p < 0.05 was considered to be significant when comparing conditions. (G) Correlations between frequencies of the CD25+FOXP3+ cells gated on living cells, as well as the frequency of IFN-γ-producing cells (left) and frequency of IL-10-producing cells (right), are represented. Correlations were determined by Spearman’s rank correlation and considered statistically significant when p < 0.05. Each symbol corresponds to an individual.

References

    1. Sakaguchi S., Ono M., Setoguchi R., Yagi H., Hori S., Fehervari Z., Shimizu J., Takahashi T., Nomura T. Foxp3+ CD25+ CD4+ natural regulatory T cells in dominant self-tolerance and autoimmune disease. Immunol. Rev. 2006;212:8–27. doi: 10.1111/j.0105-2896.2006.00427.x. - DOI - PubMed
    1. Taams L.S., Palmer D.B., Akbar A.N., Robinson D.S., Brown Z., Hawrylowicz C.M. Regulatory T cells in human disease and their potential for therapeutic manipulation. Immunology. 2006;118:1–9. doi: 10.1111/j.1365-2567.2006.02348.x. - DOI - PMC - PubMed
    1. Canavan J.B., Scottà C., Vossenkämper A., Goldberg R., Elder M.J., Shoval I., Marks E., Stolarczyk E., Lo J.W., Powell N., et al. Developing in vitro expanded CD45RA+ regulatory T cells as an adoptive cell therapy for Crohn’s disease. Gut. 2016;65:584–594. doi: 10.1136/gutjnl-2014-306919. - DOI - PMC - PubMed
    1. Marek-Trzonkowska N., Mysliwiec M., Dobyszuk A., Grabowska M., Techmanska I., Juscinska J., Wujtewicz M.A., Witkowski P., Mlynarski W., Balcerska A., et al. Administration of CD4+CD25highCD127- regulatory T cells preserves β-cell function in type 1 diabetes in children. Diabetes Care. 2012;35:1817–1820. doi: 10.2337/dc12-0038. - DOI - PMC - PubMed
    1. Bluestone J.A., Buckner J.H., Fitch M., Gitelman S.E., Gupta S., Hellerstein M.K., Herold K.C., Lares A., Lee M.R., Li K., et al. Type 1 diabetes immunotherapy using polyclonal regulatory T cells. Sci. Transl. Med. 2015;7 doi: 10.1126/scitranslmed.aad4134. - DOI - PMC - PubMed