. 2021 Apr 23;13(9):2044.
doi: 10.3390/cancers13092044.

Multiregional Sequencing of IDH-WT Glioblastoma Reveals High Genetic Heterogeneity and a Dynamic Evolutionary History

Affiliations

Multiregional Sequencing of IDH-WT Glioblastoma Reveals High Genetic Heterogeneity and a Dynamic Evolutionary History

Sara Franceschi et al. Cancers (Basel). .

Abstract

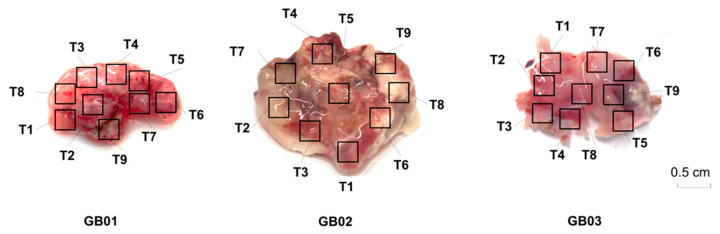
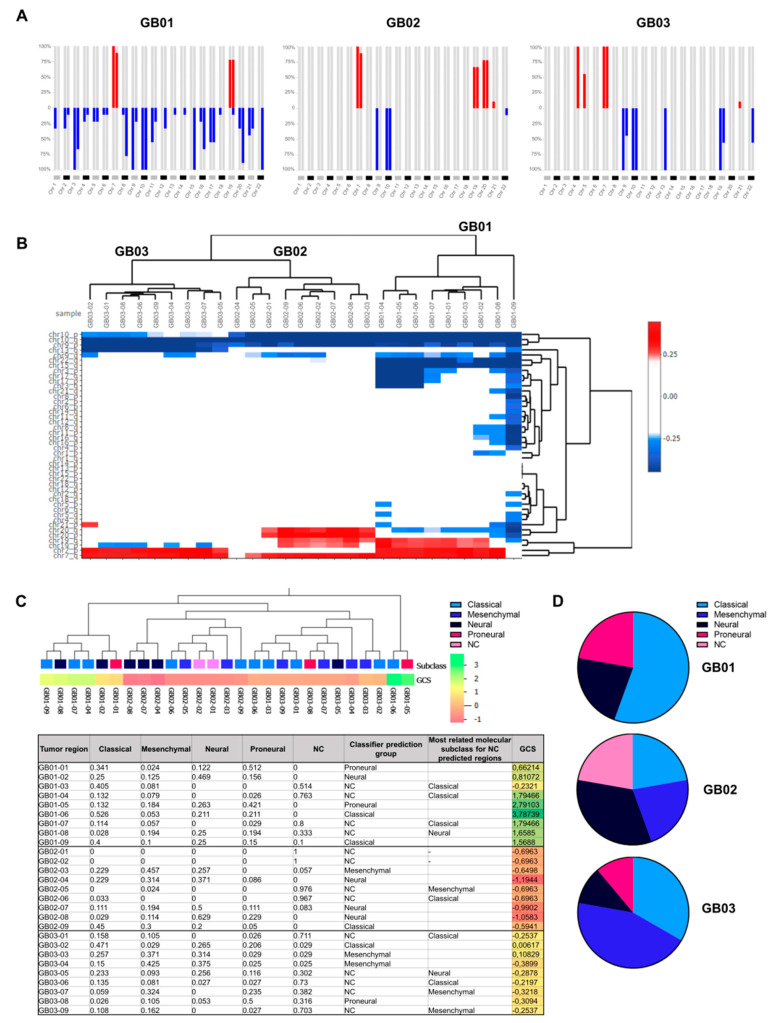
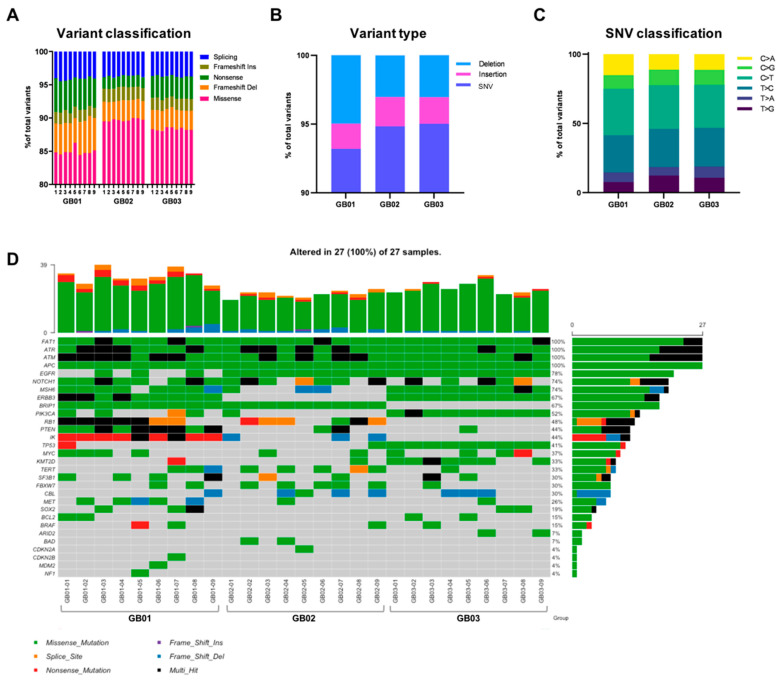
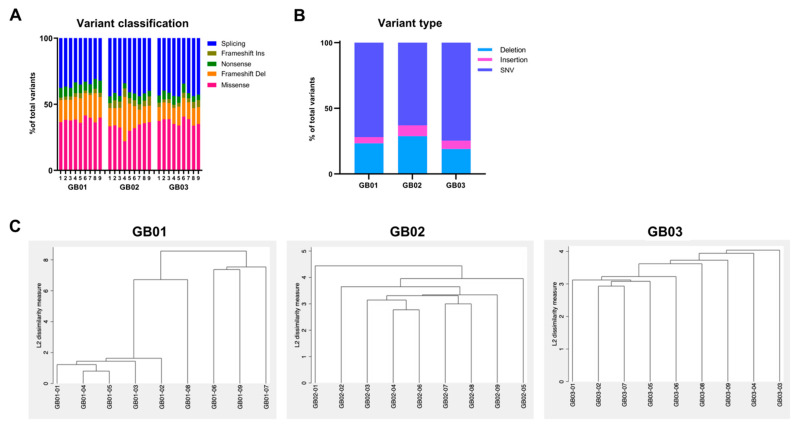
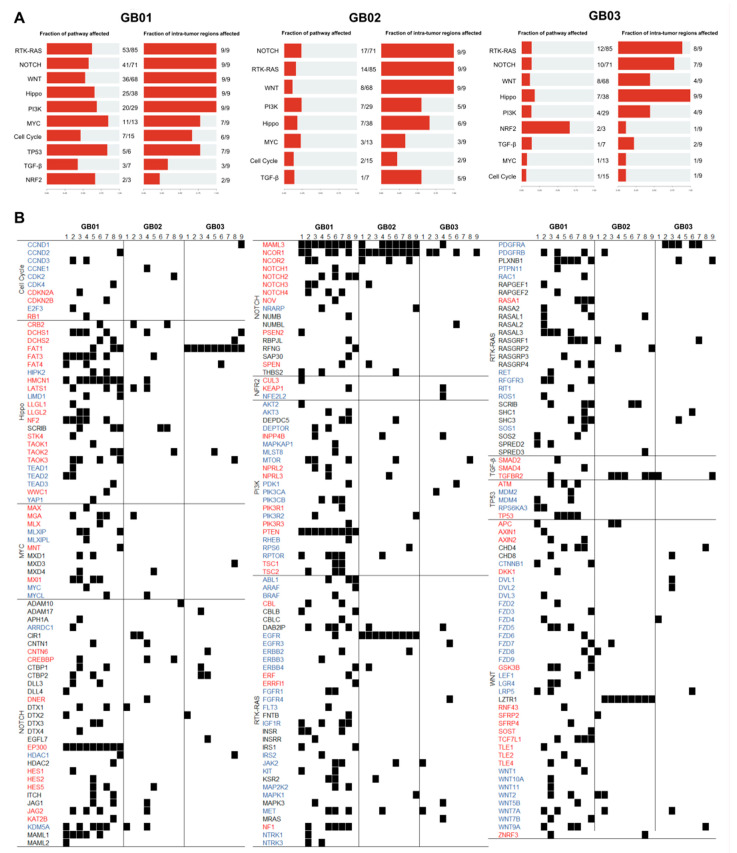
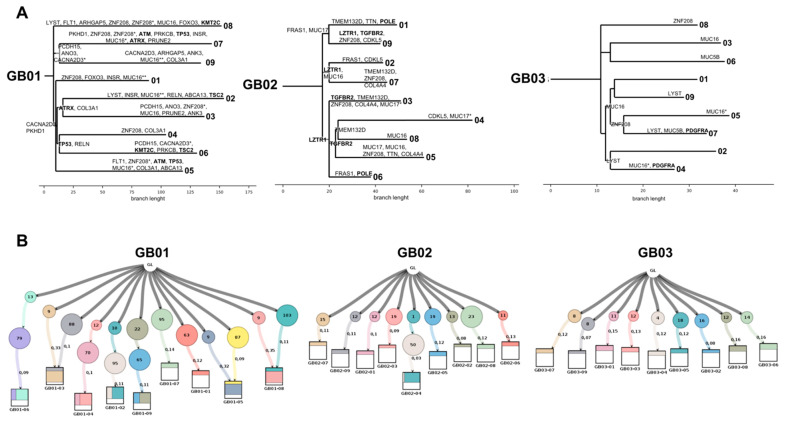
Glioblastoma is one of the most common and lethal primary neoplasms of the brain. Patient survival has not improved significantly over the past three decades and the patient median survival is just over one year. Tumor heterogeneity is thought to be a major determinant of therapeutic failure and a major reason for poor overall survival. This work aims to comprehensively define intra- and inter-tumor heterogeneity by mapping the genomic and mutational landscape of multiple areas of three primary IDH wild-type (IDH-WT) glioblastomas. Using whole exome sequencing, we explored how copy number variation, chromosomal and single loci amplifications/deletions, and mutational burden are spatially distributed across nine different tumor regions. The results show that all tumors exhibit a different signature despite the same diagnosis. Above all, a high inter-tumor heterogeneity emerges. The evolutionary dynamics of all identified mutations within each region underline the questionable value of a single biopsy and thus the therapeutic approach for the patient. Multiregional collection and subsequent sequencing are essential to try to address the clinical challenge of precision medicine. Especially in glioblastoma, this approach could provide powerful support to pathologists and oncologists in evaluating the diagnosis and defining the best treatment option.

Keywords: clonal evolution; glioblastoma; multiregional sequencing; spatial heterogeneity; temporal heterogeneity; tumor phylogeny; tumor progression.


Conflict of interest statement

The authors declare no conflict of interest.

Figures

Figure 1
Figure 1
Multiregional sampling performed on resected tumors. Nine spatially separated regions of approximately 3 mm3 were collected from each primary tumor.
Figure 2
Figure 2
Copy number variation (CNV) analysis and molecular subtype correlation. (A) CNApp frequencies for the p and q arms of each chromosome. Alteration frequency is expressed as the percentage of altered regions out of the total of 9 regions within each tumor (red for gains and blue for losses). (B) Hierarchical clustering of copy number variations of chromosomal regions (p and q arms). Hierarchical cluster analysis according to Pearson’s correlation of the three GB samples subdivided into their intra-tumoral regions. (C) Correlation with the four molecular subtypes and hierarchical clustering using the random forests algorithm. The CNApp classifier model was applied to our three GBs and 480 GBs derived from the TCGA-GBM data collection with molecular subclass annotation. Tumor regions in our 3 GBs were included in the classifier as “not classified” (NC) and correlation was performed using the global score (GCS) that CNApp assigns during resegmentation, by which it classifies and weights CNVs based on their length and width. The values in the table are the correlation coefficients that each region has with each of the four molecular subclasses and with the NC class. The “Classifier prediction group” column reports the molecular subtype that the system has correlated and predicted. The “Most related molecular subclass for NC predicted regions” column reports the best correlation found with one of the four molecular subclasses when the tumor region was associated with NC by the classifier. (D) Pie chart of the molecular composition of each tumor. Each tumor is composed of several molecular subclasses, each associated with an intra-tumoral region.
Figure 3
Figure 3
Mutation spectrum in GB. (A) Percentage of variant classification, plotted as a percentage of the total number of variants detected. (B) Percentage of mutation type, plotted as a percentage of the total number of variants detected. (C) Percentage of single-nucleotide variant (SNV) classification, plotted as a percentage of the total number of SNVs detected. (D) Oncoplot of the distribution of mutations found in our samples in the most frequently mutated genes in GB. Each column represents one sample (9 regions per tumor) and each row a different gene. Colored squares show mutated genes, while empty (gray) squares show no mutated genes. The different types of mutations are colored according to the type of variant: orange, splice site mutation; blue, frameshift deletion; green, missense mutation; red, nonsense mutation; and black, multi-hit mutation. Genes annotated as “multi-hit” have more than one type of mutation in the same region. The bar graph on the right shows the total number and percentage of mutated regions for each gene, out of the total 27 regions, colored according to mutation type. The upper graph shows the total number and type (different color) of mutations for each tumor region.
Figure 4
Figure 4
Rare variants. (A) Proportion of variant classification, plotted as the percentage of the total number of detected rare variants. (B) Proportion of mutation type, plotted as the percentage of the total number of detected rare variants. (C) Dendrograms of hierarchical cluster analysis of rare mutations of tumor regions. Dendrograms graphically present the information concerning which tumor regions are grouped together at various levels of (dis)similarity. At the bottom of the dendrogram, each tumor region is considered its own cluster. The height of the vertical lines and the range of the (dis)similarity axis give visual clues about the strength of the clustering. Long vertical lines indicate more distinct separation between the groups. Long vertical lines at the top of the dendrogram indicate that the groups represented by those lines are well separated from one another. Shorter lines indicate groups that are not as distinct.
Figure 5
Figure 5
Oncogenic pathways. (A) Pathway alteration frequencies. Fraction of mutated genes for each pathway and fraction of tumor regions with mutated genes for that pathway. (B) Detail of mutated genes in their respective altered pathways for each of the 27 tumor regions. Black square indicates the presence of a rare mutation. Tumor-suppressor genes are in red and oncogenes are in blue.
Figure 6
Figure 6
Tumor phylogeny and clonal evolution. (A) Phylogenetic trees. For each sample, a rooted tree was created whose leaf nodes are tumor regions. The length of the branches is equal to the number of mutations. Genes annotated on the tree are those with which the system has distinguished (through the absence or presence of specific mutations) and divided the different leaf branches representing the 9 tumor portions. Genes in bold are driver genes. (B) Clonal evolution lineage tree and sample composition. The lineage tree was built based on the constraint network using Lineage Inference for Cancer Heterogeneity and Evolution (LICHeE). Each node (circle) represents a subpopulation of GB cells. All nodes arose from a single hypothetical clone called Germline (GL), representing the genetic architecture of normal tissue from the same patient. Numbers within the circles indicate the number of nucleotide variants shared by the cluster; numbers outside the circles show the average variant allele frequency (VAF) of the variants in each cluster. Squares represent each individual tumor region, with colored rectangles indicating the cell fraction represented by the clonal cluster.

References

    1. Gallaher J.A., Massey S.C., Hawkins-Daarud A., Noticewala S.S., Rockne R.C., Johnston S.K., Gonzalez-Cuyar L., Juliano J., Gil O., Swanson K.R., et al. From cells to tissue: How cell scale heterogeneity impacts glioblastoma growth and treatment response. PLoS Comput. Biol. 2020;16:e1007672. doi: 10.1371/journal.pcbi.1007672. - DOI - PMC - PubMed
    1. Mahlokozera T., Vellimana A.K., Li T., Mao D.D., Zohny Z.S., Kim D.H., Tran D.D., Marcus D.S., Fouke S.J., Campian J.L., et al. Biological and therapeutic implications of multisector sequencing in newly diagnosed glioblastoma. Neuro Oncol. 2018;20:472–483. doi: 10.1093/neuonc/nox232. - DOI - PMC - PubMed
    1. Sottoriva A., Spiteri I., Piccirillo S.G.M., Touloumis A., Collins V.P., Marioni J.C., Curtis C., Watts C., Tavaré S. Intratumor heterogeneity in human glioblastoma reflects cancer evolutionary dynamics. Proc. Natl. Acad. Sci. USA. 2013;110:4009–4014. doi: 10.1073/pnas.1219747110. - DOI - PMC - PubMed
    1. Stupp R., Mason W.P., van den Bent M.J., Weller M., Fisher B., Taphoorn M.J.B., Belanger K., Brandes A.A., Marosi C., Bogdahn U., et al. Radiotherapy plus Concomitant and Adjuvant Temozolomide for Glioblastoma. N. Engl. J. Med. 2005;352:987–996. doi: 10.1056/NEJMoa043330. - DOI - PubMed
    1. Weller M., van den Bent M., Tonn J.C., Stupp R., Preusser M., Cohen-Jonathan-Moyal E., Henriksson R., Le Rhun E., Balana C., Chinot O., et al. European Association for Neuro-Oncology (EANO) guideline on the diagnosis and treatment of adult astrocytic and oligodendroglial gliomas. Lancet Oncol. 2017;18:e315–e329. doi: 10.1016/S1470-2045(17)30194-8. - DOI - PubMed

LinkOut - more resources