. 2021 Apr 25;13(9):2064.
doi: 10.3390/cancers13092064.

Modeling Hepatocellular Carcinoma Cells Dynamics by Serological and Imaging Biomarkers to Explain the Different Responses to Sorafenib and Regorafenib

Affiliations

Modeling Hepatocellular Carcinoma Cells Dynamics by Serological and Imaging Biomarkers to Explain the Different Responses to Sorafenib and Regorafenib

Piero Colombatto et al. Cancers (Basel). .

Abstract

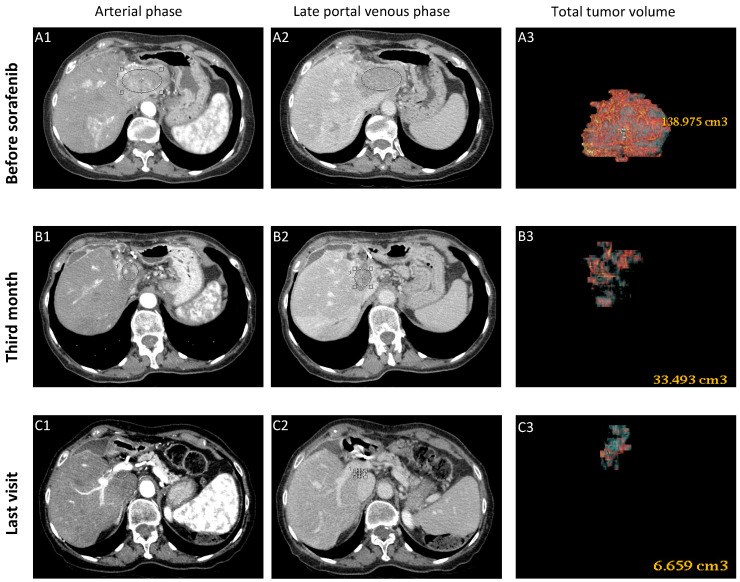
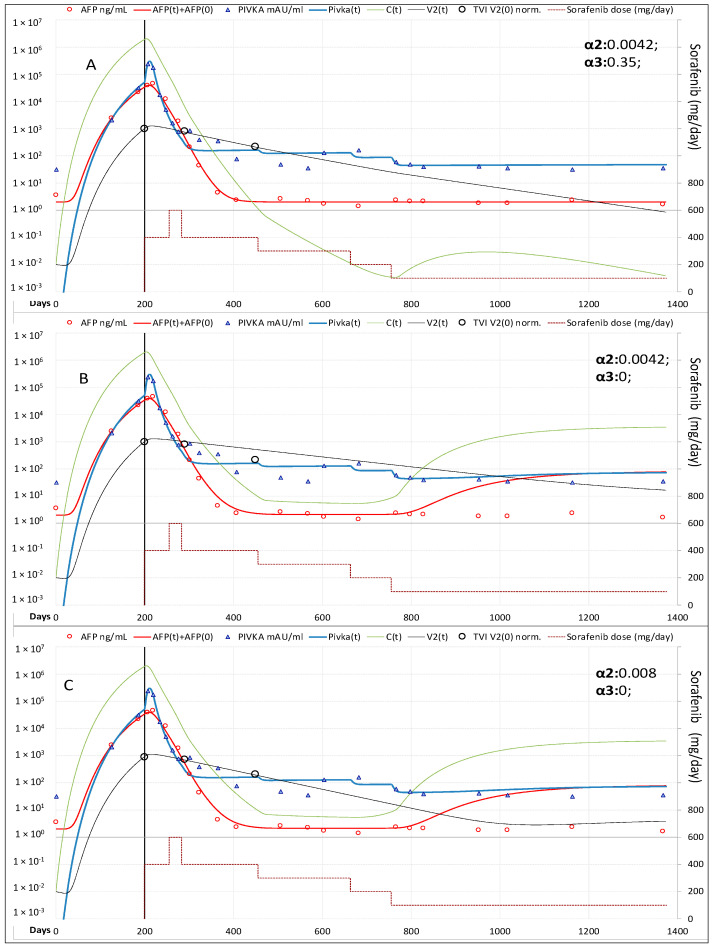
In advanced HCC, tyrosine-kinase inhibitors obtain partial responses (PR) in some patients and complete responses (CR) in a few. Better understanding of the mechanism of response could be achieved by the radiomic approach combining digital imaging and serological biomarkers (α-fetoprotein, AFP and protein induced by vitamin K absence-II, PIVKA-II) kinetics. A physic-mathematical model was developed to investigate cancer cells and vasculature dynamics in three prototype patients receiving sorafenib and/or regorafenib and applied in seven others for validation. Overall four patients showed CR, two PR, two stable-disease (SD) and two progressive-disease (PD). The rate constant of cancer cells production was higher in PD than in PR-SD and CR (median: 0.398 vs. 0.325 vs. 0.316 C × day-1). Therapy induced reduction of neo-angiogenesis was greater in CR than in PR-SD and PD (median: 83.2% vs. 29.4% and 2.0%), as the reduction of cell-proliferation (55.2% vs. 7.6% and 0.7%). An additional dose-dependent acceleration of tumor vasculature decay was also observed in CR. AFP and cancer cells followed the same kinetics, whereas PIVKA-II time/dose dependent fluctuations were influenced also by tissue ischemia. In conclusion, pending confirmation in a larger HCC cohort, modeling serological and imaging biomarkers could be a new tool for systemic therapy personalization.

Keywords: AFP; HCC; PIVKA-II; digital imaging; hepatocellular carcinoma; kinetics; mathematical modeling; regorafenib; sorafenib.


Conflict of interest statement

P.C. has served as an advisory board member for Intercept, Gilead and AbbVie, F.B. has served as a speaker for Gilead and Roche; M.R.B. has served as a speaker for AbbVie, Eisai, Gilead, Janssen, MSD and as an advisory board member for Abbott, AbbVie, Gilead, Janssen, Roche and Biotest. All other authors have no conflicts of interest to declare. The funders had no role in the design of the study; in the collection, analyses, or interpretation of data; in the writing of the manuscript, or in the decision to publish the results.

Figures

Figure 1
Figure 1
Baseline CT scan (A1,A2) showing the large HCC mass (maximum diameter 75 mm) in the left liver lobe with contrast enhancement in the arterial phase and wash-out in the late portal phase with vascular invasion. Follow-up CT scans demonstrated the markedly reduced sized necrotic lesion (maximum diameter 32 mm) at the third month of therapy (B1,B2) that remains barely noticeable (maximum diameter 18 mm) at the last visit (C1,C2), with no contrast enhancement in both phases. Total tumor volume (TTV) declined from 138.9 cm3 (A3) to 33.4 cm3 (B3) in 3 months, and to 6.6 cm3 at the last visit (C3) after 48 months from the beginning of therapy.
Figure 2
Figure 2
Model fitting of measured variables in Case-1. (A) Best fitting of Tumor Vascular Index (TVI), AFP and PIVKA-II serum levels. (B) In absence of the additional dose dependent decay constant of tumor vasculature, the model predicts recurrence of HCC when sorafenib dose is reduced to 200 mg every other day. (C) Halving the mean lifetime of tumor vascularization the model still predicts tumor recurrence. Legend: AFP = measured AFP; AFP(t) = model computed AFP; AFP(0) = AFP normal value; PIVKA-II = measured PIVKA-II; Pivka(t) = computed PIVKA-II; C(t) = model computed cancer cells; V2(t) = model computed vascularization index; TVI V2(0) norm = CT measured tumor vascular index normalized to V2 at treatment baseline.
Figure 3
Figure 3
Baseline MRI (A1,A2) showing a widespread hypo-vascular HCC in liver segment IV, with complete thrombosis of the portal branch for the VII–VI liver segments. A partial response after 3 months of sorafenib therapy was documented by CT scans (B1,B2), which has been progressively lost, as shown at the last CT scan performed after 20 months of therapy (C1,C2).
Figure 4
Figure 4
Best fitting of AFP and PIVKA-II serum levels in Case-2. AFP and PIVKA-II levels showed fluctuations correlated to C(t) and to the dose of sorafenib. Legend: AFP = measured AFP; AFP(t) = model computed AFP; AFP(0) = AFP normal value; PIVKA-II = measured PIVKA-II; Pivka(t) = computed PIVKA-II; C(t) = model computed cancer cells; V2(t) = model computed vascularization index.
Figure 5
Figure 5
Baseline CT scan (A1,A2) showing the hypo-vascular nodule of HCC of 65 × 45 mm involving segment V-VII-VIII with satellites and thrombosis of the right portal branch. A slow partial response to regorafenib therapy was documented after 3 months (B1,B2), which still continues after 12 months of therapy (C1,C2), as confirmed by the progressive reduction of the tumor volume (A3C3).
Figure 6
Figure 6
Model fitting of measured variables in Case-3 (A) Best fitting of AFP and PIVKA-II serum levels. AFP decline well correlated to C(t) decline, whereas PIVKA-II levels showed more complex kinetics, which appear influenced by the schedule of regorafenib treatment. The increase of PIVKA-II production observed in the first 3 months was fitted including in the model the potential effect of ischemia induced by the drug on cancer cells [Pivka(t) Sp]. The later PIVKA-II behavior, characterized by rapid fluctuations, was strongly influenced by the treatment schedule; this behavior could be explained considering that regorafenib may also exerted anti-vascular/toxic effects on non-tumor liver cells, that led to the production of a certain amount of PIVKA-II [Pivka(t) Tox]. (B) Best fitting of AFP and PIVKA-II obtained without including Pivka(t) Sp. (C) Best fitting of AFP and PIVKA-II obtained without including both Pivka(t) Sp and Pivka(t) Tox. Legend: AFP = measured AFP; AFP(t) = model computed AFP; AFP(0) = AFP normal value; PIVKA-II = measured PIVKA-II; Pivka(t) = computed PIVKA-II; C(t) = model computed cancer cells; V2(t) = model computed vascularization index.
Figure 7
Figure 7
Best fitting of AFP and PIVKA-II serum levels in the 3 patients with CR of the target lesion. In Case-4 the modeling analysis is stopped when sorafenib treatment was discontinued and patient underwent liver transplantation. In Case-5 and Case-6 modeling analysis is stopped when they developed new HCC lesions at different sites after 25.7 and 18.4 months of therapy. Legend: AFP = measured AFP; AFP(t) = model computed AFP; AFP(0) = AFP normal value; PIVKA-II = measured PIVKA-II; Pivka(t) = computed PIVKA-II; C(t) = model computed cancer cells; V2(t) = model computed vascularization index.
Figure 8
Figure 8
Best fitting of AFP and PIVKA-II serum levels in the 2 patients with SD of the target lesion, but overall progression due to the appearance of new lesions after 9.3 and 18.9 months of therapy. Legend: AFP = measured AFP; AFP(t) = model computed AFP; AFP(0) = AFP normal value; PIVKA-II = measured PIVKA-II; Pivka(t) = computed PIVKA-II; C(t) = model computed cancer cells; V2(t) = model computed vascularization index.
Figure 9
Figure 9
Best fitting of AFP and PIVKA-II serum levels in the 2 patients with PD of the target lesion. Case-9 showed a minimal initial response in term of AFP reduction. Legend: AFP = measured AFP; AFP(t) = model computed AFP; AFP(0) = AFP normal value; PIVKA-II = measured PIVKA-II; Pivka(t) = computed PIVKA-II; C(t) = model computed cancer cells; V2(t) = model computed vascularization index.

References

    1. GLOBOCAN 2018 The Global Cancer Observatory. International Agency for Research on Cancer 2020. [(accessed on 30 December 2020)]; Available online: http://gco.iarc.fr/today/online-analysis-table.
    1. European Association for the Study of the Liver EASL Clinical Practice Guidelines: Management of hepatocellular carcinoma. J. Hepatol. 2018;69:182–236. doi: 10.1016/j.jhep.2018.03.019. - DOI - PubMed
    1. Campigotto M., Giuffrè M., Colombo A., Visintin A., Aversano A., Budel M., Masutti F., Abazia C., Crocé L.S. Comparison between hepatocellular carcinoma prognostic scores: A 10-year single-center experience and brief review of the current literature. WJH. 2020;12:1239–1257. doi: 10.4254/wjh.v12.i12.1239. - DOI - PMC - PubMed
    1. Wilhelm S.M., Carter C., Tang L., Wilkie D., McNabola A., Rong H., Chen C., Zhang X., Vincent P., McHugh M., et al. BAY 43-9006 exhibits broad spectrum oral antitumor activity and targets the RAF/MEK/ERK pathway and receptor tyrosine kinases involved in tumor progression and angiogenesis. Cancer Res. 2004;64:7099–7109. doi: 10.1158/0008-5472.CAN-04-1443. - DOI - PubMed
    1. Rimassa L. Novel Therapies for Hepatocellular Carcinoma. Cancers. 2020;12:3049. doi: 10.3390/cancers12103049. - DOI - PMC - PubMed