. 2021 Apr 25;13(9):2065.
doi: 10.3390/cancers13092065.

Identification of TLR2 Signalling Mechanisms Which Contribute to Barrett's and Oesophageal Adenocarcinoma Disease Progression

Affiliations

Identification of TLR2 Signalling Mechanisms Which Contribute to Barrett's and Oesophageal Adenocarcinoma Disease Progression

Ewelina Flis et al. Cancers (Basel). .

Abstract

Chronic inflammation plays an important role in the pathogenesis of oesophageal adenocarcinoma (EAC) and its only known precursor, Barrett's oesophagus (BE). Recent studies have shown that oesophageal TLR2 levels increase from normal epithelium towards EAC. TLR2 signalling is therefore likely to be important during EAC development and progression, which requires an inflammatory microenvironment. Here, we show that, in response to TLR2 stimulation, BE organoids and early-stage EAC cells secrete pro-inflammatory cytokines and chemokines which recruit macrophages to the tumour site. Factors secreted from TLR2-stimulated EAC cells are shown to subsequently activate TLR2 on naïve macrophages, priming them for inflammasome activation and inducing their differentiation to an M2/TAM-like phenotype. We identify the endogenous TLR2 ligand, HMGB1, as the factor secreted from EAC cells responsible for the observed TLR2-mediated effects on macrophages. Our results indicate that HMGB1 signalling between EAC cells and macrophages creates an inflammatory tumour microenvironment to facilitate EAC progression. In addition to identifying HMGB1 as a potential target for early-stage EAC treatment, our data suggest that blocking TLR2 signalling represents a mechanism to limit HMGB1 release, inflammatory cell infiltration and inflammation during EAC progression.

Keywords: Barrett’s oesophagus; HMGB1; TLR2 signalling; inflammation; oesophageal adenocarcinoma.


Conflict of interest statement

The authors declare no conflict of interest.

Figures

Figure 1
Figure 1
Characterising TLR2 expression and response to TLR2 ligands in a panel of oesophageal cell lines. (a) TLR2 mRNA levels were determined in oesophageal cell lines GO, SK-GT 4, OE33 and FLO-1. HEK293 (human embryonic kidney) and THP-1 (human monocytic) cells were included as negative and positive controls, respectively. Data represent mean ± SEM of n = 3; * p < 0.05 (unpaired two-tailed Student’s t-test). (b) Oesophageal cell lines were left unstimulated (ctrl), stimulated with Pam3CSK4 (P3C, 0.05 μg/mL) or Pam2CSK4 (P2C, 0.05 μg/mL) for 24 h before analysis of lysates for TLR2 expression by Western blot. Blot is representative of three independent experiments. Oesophageal cell lines: (c) GO; (d) SK-GT 4; and (e) OE33; were stimulated for 24 h with: P3C (0.05 μg/mL), P2C (0.05 μg/mL) or LPS (1 μg/mL). IL-6 and IL-8 secretion levels were determined by ELISA. Data shown are representative of three independent experiments. Unpaired two-tailed Student’s t-test to compare the mean ± SEM values between treated and untreated cells; * p < 0.05; ** p < 0.01; *** p < 0.001.
Figure 2
Figure 2
A TLR2 neutralising antibody limits TLR2-mediated IL-8 secretion and TLR2 upregulation in oesophageal cell lines. (a,b) GO and (c,d) SK-GT 4 cells were left untreated or pre-treated (1 h) with αTLR2 Ab (10 μg/mL; 20 μg/mL; 40 μg/mL) and subsequently stimulated with P3C (0.05 μg/mL) (a,c) or P2C (0.05 μg/mL) (b,d) for 24 h. Supernatants were analysed for IL-8 by ELISA. Data represent the mean ± SEM of n = 3; * p < 0.05; ** p < 0.01, *** p < 0.001 (unpaired two-tailed Student’s t-test). (e) TLR2 expression levels were analysed in untreated or αTLR2 (10 μg/mL) pre-treated (1 h) GO and SK-GT 4 cells, subsequently stimulated with TLR2 ligands, P3C or P2C (each at 0.05 μg/mL). Western blots are representative of three independent experiments.
Figure 3
Figure 3
Inhibition of TLR2 in oesophageal organoids from the murine Barrett’s model, pL2-IL-1β, reduces secretion of the IL-8 orthologs, CXCL-1 and MIP-2. Cells taken from the cardia region at the squamous-columnar junction (SCJ) of 12-month old pL2-IL-1β mice (n = 4) were cultured (3 weeks) as 3D organoids. Two days prior to harvesting, organoids were pre-treated (1 h) with αTLR2 Ab (10 µg/mL) before stimulation with P2C (40 ng/mL) for 24 h, the medium was replaced and re-treated (αTLR2 Ab followed by P2C stimulation) for a further 24 h. (a) Representative images of organoid morphology at 0, 24 and 48 h (magnification: 5×, scale bars—200 µm). Organoids were harvested and supernatants were analysed for (b) CXCL-1; and (c) MIP-2 secretion. Data were normalised to total organoid protein (pg/µg) and are represented as ± SEM. Paired Student’s t-test comparing inhibitor treated to untreated, and unstimulated to stimulated: * p < 0.05, ** p < 0 01, *** p < 0.001.
Figure 4
Figure 4
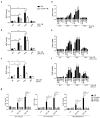
Oesophageal cell lines secrete TLR agonists following TLR2 stimulation. (ac) Oesophageal cells (GO, SK-GT 4 and OE33) were αTLR2 (10 μg/mL) pre-treated for 1 h prior to stimulation (4 h) with P3C (0.05 μg/mL), P2C (0.05 μg/mL) or LPS (1 μg/mL). The medium was removed, cells were washed x3 with PBS and incubated in fresh media for 24 h. Conditioned medium (CM) was collected from (a) GO; (b) SK-GT 4; and (c) OE33 cells and added (50% final conc.) to the TLR reporter cell line THP1-XBlue-CD14 (seeded at 4 × 10⁶ cells/mL) for 24 h. TLR stimulation was assessed by measuring supernatant SEAP levels, using QUANTI-Blue reagent. Statistical analysis was performed using an unpaired two-tailed Student’s t-test to compare the mean ± SEM values between untreated and CM treated cells and two-way ANOVA to compare αTLR2-treated and -untreated cells, n = 3, * p < 0.05; ** p < 0.01; *** p < 0.001. (df) Oesophageal cells were stimulated as in (ac) for 4 h. The medium was removed, cells were washed (x3) and incubated in fresh media for the timepoints indicated. CM was collected from (d) GO; (e) SK-GT 4; (f) OE33; and added (50% final conc.) to THP1-XBlue-CD14 cells. Values represent the mean ± S.E.M of three independent experiments; * p < 0.05; ** p < 0.01; *** p < 0.001 (Unpaired Student’s t-test). (g) THP1-XBlue-CD14 cells were left untreated or pre-treated (1 h) with 0.4 μg/mL; 4 μg/mL; 40 μg/mL αTLR2 prior to incubation with 50% CM collected from unstimulated, P3C- or P2C-stimulated GO, SK-GT 4 or OE33 cells. Data represent the mean ±SEM of n = 3; ** p  <  0.01; *** p  <  0.001 (two-way ANOVA test).
Figure 5
Figure 5
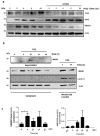
TLR2 stimulation of oesophageal cancer cells induces HMGB1 secretion. SK-GT 4 cells were stimulated with P2C (0.05 μg/mL) for the indicated times. (a) Cellular expression levels of TLR2, RAGE, HMGB1 and actin (loading control) were analysed by Western blot. (b) HMGB1 levels in supernatants (upper blot) and in the cytoplasm (lower blots) were analysed by Western blot. Whole-cell lysates were used as a positive control for cytoplasmic isolation; Lamin B—nuclear marker; actin—cytoplasmic marker. (c) Densitometry of HMGB1 levels in the cytoplasm and supernatants based on blots from three independent experiments. Values represent the mean ± SEM, * p < 0.05 (unpaired two-tailed Student’s t-test).
Figure 6
Figure 6
Conditioned media from oesophageal cancer cells induce TLR2-dependent cytokine secretion and upregulation of inflammasome-related proteins in macrophages. (a) IL-6, TNFα and IL-10 levels in BMDM supernatants pre-treated with ctrl, P3C- and P2C-CM were determined by ELISA. Values represent the mean ± SEM of n = 3; * p < 0.05; ** p < 0.01; *** p < 0.001 (two-way ANOVA test). (b) BMDMs were left untreated or pre-treated with αTLR2 (10 μg/mL) for 1 h prior to stimulation (24 h) with 50% CM collected from unstimulated (ctrl CM), P3C- or P2C-stimulated (0.05 μg/mL) SK-GT 4 cells; or directly with P3C or P2C (0.05 μg/mL) as positive control. The expression of NLRP3, TLR2, caspase-11, pro-IL-1β and actin (loading control) were determined by Western blot. (c) BMDMs were left untreated or pre-treated with αTLR2 (1 h, 10 μg/mL) prior to stimulation (24 h) with recombinant HMGB1 (10–100 ng/mL). Caspase-11, pro-IL-1β and actin (loading control) levels were determined by Western Blot. Blots are representative of three independent experiments.

References

    1. Maxwell Parkin D., Bray F., Ferlay J., Pisani P. Estimating the world cancer burden: Globocan 2000. Int. J. Cancer. 2001;94:153–156. doi: 10.1002/ijc.1440. - DOI - PubMed
    1. Thrift A.P., Whiteman D.C. The incidence of esophageal adenocarcinoma continues to rise: Analysis of period and birth cohort effects on recent trends. Ann. Oncol. 2012;23:3155–3162. doi: 10.1093/annonc/mds181. - DOI - PubMed
    1. Pera M., Manterola C., Vidal O., Grande L. Epidemiology of esophageal adenocarcinoma. J. Surg. Oncol. 2005;92:151–159. doi: 10.1002/jso.20357. - DOI - PubMed
    1. Yang L., Francois F., Pei Z. Molecular Pathways: Pathogenesis and clinical implications of microbiome alteration in esophagitis and Barrett’s esophagus. Clin. Cancer Res. 2012;18:2138–2144. doi: 10.1158/1078-0432.CCR-11-0934. - DOI - PMC - PubMed
    1. Yang L., Lu X., Nossa C.W., Francois F., Peek R.M., Pei Z. Inflammation and Intestinal Metaplasia of the Distal Esophagus Are Associated with Alterations in the Microbiome. Gastroenterology. 2009;137:588–597. doi: 10.1053/j.gastro.2009.04.046. - DOI - PMC - PubMed

LinkOut - more resources