. 2021 Apr 25;9(5):920.
doi: 10.3390/microorganisms9050920.

A Symbiotic Approach to Generating Stress Tolerant Crops

Affiliations

A Symbiotic Approach to Generating Stress Tolerant Crops

Regina S Redman et al. Microorganisms. .

Abstract

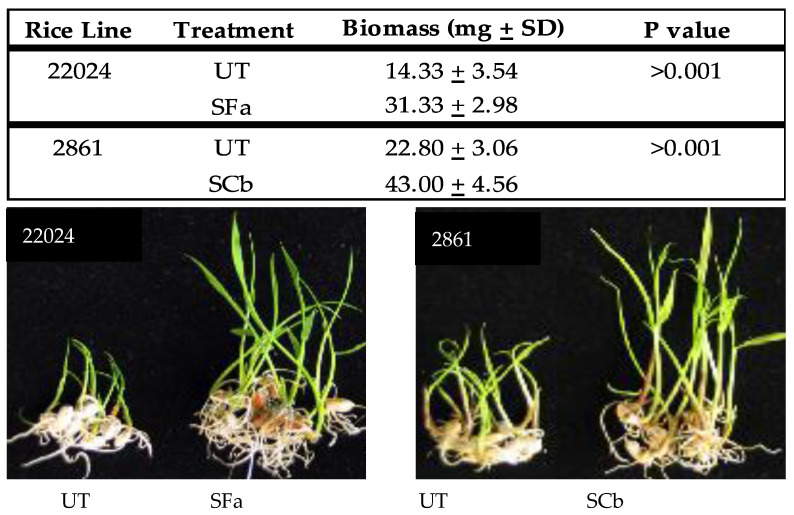
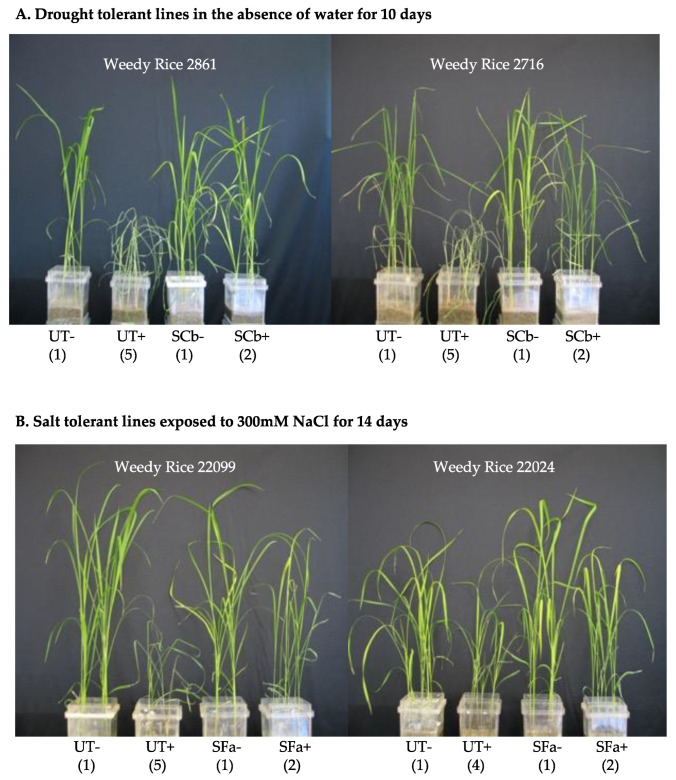
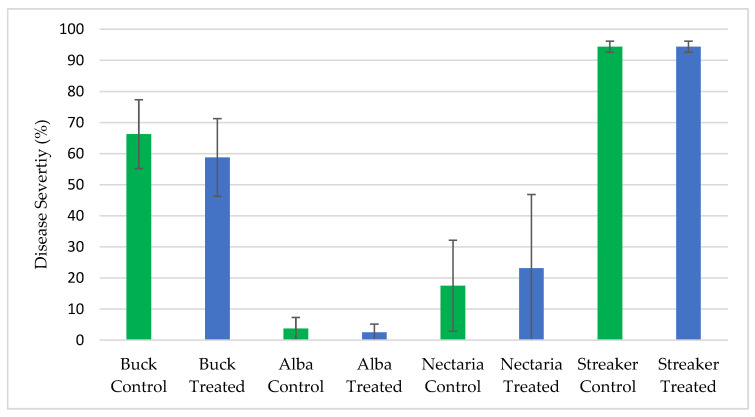
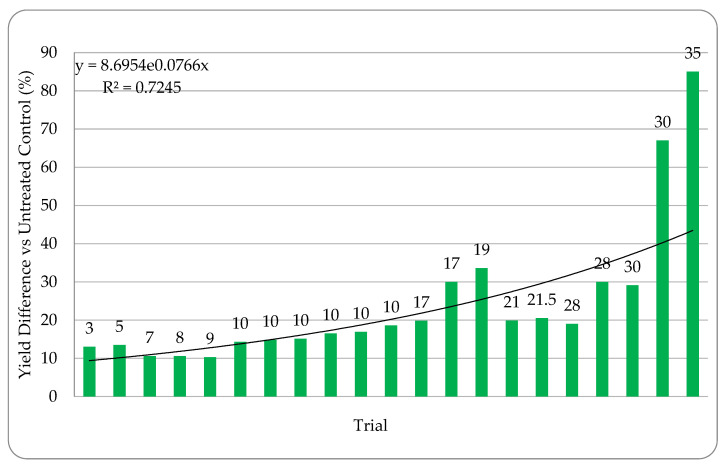
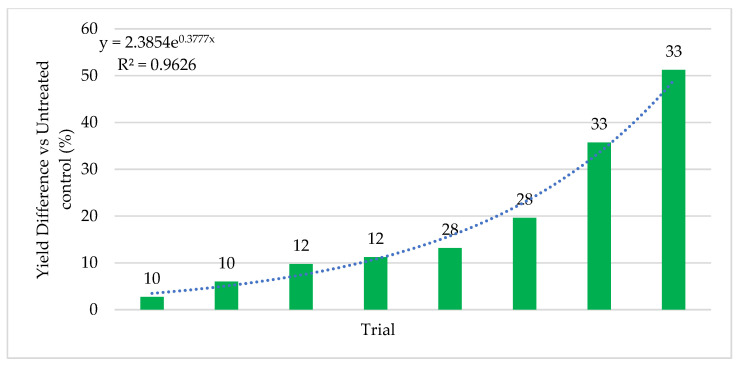
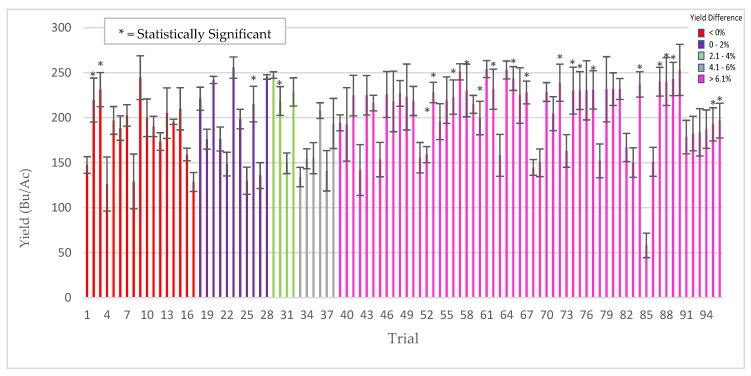
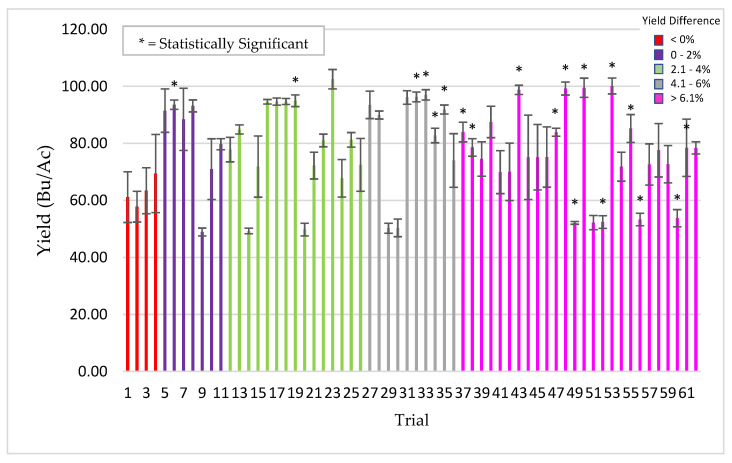
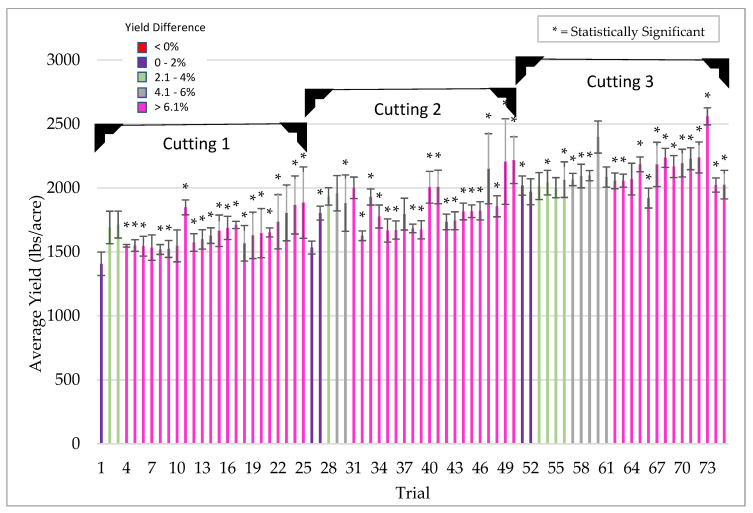
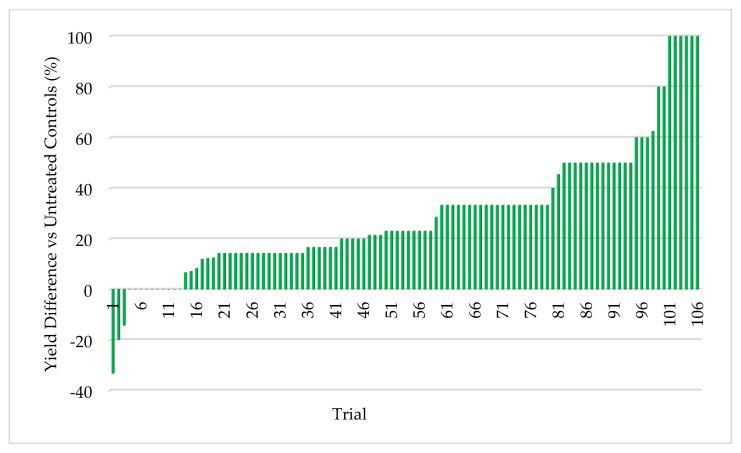
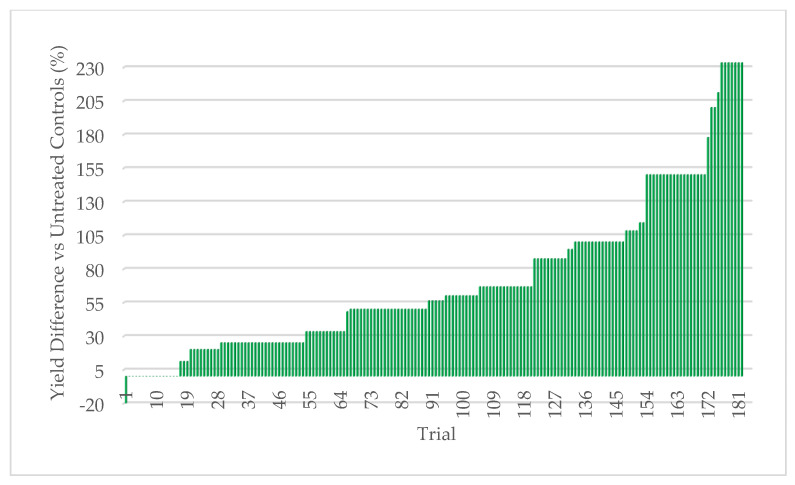
Studies were undertaken to determine if fungal endophytes from plants in stressful habitats could be commercialized to generate climate resilient crop plants. Fungal endophytes were isolated from weedy rice plants and grasses from South Korea and the USA, respectively. Endophytes (Curvularia brachyspora and Fusarium asiaticum) from weedy rice plants from high salt or drought stressed habitats in South Korea conferred salt and drought stress tolerance to weedy rice and commercial varieties reflective of the habitats from which they were isolated. Fungal endophytes isolated from grasses in arid habitats of the USA were identified as Trichoderma harzianum and conferred drought and heat stress tolerance to monocots and eudicots. Two T. harzianum isolates were exposed to UV mutagenesis to derive strains resistant to fungicides in seed treatment plant protection packages. Three strains that collectively had resistance to commonly used fungicides were used for field testing. The three-strain mixture (ThSM3a) increased crop yields proportionally to the level of stress plants experienced with average yields up to 52% under high and 3-5% in low stress conditions. This study demonstrates fungal endophytes can be developed as viable commercial tools for rapidly generating climate resilient crops to enhance agricultural sustainability.

Keywords: abiotic stress tolerance; agriculture; fungal endophytes; symbiosis.


Conflict of interest statement

The authors declare no conflict of interest.

Figures

Figure 1
Figure 1
Weedy Rice Seedling Growth Response. Statistical analysis (N = 6) of seedling wet biomass weights (mg) with the seeds removed, was performed and S treatments found to be significantly larger (t test). Representative photos (bottom panels) showing growth response differences of five day old (N = 6) weedy rice seedlings lines 22024 (salt tolerant) and 2861 (drought tolerant) without (untreated = UT) or with (symbiotic = S) their native endophytes C. brachyspora (SCb) and F. asiaticum (SFa), respectively.
Figure 2
Figure 2
Drought and Salt Responses of Weedy Rice Lines. Untreated (UT) and symbiotic (S) plants were generated with native endophytes isolated from weedy rice lines from drought (SCb; C. brachyspora) or salt stress (SFa; F. asiaticum) habitats. Representative photo of magenta box studies showing: (A) Drought tolerance performed on one-month old plants of weedy rice drought tolerant plant lines 2861 (panel A-left) and 2716 (panel A-right) in the absence (−) and presence (+) of drought stress (devoid of water for 10 days) of UT (untreated) and symbiotic plants (SCb); (B) Salt tolerance assays were performed on 2-week old weedy rice drought tolerant plant lines 22099 (panel B-left) and 22024 (panel B-right) in the absence (−) and presence (+) of salt stress (exposure to 300 mM NaCl for 14 days) of UT (untreated) and symbiotic plants (SFa). Assays were conducted with six plants/magenta box and 4 magenta boxes per treatment. Plant health was numerically scored collectively for the six plants in each magenta box. The Kruskal–Wallis as a non-parametric test was utilized as the plant health metric is categorical data. Plant health is represented by the numbers under the plants. Regardless of the stress, S plants out performed their UT counterparts (Weedy Rice 2861 H(1) = 7, p = 0.008151; Weedy Rice 2716 H(1) = 6.4, p = 0.01141; Weedy Rice 22099 H(1) = 7, p = 0.008151; Weedy Rice 22024 H(1) = 6.22, p = 0.01262). No significant differences in plant health was observed with treatments in the absence of stress.
Figure 3
Figure 3
Fluid Consumption in Untreated and Treated Plants. Fluid consumption was measured on four-week old UT (untreated) and symbiotic (with SCb or SFa endophytes from weedy rice lines from drought and salt stress habitats, respectively) Dongjin (blue bars) or M206 (orange bars) rice plant varieties grown in double decker magenta boxes over a 14-day period. Statistical analysis indicated that S plants consumed less fluid compared to UT plants with S-Dongjin cultivar consuming the least amount of fluid (Duncan’s Multiple Range Test, p < 0.001). Different letters above the bars indicate statistically significant differences.
Figure 4
Figure 4
Percent Barley Scald by Location and Treatment. Untreated controls (green bars) and ThSM3a treated (blue bars) barley of four varieties were tested. Each treatment had six replicate plots for a total of 48 plots. Plots were randomly distributed in the field. The higher the percentage, the higher the disease incidence. There were no significant differences between treatments (ANOVA p-value = 0.986 (F = 0.000281 < Fc = 4.0195)). The single factor ANOVA test is the most appropriate for looking at the differences between means when the dependent variable is a percentage. Trials performed by Oregon State University.
Figure 5
Figure 5
Average Severity of Brown Spot on Rice by Treatment. Brown spot symptoms were rated on a scale of 0–9 (the higher the number, the higher the disease severity) and the Kruskal-Wallis test determined there was no significance. H(3) = 2.0556, p = 0.3578. Untreated control is indicated by the green bar. The blue bars are ThSM3a treatments 1 and 2 which represent low (500 CFU/seed) and high dose (1500 CFU/seed), respectively. Plots were randomly distributed throughout the field. Plots consisted of seven 4.6 m rows, and spaced 17.8 cm between rows and replicated four times per treatment. Kruskal–Wallis as a non-parametric test was utilized as the symptom variable is categorical data. Trials performed by Texas A&M AgriLife Research.
Figure 6
Figure 6
Corn Percent Yield Difference vs Stress. Stress increases left to right from 3–35 with level of stress indicated above each bar as described in the materials and methods. Higher stress levels are indicated by higher numbers. Trials were performed in CA, WA, MI, NE, MN, AZ, ND, and India using 10 commercial hybrids with standard PPP’s. Each bar is a separate trial and plots sizes varied from 10 ft × 50 ft to 50 acres. The bars indicate the percent difference in yields of ThMS3a treated versus the untreated controls. Each test had a single replication of treated and untreated so it was not possible to include standard deviations or statistical analysis. Cooperators: CRO’s, seed companies, farmers, universities.
Figure 7
Figure 7
Cotton Percent Yield Difference vs Stress. Stress increases left to right from 10–33 with level of stress indicated above each bar as described in the materials and methods. Higher stress levels are indicated by higher numbers. Trials were performed in TX, Australia, and India using four commercial hybrids with Standard PPP’s. Each bar is a separate trial and plots sizes varied from 10 ft × 50 ft to 50 acres. The bars indicate the percent difference in yields of ThMS3a treated versus the untreated control. With increasing stress, increases in yields were observed. Each test had a single replication of treated and untreated so it was not possible to include standard deviations or statistical analysis. Cooperators: CRO’s, seed companies and farmers.
Figure 8
Figure 8
Corn response to low stress conditions. From 2013–2017, 96 trials were performed in 17 US states using 35 commercial varieties with standard PPP’s. Each bar is a separate trial comparing yields of treated (ThMS3a) vs untreated plants. Plots sizes varied from 10 ft × 50 ft to 5 acres with 4–8 replications/trial. Bars are color coded according to yield differences (Bu/Ac) indicated in the legend (upper right of graph). Bars with an asterisk symbol (*) indicate yield significance (t test, p-value < 0.05). Cooperators: seed companies, farmers, CRO’s, universities, Ag distributors.
Figure 9
Figure 9
Winter wheat yield response (treated plants vs untreated controls) under low stress conditions. From 2017–2020, 62 trials were performed in three US states with commercial varieties/hybrids with Standard PPP’s. Each bar is a separate trial comparing yields of treated (ThMS3a) vs untreated plants with 4–8 replicates/trial. Plot sizes varied from 10 ft × 30 ft to 10 ft × 50 ft. Bars are color coded according to yield differences (Bu/Ac) indicated in the legend (upper right of graph). Bars with an asterisk symbol (*) indicate yield significance (t test, p-value < 0.05). Cooperators: South Dakota State University, Agri-Tech Research, seed company.
Figure 10
Figure 10
Alfalfa yield response of treated (ThMS3a) vs untreated controls plants under low stress conditions. From 2016–2020, 75 trials were performed in four US states (WI, SD, NV, AZ) on commercial varieties with standard PPP’s. Each bar is a separate trial and plots sizes varied from 10 ft × 50 ft to 10 acres with 4–8 replications/trial. In each trial, there were three successive cuttings every 1–1.5 months and is indicated as the average yield (lbs/acre). Bars are color coded according to yield differences indicated in the legend (upper left of graph). Bars with an asterisk symbol (*) indicate yield significance (t test, p-value < 0.05). Cooperators: farmers, CRO’s, universities.
Figure 11
Figure 11
Pearl millet response to BioEnsure. 106 trials (0.1–5.0 acres/plot) were performed with carry-over and market seed. Each bar represents a separate comparative trial of treated (ThMS3a) vs untreated plant yields. Win rate was 96% with a minimum of 10% yield increase. Each test had a single replication of treated and untreated so it was not possible to include standard deviations or statistical analysis. Cooperators: farmers.
Figure 12
Figure 12
Mung bean response to BioEnsure. 183 trials (0.1–5.0 acres/plot) were performed with carry-over and market seed. Each bar represents a separate comparative trial of treated (ThMS3a) vs untreated plant yields. Win rate was 93% with a minimum of 10% yield increase. Each test had a single replication of treated and untreated so it was not possible to include standard deviations or statistical analysis. Cooperators: farmers.

Similar articles

Cited by

References

    1. [(accessed on 20 April 2021)]; Available online: http://www.copenhagendiagnosis.com.
    1. FAO . 20 Things to Know about the Impact of Salt Water on Agricultural Land in Aceh Province. FAO; Rome, Italy: 2005. [(accessed on 20 April 2021)]. FAO Field Guide. Available online: http://www.fao.org/ag/tsunami/docs/saltwater-guide.pdf.
    1. Zhao C., Liu B., Piao S., Wang X., Lobell D.B., Huang Y., Huang M., Yao Y., Bassu S., Ciais P., et al. Temperature Increase Reduces Global Yields of Major Crops in Four Independent Estimates. Proc. Natl. Acad. Sci. USA. 2017;114:9326–9331. doi: 10.1073/pnas.1701762114. - DOI - PMC - PubMed
    1. Van Nguyen N., Ferrero A. Meeting the challenges of global rice production. Paddy Water Environ. 2006;4:1–9. doi: 10.1007/s10333-005-0031-5. - DOI
    1. Peng S., Huang J., Sheehy J.E., Laza R.C., Visperas R.M., Zhong X., Centeno G.S., Khush G.S., Cassman K.G. Rice yields decline with higher night temperature from global warming. Proc. Natl. Acad. Sci. USA. 2004;101:9971–9975. doi: 10.1073/pnas.0403720101. - DOI - PMC - PubMed

LinkOut - more resources