

Profiling of Cerebrospinal Fluid Lipids and Their Relationship with Plasma Lipids in Healthy Humans
- PMID: 33923144
- PMCID: PMC8146161
- DOI: 10.3390/metabo11050268
Profiling of Cerebrospinal Fluid Lipids and Their Relationship with Plasma Lipids in Healthy Humans
Abstract
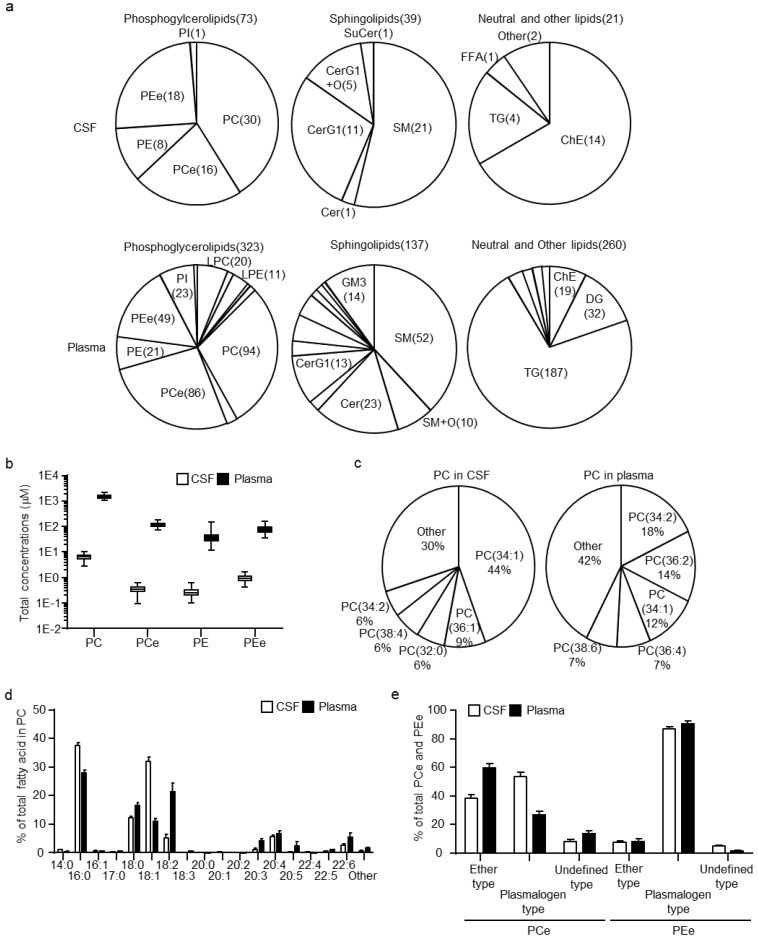
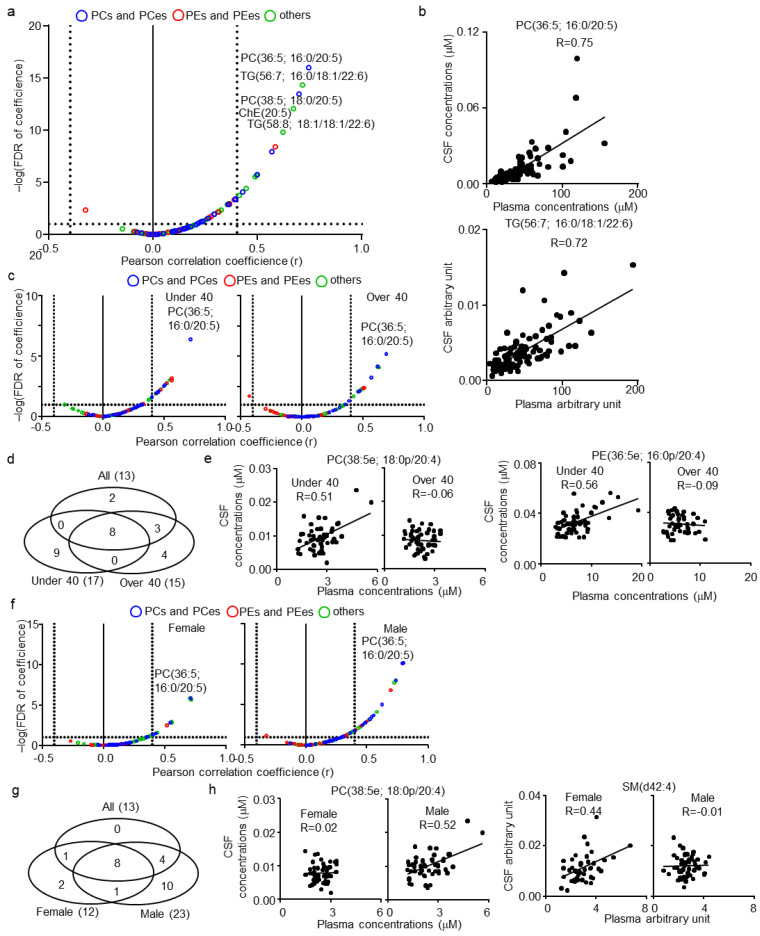
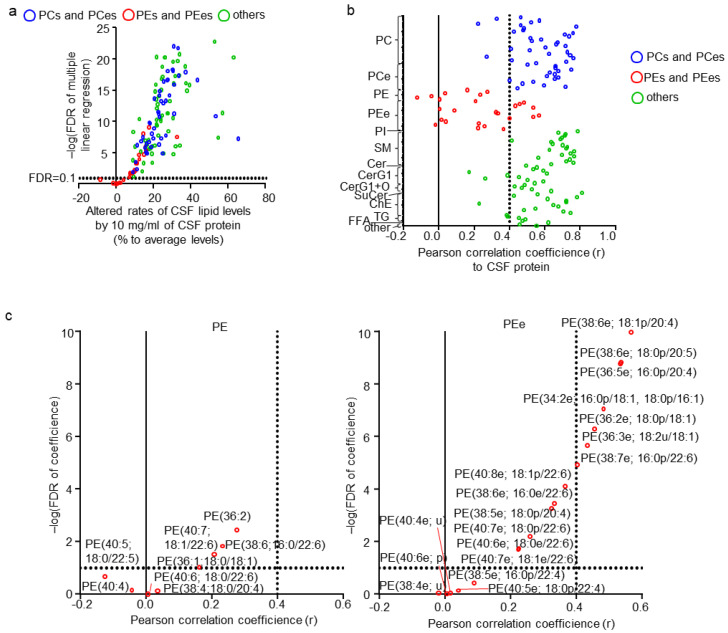
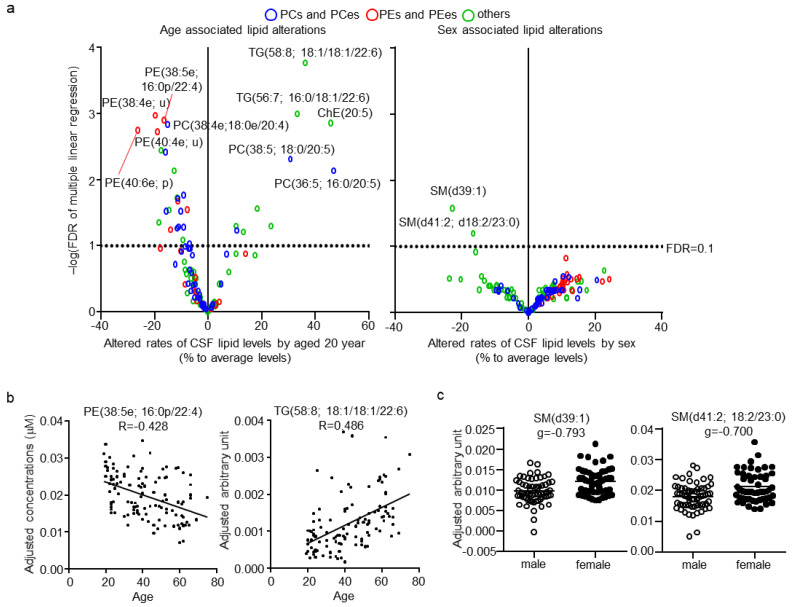
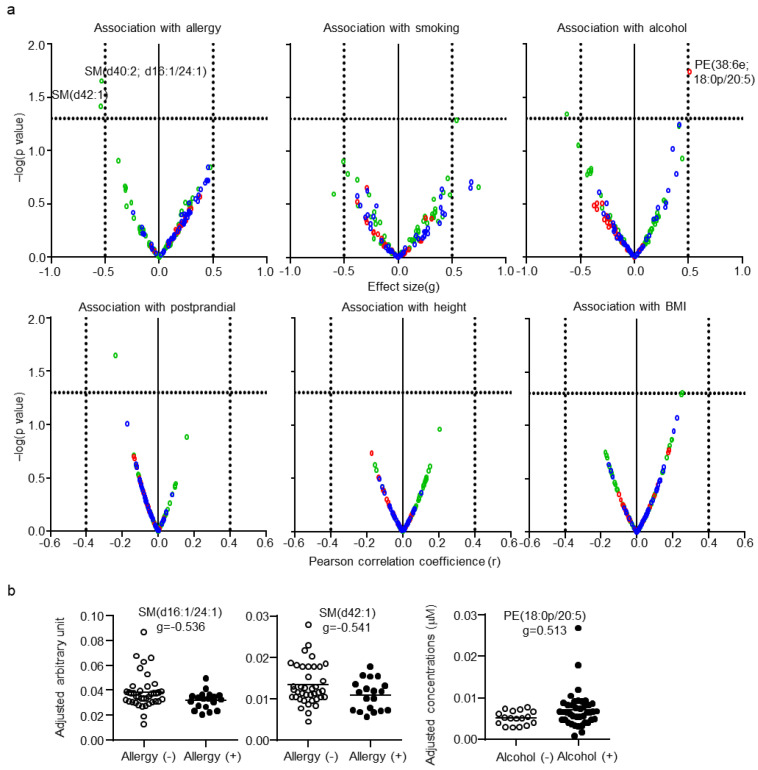
Lipidomics provides an overview of lipid profiles in biological systems. Although blood is commonly used for lipid profiling, cerebrospinal fluid (CSF) is more suitable for exploring lipid homeostasis in brain diseases. However, whether an individual's background affects the CSF lipid profile remains unclear, and the association between CSF and plasma lipid profiles in heathy individuals has not yet been defined. Herein, lipidomics approaches were employed to analyze CSF and plasma samples obtained from 114 healthy Japanese subjects. Results showed that the global lipid profiles differed significantly between CSF and plasma, with only 13 of 114 lipids found to be significantly correlated between the two matrices. Additionally, the CSF total protein content was the primary factor associated with CSF lipids. In the CSF, the levels of major lipids, namely, phosphatidylcholines, sphingomyelins, and cholesterolesters, correlated with CSF total protein levels. These findings indicate that CSF lipidomics can be applied to explore changes in lipid homeostasis in patients with brain diseases.
Keywords: cerebrospinal fluid; lipid profiling; lipidomics; mass spectrometry; plasma lipid.
Conflict of interest statement
The authors declare no conflict of interest. The funders had no role in the design of the study; in the collection, analyses, or interpretation of data; in the writing of the manuscript; or in the decision to publish the results.
Figures
Similar articles
-
Human Cerebrospinal Fluid Sample Preparation and Annotation for Integrated Lipidomics and Metabolomics Profiling Studies.Mol Neurobiol. 2024 Apr;61(4):2021-2032. doi: 10.1007/s12035-023-03666-4. Epub 2023 Oct 16. Mol Neurobiol. 2024. PMID: 37843799 Free PMC article.
-
Lipidomic profiling of the cerebrospinal fluid in moyamoya angiopathy patients.Orphanet J Rare Dis. 2025 May 23;20(1):243. doi: 10.1186/s13023-025-03782-5. Orphanet J Rare Dis. 2025. PMID: 40410905 Free PMC article.
-
Differential Lipid Signatures of Lumbar and Cisternal Cerebrospinal Fluid.Biomolecules. 2024 Nov 11;14(11):1431. doi: 10.3390/biom14111431. Biomolecules. 2024. PMID: 39595607 Free PMC article.
-
Lipidomics, Biomarkers, and Schizophrenia: A Current Perspective.Adv Exp Med Biol. 2017;965:265-290. doi: 10.1007/978-3-319-47656-8_11. Adv Exp Med Biol. 2017. PMID: 28132184 Review.
-
Lipidomics applications for discovering biomarkers of diseases in clinical chemistry.Int Rev Cell Mol Biol. 2014;313:1-26. doi: 10.1016/B978-0-12-800177-6.00001-3. Int Rev Cell Mol Biol. 2014. PMID: 25376488 Review.
Cited by
-
Distinct Cerebrospinal Fluid Lipid Signature in Patients with Subarachnoid Hemorrhage-Induced Hydrocephalus.Biomedicines. 2023 Aug 23;11(9):2360. doi: 10.3390/biomedicines11092360. Biomedicines. 2023. PMID: 37760800 Free PMC article.
-
CSF sphingolipids are correlated with neuroinflammatory cytokines and differentiate neuromyelitis optica spectrum disorder from multiple sclerosis.J Neurol Neurosurg Psychiatry. 2024 Dec 16;96(1):54-67. doi: 10.1136/jnnp-2024-333774. J Neurol Neurosurg Psychiatry. 2024. PMID: 38844340 Free PMC article.
-
Alterations in the Plasma Lipidome of Adult Women With Bipolar Disorder: A Mass Spectrometry-Based Lipidomics Research.Front Psychiatry. 2022 Mar 21;13:802710. doi: 10.3389/fpsyt.2022.802710. eCollection 2022. Front Psychiatry. 2022. PMID: 35386518 Free PMC article.
-
Editorial for the Special Issue "Aging, Age-Related Changes in the Brain and the Progression of Alzheimer's Disease".Curr Issues Mol Biol. 2025 Apr 29;47(5):318. doi: 10.3390/cimb47050318. Curr Issues Mol Biol. 2025. PMID: 40699717 Free PMC article.
-
Associations of the Lipidome with Ageing, Cognitive Decline and Exercise Behaviours.Metabolites. 2022 Aug 31;12(9):822. doi: 10.3390/metabo12090822. Metabolites. 2022. PMID: 36144226 Free PMC article. Review.
References
-
- Houjou T., Yamatani K., Imagawa M., Shimizu T.R., Taguchi R. A shotgun tandem mass spectrometric analysis of phospholipids with normal-phase and/or reverse-phase liquid chromatography/electrospray ionization mass spectrometry. Rapid Commun. Mass Spectrom. 2005;19:654–666. doi: 10.1002/rcm.1836. - DOI - PubMed
Grants and funding
LinkOut - more resources
Full Text Sources
