. 2021 Apr 24;22(9):4449.
doi: 10.3390/ijms22094449.

Transcriptome Analysis of Seed Weight Plasticity in Brassica napus

Affiliations

Transcriptome Analysis of Seed Weight Plasticity in Brassica napus

Javier Canales et al. Int J Mol Sci. .

Abstract

A critical barrier to improving crop yield is the trade-off between seed weight (SW) and seed number (SN), which has been commonly reported in several crops, including Brassica napus. Despite the agronomic relevance of this issue, the molecular factors involved in the interaction between SW and SN are largely unknown in crops. In this work, we performed a detailed transcriptomic analysis of 48 seed samples obtained from two rapeseed spring genotypes subjected to different source-sink (S-S) ratios in order to examine the relationship between SW and SN under different field conditions. A multifactorial analysis of the RNA-seq data was used to identify a group of 1014 genes exclusively regulated by the S-S ratio. We found that a reduction in the S-S ratio during seed filling induces the expression of genes involved in sucrose transport, seed weight, and stress responses. Moreover, we identified five co-expression modules that are positively correlated with SW and negatively correlated with SN. Interestingly, one of these modules was significantly enriched in transcription factors (TFs). Furthermore, our network analysis predicted several NAC TFs as major hubs underlying SW and SN compensation. Taken together, our study provides novel insights into the molecular factors associated with the SW-SN relationship in rapeseed and identifies TFs as potential targets when improving crop yield.

Keywords: Brassica napus; gene co-expression; network analysis; seed number; seed weight; source–sink; transcriptomics.


Conflict of interest statement

The authors declare no conflict of interest. The funders had no role in the design of the study; in the collection, analyses, or interpretation of the data; in the writing of the manuscript; or in the decision to publish the results.

Figures

Figure 1
Figure 1
Multivariate analysis of the RNA-seq data obtained from seeds of two rapeseed hybrids grown under different source–sink ratios. (A) Multifactorial analysis showing how many genes were regulated by the S–S ratio (SS), genotype (G), developmental time (T), sowing date (SD), and the interaction of these factors (q-value < 0.01). An average of 26 million reads per sample were pseudo-aligned to the Brassica napus reference transcriptome using kallisto [25] and a fully mapped dataset was multivariate analyzed with the sleuth R package [26]. (B) An intersection analysis between genes regulated by the S–S ratio (SS), genotype (G), and developmental time (T). Genes significantly affected by SD or factors interactions were discarded from this analysis, which was performed using the SuperExactTest R package [27]. The black points indicate which factors affect the expression levels of the genes shown in the bar diagram.
Figure 2
Figure 2
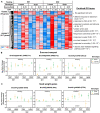
Genes exclusively regulated by developmental time are associated with seed filling. A heatmap showing the two major expression patterns of genes exclusively regulated by developmental time. Hierarchical clustering was performed based on Pearson correlation distances and average linkage using Morpheus software [29]. Each column of the heatmap represents the average expression of three biological replicates. The gene expression values for each gene were normalized by Z-score transformation. The top 5 enriched GO terms of the biological process domain are represented on the right side of each cluster. GO term enrichment analysis was performed by a hypergeometric test using BiNGO software [28]. FDR-corrected p-values are indicated for each GO term in brackets. SD = sowing date, DAF = days after flowering, C = control, 0–15 = source to sink treatments performed from the beginning of flowering to 15 DAF.
Figure 3
Figure 3
Reduction in the source–sink ratio during seed filling induces the expression of genes involved in sucrose transport, seed weight, and stress response. (A) A heatmap showing the two major expression patterns of genes exclusively regulated by shading treatment. Hierarchical clustering was performed based on Pearson correlation distances and average linkage using Morpheus software [29]. Each column of the heatmap represents the average expression of three biological replicates. The gene expression values for each gene were normalized by Z-score transformation. The significant and nonredundant GO terms (adjusted p-value < 0.05) of the biological process domain are represented on the right side of each cluster. GO term enrichment analysis was performed by a hypergeometric test using BiNGO software [28]. FDR-adjusted p-values are indicated for each GO term in brackets. (B) Expression profiles of three representative genes belongs to the GO term “sucrose transport”. The dots represent the average log2 fold change between the shading and control samples obtained from normalized RNA-seq data, whereas bars indicate the standard error of the mean (SEM) of three replicates. The Arabidopsis ortholog of each rapeseed gene is indicated in brackets. (C) Expression profiles of three representative genes for which the orthologs in Arabidopsis are involved in seed weight regulation. The dots represent the average log2 fold of change between shading and control samples obtained from normalized RNA-seq data, whereas bars indicate the standard error of the mean (SEM) of three replicates. The Arabidopsis ortholog of each rapeseed gene is indicated in brackets.
Figure 4
Figure 4
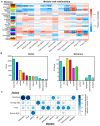
Weighted gene co-expression network analysis identified the modules associated with the SW and SN relationship at 7 DAF. (A) A heatmap showing the module–trait associations. Each row corresponds to a module eigengene, and each column corresponds to a trait. Only significant correlations (p-value < 0.01) are shown with numbers. Red and blue denote positive and negative correlations with gene expression, respectively. The agronomic traits were obtained from our previous work [16]. Modules significantly correlated with SW and SN are indicated with a black rectangle. (B) Histograms showing the number of genes (left) and GO terms (right) per co-expression module. Only modules significantly correlated with at least one agronomic trait are represented. (C) Balloon plot showing the percentage of genes in each module that are significantly regulated by each factor.
Figure 5
Figure 5
Weighted gene co-expression network analysis identified the modules associated with the SW and SN relationship at 14 DAF. (A) A heatmap showing the module–trait associations. Each row corresponds to a module eigengene, and each column corresponds to a trait. Only significant correlations (p-value < 0.01) are shown with numbers. Red and blue denote positive and negative correlations with gene expression, respectively. The agronomics traits were obtained from our previous work [16]. The modules significantly correlated with SW and SN are indicated with a black rectangle. (B) Histograms showing the number of genes (left) and GO terms (right) per co-expression module. Only modules significantly correlated with at least one agronomic trait are represented. (C) Balloon plot showing the percentage of genes in each module that are significantly regulated by each factor.
Figure 6
Figure 6
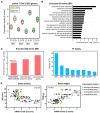
The yellow co-expression module of 7 DAF network is associated with the relationship between SW and SN. (A) Expression profiles of genes belonging to the yellow module. On each box, the central mark indicates the median, and the bottom and top edges of the box indicate the 25th and 75th percentiles, respectively. The whisker indicates the standard deviation of the expression data of all genes belonging to the yellow co-expression module. (B) GO term enrichment analysis of genes belonging to the yellow co-expression module performed by a hypergeometric test using the BiNGO software and the biological process domain [28]. (C) Enriched GO terms of the Molecular Function (MF) domain. The enrichment analysis was performed using the BiNGO software, as indicated above. (D) Distribution of the 96 transcription factors of the yellow module according to family. The transcription factors were classified following PlantTFDB4.0 database annotation [39]. (E) Relationships between the expression levels of the selected TFs and seed number (right) or seed weight (left). TFs were selected by taking into account their high intramodular connectivity and gene significance with SN and SW traits.
Figure 7
Figure 7
The red co-expression module of the 14 DAF network is associated with the relationship between SW and SN. (A) Expression profiles of genes belonging to the yellow module. On each box, the central mark indicates the median, and the bottom and top edges of the box indicate the 25th and 75th percentiles, respectively. The whisker indicates the standard deviation of the expression data of all genes belonging to the yellow co-expression module. (B) GO term enrichment analysis of genes belonging to the yellow co-expression module performed by a hypergeometric test using the BiNGO software and the biological process domain [28]. (C) Relationships between the expression levels of the selected TFs and seed number (right) or seed weight (left). TFs were selected by taking into account their high intramodular connectivity and gene significance with SN and SW traits.

References

    1. Savadi S. Molecular Regulation of Seed Development and Strategies for Engineering Seed Size in Crop Plants. Plant Growth Regul. 2018;84:401–422. doi: 10.1007/s10725-017-0355-3. - DOI
    1. Ray D.K., Mueller N.D., West P.C., Foley J.A. Yield Trends Are Insufficient to Double Global Crop Production by 2050. PLoS ONE. 2013;8:e66428. doi: 10.1371/journal.pone.0066428. - DOI - PMC - PubMed
    1. Universidade Federal de Ouro Preto . UFOP Report on Global Market Supply 2017/2018. Universidade Federal de Ouro Preto; Ouro Preto, Brazil: 2019.
    1. FAO . Food Outlook—Biannual Report on Global Food Markets. FAO; Rome, Italy: 2020.
    1. FAOSTAT Crops Production 2021. [(accessed on 23 March 2021)];2021 Available online: http://www.fao.org/faostat/en/#data/QC.