. 2021 Apr 24;26(9):2493.
doi: 10.3390/molecules26092493.

Neuroprotective Effects of Curcumin in Methamphetamine-Induced Toxicity

Affiliations

Neuroprotective Effects of Curcumin in Methamphetamine-Induced Toxicity

Larisa Ryskalin et al. Molecules. .

Abstract

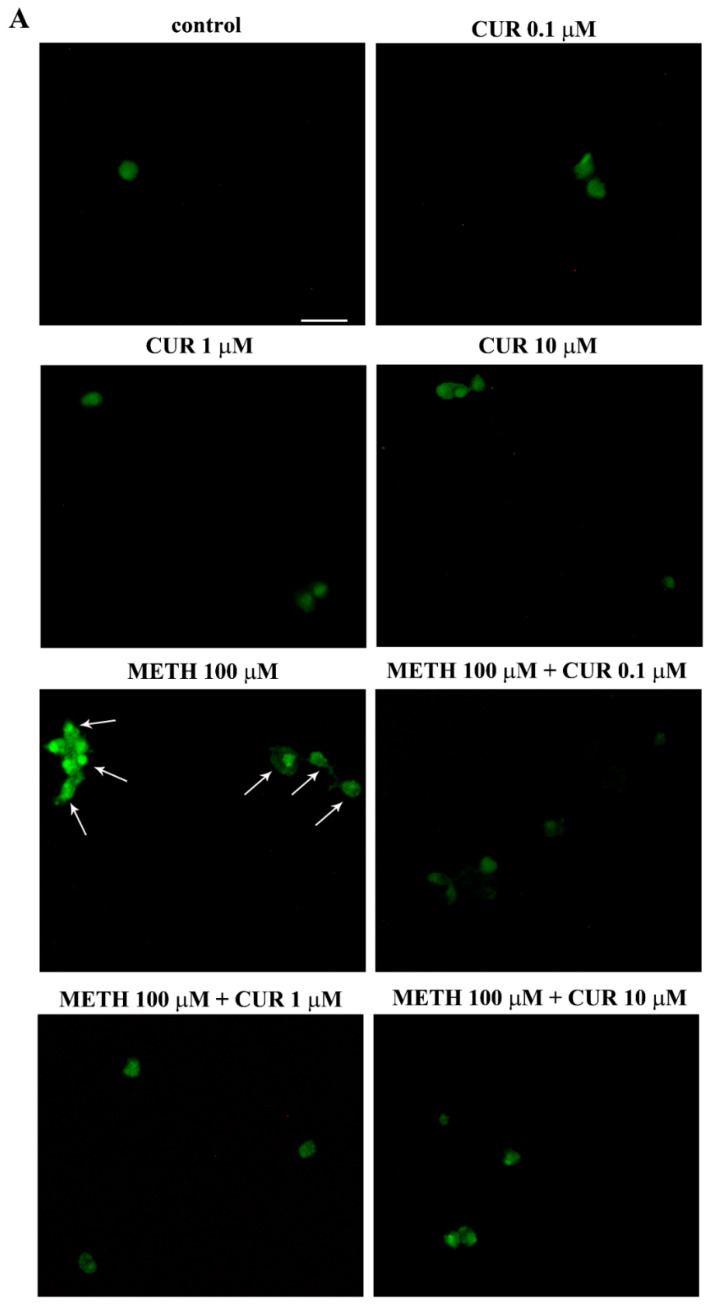
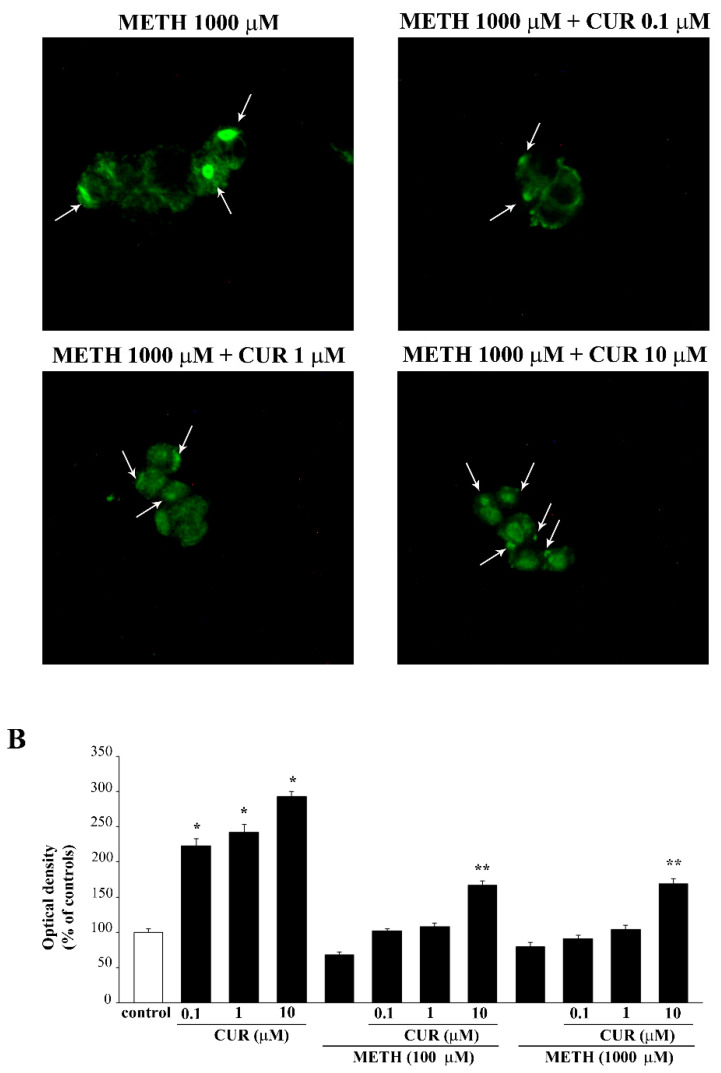
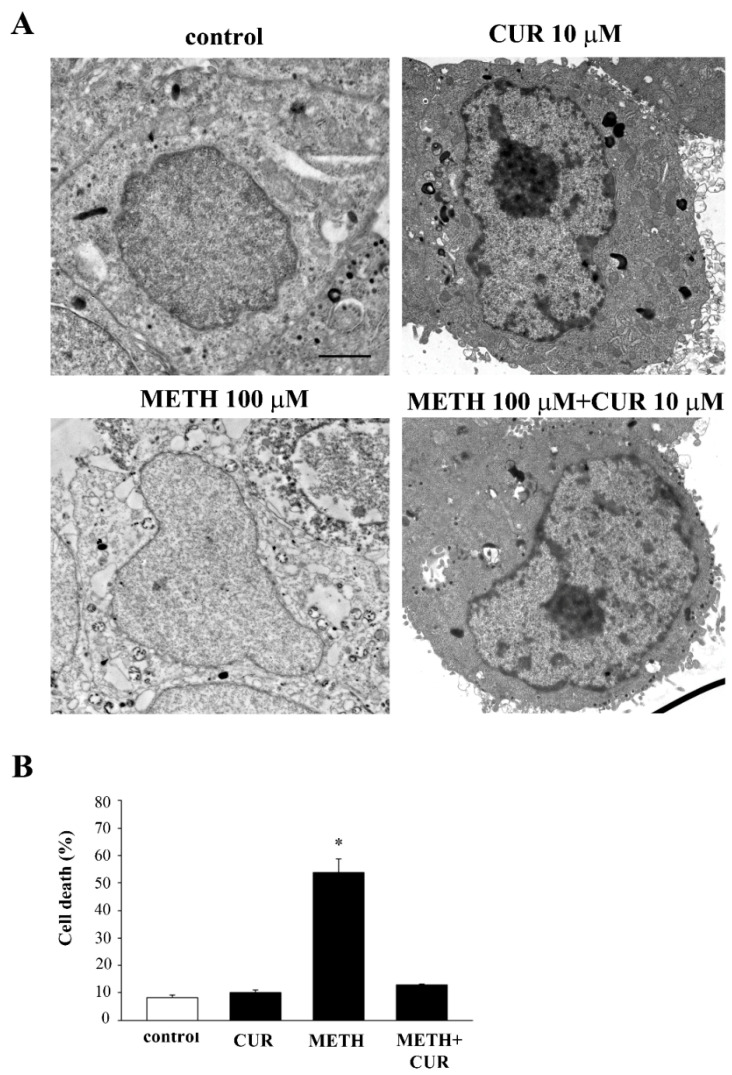
Curcumin (CUR), a natural polyphenol extracted from rhizome of the Curcuma longa L, has received great attention for its multiple potential health benefits as well as disease prevention. For instance, CUR protects against toxic agents acting on the human body, including the nervous system. In detail, CUR possesses, among others, strong effects as an autophagy activator. The present study indicates that CUR counteracts methamphetamine (METH) toxicity. Such a drug of abuse is toxic by disturbing the autophagy machinery. We profited from an unbiased, low variable cell context by using rat pheochromocytoma PC12 cell line. In such a system, a strong protection was exerted by CUR against METH toxicity. This was associated with increased autophagy flux, merging of autophagosomes with lysosomes and replenishment of autophagy vacuoles with LC3, which instead is moved out from the vacuoles by METH. This is expected to enable the autophagy machinery. In fact, while in METH-treated cells the autophagy substrates α-synuclein accumulates in the cytosol, CUR speeds up α-synuclein clearance. Under the effects of CUR LC3 penetrate in autophagy vacuoles to commit them to cell clearance and promotes the autophagy flux. The present data provide evidence that CUR counteracts the neurotoxic effects induced by METH by promoting autophagy.

Keywords: Curcuma longa; LC3; PC12 cells; autophagy; drug of abuse; natural polyphenol; α-synuclein.


Conflict of interest statement

The authors declare no conflict of interest.

Figures

Figure 1
Figure 1
Effects of CUR on PC12 cell survival. PC12 cells were treated for 72 h with increasing doses of CUR (0.1 μM, 1 μM, 10 μM and 50 μM). Then, cell viability was measured both in control and CUR-treated cells following (A) H&E staining, (B) WST-1 assay and (C) TB staining. * p ≤ 0.05 compared with control.
Figure 2
Figure 2
FJB-responsive PC12 cells after increasing doses of CUR. (A) Representative pictures of FJB-stained PC12 cells after CUR administration ranging from 0.1 μM up to 50 μM for 72 h. The graphs (B,C) report the number and the intensity of FJB fluorescent cells, respectively. Arrows indicate FJB intensely positive cells. * p ≤ 0.05 compared with control. Scale bar = 17.5 μM.
Figure 3
Figure 3
CUR induces apoptosis. Representative flow cytometry profiles and the related histogram reporting the sub-G1 peak after treatment with CUR for (A) 24 h (50 μM) and (B) 72 h (10 μM and 50 μM), compared with untreated control cells. Data related to serum starvation were shown as positive control. * p ≤ 0.05 compared with control.
Figure 3
Figure 3
CUR induces apoptosis. Representative flow cytometry profiles and the related histogram reporting the sub-G1 peak after treatment with CUR for (A) 24 h (50 μM) and (B) 72 h (10 μM and 50 μM), compared with untreated control cells. Data related to serum starvation were shown as positive control. * p ≤ 0.05 compared with control.
Figure 4
Figure 4
CUR 50 μM increases the cleaved form of caspase 3. (A) Representative pictures showing caspase 3-immunofluorescent PC12 cells after CUR administration ranging from 0.1 μM up to 50 μM for 72 h. Immunoblotting for caspase 3 (B) and the related graph reporting the optical density (C). The primary antibody recognizes the cleaved form of caspase 3. Blot at 50 kDa represents non-specific caspase 3 substrates which are also detected at WB. Arrows indicate caspase 3 positive cells. * p ≤ 0.05 compared with control. Scale bar = 7.3 μM.
Figure 5
Figure 5
CUR 50 μM increases the number of apoptotic cells. (A) Representative micrographs of PC12 cells of control and following CUR 50 μM for 72 h. (B) The histogram reports the number of apoptotic PC12 cells counted at TEM after CUR administration ranging from 0.1 μM up to 50 μM for 72 h. * p ≤ 0.05 compared with control. Scale bar = 1 μM.
Figure 6
Figure 6
CUR treatment induces morphological changes in PC12 cells. (A) Representative pictures of H&E-stained PC12 cells after CUR administration ranging from 0.1 μM up to 10 μM for 72 h. The increased size of the cell body in CUR-treated cells is evident, as reported in the graph (B). Histogram (C) shows the Polarization Index as the ratio between the maximum and minimum cell diameter. * p ≤ 0.05 compared with control. Scale bar = 19.4 μM.
Figure 7
Figure 7
METH dose-dependently affects PC12 cell survival. PC12 cell survival decreases after increasing doses of METH (1 μM, 10 μM, 100 μM, 1000 μM) for 72 h dose-dependently. Cell viability was evaluated with (A) H&E staining, (B) WST-1 activity (C) TB-positivity. * p ≤ 0.05 compared with control.
Figure 8
Figure 8
Dose-dependent Fluoro-Jade B-responsiveness of PC12 cells after METH exposure. (A) Representative pictures of FJB-stained PC12 cells after METH administration ranging from 1 μM up to 1000 μM for 72 h. The graphs shows the number (B) and intensity (C) of FJB fluorescent cells (arrows). * p ≤ 0.05 compared with control. Scale bar = 17.1 μM.
Figure 9
Figure 9
Dose-dependent METH-induced morphological changes in PC12 cells. (A) Representative pictures of H&E-stained PC12 cells after METH administration. Cytosolic pale vacuoles (arrows). (B) Graph reports the maximum cell diameter and the Polarization Index (C). Scale bar = 24.3 μM.
Figure 10
Figure 10
CUR prevents METH-induced toxicity in PC12 cells. After administration of METH, alone or in combination with CUR for 72 h, PC12 cell survival was assessed through (A) H&E staining, (B) WST-1 assay and (C) TB staining. * p ≤ 0.05 compared with control; ** p ≤ 0.05 compared with METH; *** p ≤ 0.05 compared with METH 1000 μM + CUR 1 μM.
Figure 11
Figure 11
CUR decreases METH-induced FJB-responsiveness in PC12 cells. (A) Representative pictures of FJB-stained PC12 cells after various treatments The graphs (B,C) report the number and the intensity of FJB fluorescent cells, respectively. Arrows indicate FJB intensely positive cells. * p ≤ 0.05 compared with control; ** p ≤ 0.05 compared with METH 100 μM; *** p ≤ 0.05 compared with METH 1000 μM + CUR 1 μM. Scale bar = 17.3 μM.
Figure 11
Figure 11
CUR decreases METH-induced FJB-responsiveness in PC12 cells. (A) Representative pictures of FJB-stained PC12 cells after various treatments The graphs (B,C) report the number and the intensity of FJB fluorescent cells, respectively. Arrows indicate FJB intensely positive cells. * p ≤ 0.05 compared with control; ** p ≤ 0.05 compared with METH 100 μM; *** p ≤ 0.05 compared with METH 1000 μM + CUR 1 μM. Scale bar = 17.3 μM.
Figure 12
Figure 12
CUR prevents METH-induced morphological alterations. (A) Representative pictures of H&E-stained PC12 cells after various treatments. Cytosolic vacuoles occurs in METH-treated cells (arrows). (B) Maximum cell diameter and (C) Polarization index are reported. * p < 0.05 compared with control. Scale bar = 19.5 μM.
Figure 12
Figure 12
CUR prevents METH-induced morphological alterations. (A) Representative pictures of H&E-stained PC12 cells after various treatments. Cytosolic vacuoles occurs in METH-treated cells (arrows). (B) Maximum cell diameter and (C) Polarization index are reported. * p < 0.05 compared with control. Scale bar = 19.5 μM.
Figure 13
Figure 13
METH dose-dependently induces expression of α-synuclein. Representative immunocytochemistry for α-synuclein following METH. Scale bar = 19.2 μM.
Figure 14
Figure 14
CUR mitigates the expression of α-synuclein in control and METH-treated cells. (A) Representative immunostaining for α-synuclein. (B) Representative immunoblotting for α-synuclein and β-actin in control and PC12 treated cells and the related optical densities (C). (Ctrl = control; M = METH 100 μM; C0.1 = CUR 0.1 μM; C1 = CUR 1 μM; M + C0.1 = METH 100 μM + CUR 0.1 μM; M + C1 = METH 100 μM + CUR 1 μM); * p < 0.05 compared with control. Scale bar = 16.1 μM.
Figure 14
Figure 14
CUR mitigates the expression of α-synuclein in control and METH-treated cells. (A) Representative immunostaining for α-synuclein. (B) Representative immunoblotting for α-synuclein and β-actin in control and PC12 treated cells and the related optical densities (C). (Ctrl = control; M = METH 100 μM; C0.1 = CUR 0.1 μM; C1 = CUR 1 μM; M + C0.1 = METH 100 μM + CUR 0.1 μM; M + C1 = METH 100 μM + CUR 1 μM); * p < 0.05 compared with control. Scale bar = 16.1 μM.
Figure 15
Figure 15
CUR induces autophagy. (A) WB for LC3-II levels and (B) related optical density graph in PC12 cells treated with CUR and the late autophagy inhibitor bafilomycin A1. Ctrl = control; Baf = bafilomycin A1 * p < 0.05 compared with control; ** p < 0.05 compared with control and Baf.
Figure 16
Figure 16
CUR increases LC3 immunofluorescence in control and METH-treated PC12 cells. (A) Immunofluorescence for LC3. Arrows indicate fluorescent puncta and bigger immunofluorescence agglomerates. (B) The graph reports the intensity of the immunofluorescence measured as optical density. * p < 0.05 compared with control; ** p < 0.05 compared with METH. Scale bar = 14.2 μM.
Figure 16
Figure 16
CUR increases LC3 immunofluorescence in control and METH-treated PC12 cells. (A) Immunofluorescence for LC3. Arrows indicate fluorescent puncta and bigger immunofluorescence agglomerates. (B) The graph reports the intensity of the immunofluorescence measured as optical density. * p < 0.05 compared with control; ** p < 0.05 compared with METH. Scale bar = 14.2 μM.
Figure 17
Figure 17
CUR increases the amount of LC3-positive vacuoles. (A) Representative TEM micrographs showing LC3-positive vacuoles (*) Arrows point to LC3 immuno-gold particles widespread in the cytosol. Graphs report the number of LC3-immunogold particles (B) and LC3-positive vacuoles (C) per cell. * p < 0.05 compared with control. Scale bar = 0.3 μm.
Figure 18
Figure 18
Inhibition of autophagy precipitates apoptotic cell death in METH-treated cells. (A) Representative pictures of caspase 3-immunofluorescent cells in PC 12 cells treated with CUR 10 μM, METH 100 μM, and the autophagy inhibitor 3MA. Immunoblotting for caspase 3 (B) and the related optical density graph (C) The primary antibody recognizes the cleaved form of caspase 3. Blot at 50 kDa represents non-specific caspase 3 substrates which are also detected at WB. Arrows indicate caspase 3 positive cells. ** p ≤ 0.05 compared with control and METH. Scale bar = 7.3 μM.
Figure 18
Figure 18
Inhibition of autophagy precipitates apoptotic cell death in METH-treated cells. (A) Representative pictures of caspase 3-immunofluorescent cells in PC 12 cells treated with CUR 10 μM, METH 100 μM, and the autophagy inhibitor 3MA. Immunoblotting for caspase 3 (B) and the related optical density graph (C) The primary antibody recognizes the cleaved form of caspase 3. Blot at 50 kDa represents non-specific caspase 3 substrates which are also detected at WB. Arrows indicate caspase 3 positive cells. ** p ≤ 0.05 compared with control and METH. Scale bar = 7.3 μM.
Figure 19
Figure 19
CUR prevents cell death. (A) Representative micrographs of PC12 cells showing a typical slow necrosis following METH administration. (B) The histogram reports the percentage of cell death (slow necrosis) counted at TEM. * p ≤ 0.05 compared with the other groups. Scale bar = 0.5 μM.
Figure 20
Figure 20
CUR induces autophagy in METH-treated cells. Immunoblotting for LC3-I and LC3-II (A) and p62 (B) and the graphs reporting the related optical densities (C and D, respectively). * p ≤ 0.05 compared with control.
Figure 21
Figure 21
CUR increases, while 3MA reduces, LC3 and cathepsin D co-localization. Representative pictures showing double immunofluorescence for LC3 (green) and cathepsin D (red), and their merge. PC12 cells were treated for 72 h with CUR 10 μM, METH 100 μM, and the autophagy inhibitor 3MA. Arrows indicate cells with intensely merged fluorescence resulting in yellow puncta. Scale bar = 11.4 μM.

Similar articles

Cited by

References

    1. Aggarwal B.B., Harikumar K.B. Potential therapeutic effects of curcumin, the anti-inflammatory agent, against neurodegenerative, cardiovascular, pulmonary, metabolic, autoimmune and neoplastic diseases. Int. J. Biochem. Cell Biol. 2009;41:40–59. doi: 10.1016/j.biocel.2008.06.010. - DOI - PMC - PubMed
    1. Lim G.P., Chu T., Yang F., Beech W., Frautschy S.A., Cole G.M. The curry spice curcumin reduces oxidative damage and amyloid pathology in an Alzheimer transgenic mouse. J. Neurosci. 2001;21:8370–8377. doi: 10.1523/JNEUROSCI.21-21-08370.2001. - DOI - PMC - PubMed
    1. Menon V.P., Sudheer A.R. Antioxidant and anti-inflammatory properties of curcumin. Adv. Exp. Med. Biol. 2007;595:105–125. - PubMed
    1. Wang W., Xu J. Curcumin Attenuates Cerebral Ischemia-reperfusion Injury Through Regulating Mitophagy and Preserving Mitochondrial Function. Curr. Neurovasc. Res. 2020;17:113–122. doi: 10.2174/1567202617666200225122620. - DOI - PubMed
    1. Song J.X., Sun Y.R., Peluso I., Zeng Y., Yu X., Lu J.H., Xu Z., Wang M.Z., Liu L.F., Huang Y.Y., et al. A novel curcumin analog binds to and activates TFEB in vitro and in vivo independent of MTOR inhibition. Autophagy. 2016;12:1372–1389. doi: 10.1080/15548627.2016.1179404. - DOI - PMC - PubMed

LinkOut - more resources