

Optical Characterization of Ciprofloxacin Photolytic Degradation by UV-Pulsed Laser Radiation
- PMID: 33923649
- PMCID: PMC8073987
- DOI: 10.3390/molecules26082324
Optical Characterization of Ciprofloxacin Photolytic Degradation by UV-Pulsed Laser Radiation
Abstract
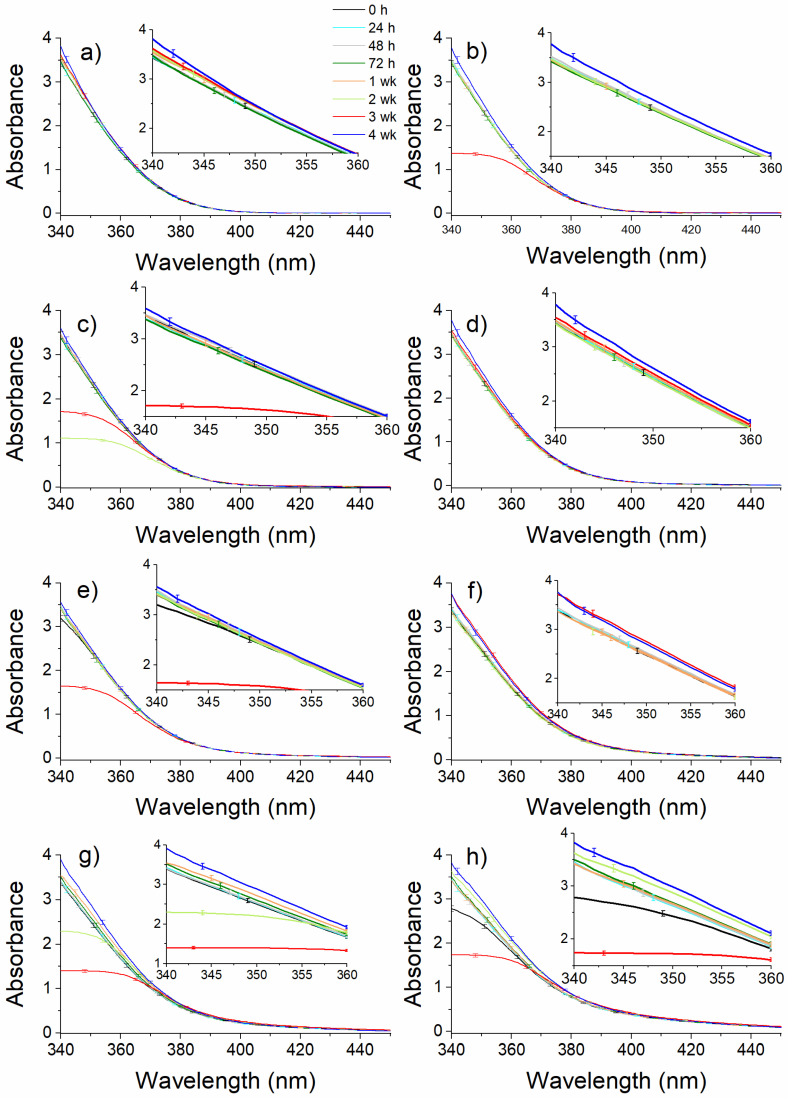
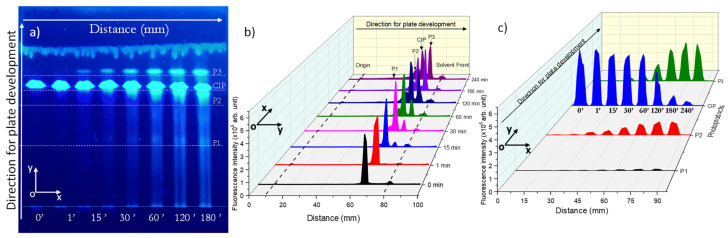
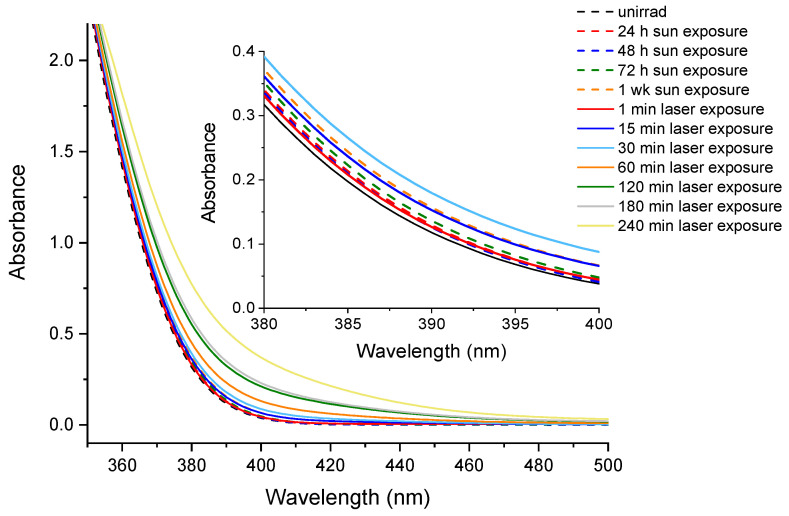
Ciprofloxacin is one of the most prescribed antibiotics in treating bacterial infections, becoming an important pollutant of the wastewaters. Moreover, ciprofloxacin is hard to be destroyed by conventional water treatment processes; therefore, efficient treatments to destroy it are needed in water decontamination. This study offers insights into the performance of 266 nm laser beams on the photodegradation of ciprofloxacin. An Nd:YAG laser was used that emitted 266 nm at an energy of 6.5 mJ (power of 65 mW) and ciprofloxacin water solutions were irradiated up to 240 min. The irradiated solutions were investigated by UV-Vis and FTIR absorption spectroscopy, pH assay, and laser-induced fluorescence. An HPTLC densitometer was used to characterize the laser-induced fluorescence and fluorescence lifetime of photodegradation products. The UV-Vis absorption, FTIR, and laser-induced fluorescence spectra showed the degradation of ciprofloxacin. Moreover, HPTLC densitometry offered the fluorescence and fluorescence lifetime of ciprofloxacin and its three photoproducts as well as their relative quantification. From the FTIR spectra, the molecular structure of two out of three photoproducts was proposed. In conclusion, the laser irradiation method provided the efficient photodegradation of ciprofloxacin, whereas the analytical techniques offered the proper means to monitor the process and detect the obtained photoproducts.
Keywords: FTIR; HPTLC densitometry; absorption spectroscopy; ciprofloxacin; fluorescence; laser degradation.
Conflict of interest statement
The authors declare no conflict of interest.
Figures


References
-
- Ciprofloxacin Monograph for Professionals. [(accessed on 20 March 2021)]; Available online: https://www.drugs.com/monograph/ciprofloxacin.html.
-
- World Health Organization . Model List of Essential Medicines, 21st List, 2019. World Health Organization; Geneva, Switzerland: 2019. [(accessed on 20 March 2021)]. Licence: CC BY-NC-SA 3.0 IGO. Available online: https://apps.who.int/iris/handle/10665/325771.
-
- Ciprofloxacin—Drug Usage Statistics, ClinCalc DrugStats Database. [(accessed on 8 February 2021)]; Available online: https://clincalc.com/DrugStats/Drugs/Ciprofloxacin.
MeSH terms
Substances
Grants and funding
- PN-III-P1-1.1-PD-2016-1072/Romanian National Authority for Scientific Research and Innovation, CNCS/CCCDI-UEFISCDI
- PN-III-P1-1.1-PD-2019-1117/Romanian National Authority for Scientific Research and Innovation, CNCS/CCCDI-UEFISCDI
- NUCLEU Program 16N/08.02.2019/MINISTRY OF RESEARCH, INNOVATION AND DIGITIZATION
LinkOut - more resources
Full Text Sources
Other Literature Sources
