. 2021 Apr 16;21(8):2815.
doi: 10.3390/s21082815.

Real-Time Vehicle Positioning and Mapping Using Graph Optimization

Affiliations

Real-Time Vehicle Positioning and Mapping Using Graph Optimization

Anweshan Das et al. Sensors (Basel). .

Abstract

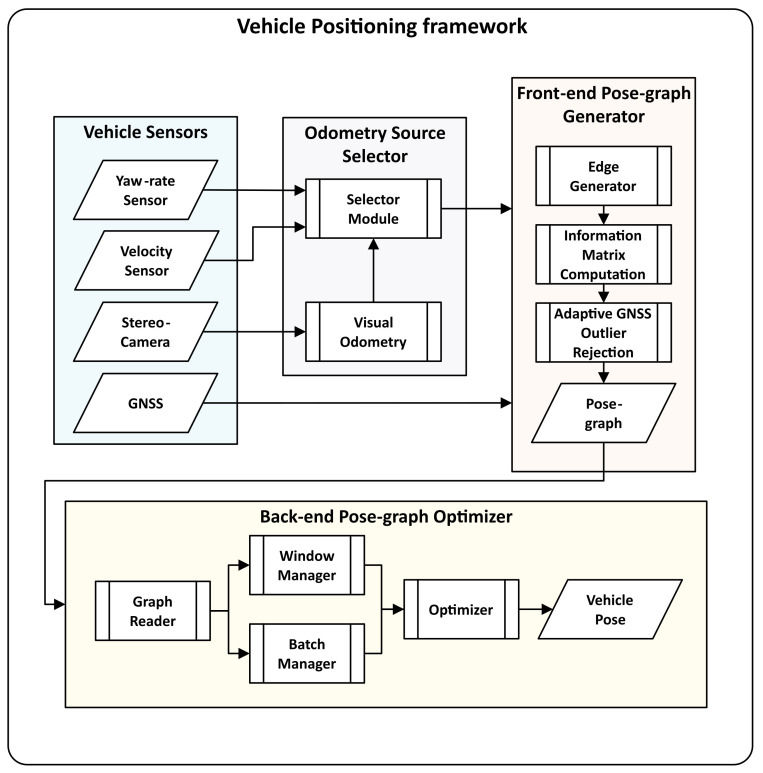
In this work, we propose and evaluate a pose-graph optimization-based real-time multi-sensor fusion framework for vehicle positioning using low-cost automotive-grade sensors. Pose-graphs can model multiple absolute and relative vehicle positioning sensor measurements and can be optimized using nonlinear techniques. We model pose-graphs using measurements from a precise stereo camera-based visual odometry system, a robust odometry system using the in-vehicle velocity and yaw-rate sensor, and an automotive-grade GNSS receiver. Our evaluation is based on a dataset with 180 km of vehicle trajectories recorded in highway, urban, and rural areas, accompanied by postprocessed Real-Time Kinematic GNSS as ground truth. We compare the architecture's performance with (i) vehicle odometry and GNSS fusion and (ii) stereo visual odometry, vehicle odometry, and GNSS fusion; for offline and real-time optimization strategies. The results exhibit a 20.86% reduction in the localization error's standard deviation and a significant reduction in outliers when compared with automotive-grade GNSS receivers.

Keywords: multi-sensor fusion; pose-graph optimization; vehicle localization.


Conflict of interest statement

The authors declare no conflict of interest.

Figures

Figure 1
Figure 1
Multi-sensor fusion for vehicle positioning and mapping using automotive-grade sensors. The sensor data are used to model a pose-graph, which is then optimized in real-time to estimate the vehicle’s accurate pose and generate a map.
Figure 2
Figure 2
A simple graph before (a) and after (b) optimization [29]. The initial node Xi is kept fixed. The node Xj is at its initial position before optimization. The nodes Xi and Xj are connected by an edge (measurement) Zij. The black dashed circle visualizes the measured position of node Xj contained in the edge Zij. The error vector eij before optimization is depicted as a red dashed line. After the optimization, this error is minimized by moving node Xj to the position according to the measurement contained in Zij.
Figure 3
Figure 3
PGraph modeling strategies G1, G2, and G3, in (ac), respectively [29]. The black circles are the absolute vehicle poses initialized from the odometry, and the black arrows are the corresponding edges. The blue arrows are the GNSS edges connecting the UTM origin node (black circle with a cross) with the corresponding nodes. In (a), the black dashed circles represent the GNSS readings, and the error is depicted by a red dashed line. In (b), the blue circles are the GNSS readings nodes. The green arrows represent the (virtual) identity edges. In (c), The blue circles with crosses are the GNSS nodes that are kept fixed during optimization.
Figure 4
Figure 4
Pose-graph based sensor fusion framework for vehicle positioning and mapping.
Figure 5
Figure 5
Circle feature matching process. The green boxes represent the matched feature point and the blue boxes represent the search space. The red arrows represent the sequence of the matching process.
Figure 6
Figure 6
The red arrows represent a window; a new window is generated at every multiple of w meters traveled by the vehicle, with all the nodes contained in the last l meters of the last optimized window, which creates a hopping effect [30].
Figure 7
Figure 7
The red arrow represents a pose-graph window; the window size increases with every new measurement and is optimized after the vehicle travels every b meters [30].
Figure 8
Figure 8
Overview of our eight datasets recorded around Eindhoven, The Netherlands. Each dataset is depicted in a different color [29].
Figure 9
Figure 9
(ah) shows the GNNS position errors with respect to the postprocessed RTK-GNSS ground truth for the eight datasets. The plots with a tile size of 2 × 2 m, clearly show that GNSS errors are biased and correlated, causing nonzero mean behavior for time spans up to 65 min [29].
Figure 10
Figure 10
(a) Batch size vs. average precision plot for different window sizes (500, 1000, 1500, 2000, 2500 in meters) of all datasets [30]. (b) Batch size vs. total time plot for different window sizes. The configuration with a window of 1500 m and a batch size of 40 m is marked with a black dot [30].
Figure 11
Figure 11
(a,b) shows the average computation time and the update frequency for one optimization iteration for different batch sizes, respectively [30].
Figure 12
Figure 12
(ac) shows the fusion results projected onto the Google map. (df) shows the fusion results projected on to the Google street view. Where, RTK GNSS (red), GNSS (yellow), Offline Global optimization of vehicle odometry and GNSS (GO1) in blue, incremental hopping window optimization of vehicle odometry and GNSS (LO1) in green, Offline Global optimization of SVO, vehicle odometry and GNSS (GO2) in orange, incremental hopping window optimization of SVO, vehicle odometry and GNSS (LO2) in pink.

References

    1. SAE, J3016 . Taxonomy and Definitions for Terms Related to On-Road Motor Vehicle Automated Driving Systems. SAE International; Warrendale, PA, USA: 2014. Technical Report.
    1. Han H., Wang J., Wang J., Tan X. Performance Analysis on Carrier Phase-Based Tightly-Coupled GPS/BDS/INS Integration in GNSS Degraded and Denied Environments. Sensors. 2015;15:8685–8711. doi: 10.3390/s150408685. - DOI - PMC - PubMed
    1. Cai C., He C., Santerre R., Pan L., Cui X., Zhu J. A comparative analysis of measurement noise and multipath for four constellations: GPS, BeiDou, GLONASS and Galileo. Surv. Rev. 2016;48:287–295. doi: 10.1179/1752270615Y.0000000032. - DOI
    1. Godha S., Cannon M.E. GPS/MEMS INS integrated system for navigation in urban areas. GPS Solut. 2007;11:193–203. doi: 10.1007/s10291-006-0050-8. - DOI
    1. Caron F., Duflos E., Pomorski D., Vanheeghe P. GPS/IMU data fusion using multisensor Kalman filtering: Introduction of contextual aspects. Inf. Fusion. 2006;7:221–230. doi: 10.1016/j.inffus.2004.07.002. - DOI

Grants and funding

LinkOut - more resources