. 2021 Apr 16;12(4):583.
doi: 10.3390/genes12040583.

Computational and Transcriptomic Analysis Unraveled OsMATE34 as a Putative Anthocyanin Transporter in Black Rice (Oryza sativa L.) Caryopsis

Affiliations

Computational and Transcriptomic Analysis Unraveled OsMATE34 as a Putative Anthocyanin Transporter in Black Rice (Oryza sativa L.) Caryopsis

Enerand Mackon et al. Genes (Basel). .

Abstract

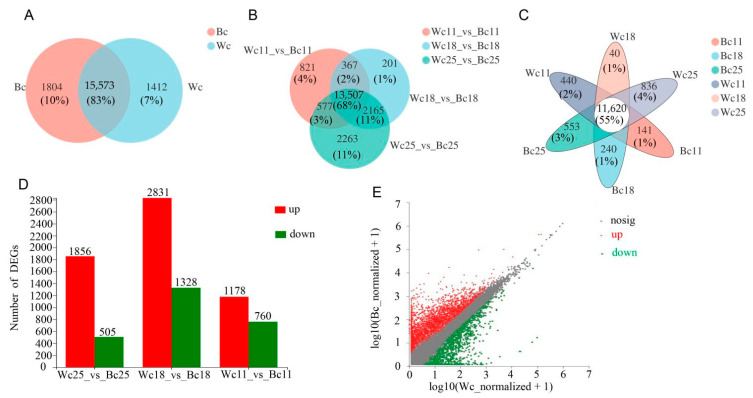
Anthocyanin is a flavonoid compound with potential antioxidant properties beneficial to human health and sustains plant growth and development under different environmental stresses. In black rice, anthocyanin can be found in the stems, leaves, stigmas, and caryopsis. Although the anthocyanin biosynthesis in rice has been extensively studied, limited knowledge underlying the storage mechanism and transporters is available. This study undertook the complementation of computational and transcriptome analysis to decipher a potential multidrug and toxic compound extrusion (MATE) gene candidate for anthocyanin transportation in black rice caryopsis. The phylogenetic analysis showed that OsMATE34 has the same evolutionary history and high similarities with VvAM1, VvAM3, MtMATE2, SlMATE/MTP77, RsMATE8, AtFFT, and AtTT12 involved in anthocyanin transportation. RNA sequencing analysis in black caryopsis (Bc; Bc11, Bc18, Bc25) and white caryopsis (Wc; Wc11, Wc18, Wc25), respectively, at 11 days after flowering (DAF), 18 DAF, and 25 DAF revealed a total of 36,079 expressed genes, including 33,157 known genes and 2922 new genes. The differentially expressed genes (DEGs) showed 15,573 genes commonly expressed, with 1804 and 1412 genes uniquely expressed in Bc and Wc, respectively. Pairwise comparisons showed 821 uniquely expressed genes out of 15,272 DEGs for Wc11 vs. Bc11, 201 uniquely expressed genes out of 16,240 DEGs for Wc18 vs. Bc18, and 2263 uniquely expressed genes out of 16,240 DEGs for Wc25 vs. Bc25. Along with anthocyanin biosynthesis genes (OsPAL, OsCHS, OsCHI, OsF3H, OsDFR, OsANS, and OsUFGT/Os3GT), OsMATE34 expression was significantly upregulated in all Bc but not in Wc. OsMATE34 expression was similar to OsGSTU34, a transporter of anthocyanin in rice leaves. Taken together, our results highlighted OsMATE34 (Os08g0562800) as a candidate anthocyanin transporter in rice caryopsis. This study provides a new finding and a clue to enhance the accumulation of anthocyanin in rice caryopsis.

Keywords: MATE transporters; anthoMATE; anthocyanin; anthocyanin’s transport mechanism; antioxidant; black rice caryopsis; cyanidin-3-glucoside; phylogenetic analysis.


Conflict of interest statement

The authors declare no conflict of interest.

Figures

Figure 1
Figure 1
Developmental stages of black and white caryopsis; (A) black rice caryopsis at milk stage 11 days after flowering (Bc11); (B) black rice caryopsis at dough stage 18 days after flowering (Bc18); (C) black rice caryopsis at mature stage 25 days after flowering (Bc25); (D) a cross section of black caryopsis 20 days after flowering; (E) white rice caryopsis at milk stage 11 days after flowering (Wc11); (F) white rice caryopsis at dough stage 18 days after flowering (Wc18); (G) white rice caryopsis at mature stage 25 days after flowering (Wc25); (H) a cross section of white rice caryopsis 20 days after flowering.
Figure 2
Figure 2
Molecular phylogenetic tree of OsMATEs proteins. Each color represents one cluster (CL): cluster1 (CL1), blue color; cluster2 (CL2), green color; cluster3 (CL3), red color; cluster4 (CL4), violet color.
Figure 3
Figure 3
Phylogenetic relationships and domain compositions of the MATE proteins. (A) The unrooted phylogenetic tree was constructed with 1000 bootstrap replicates based on multiple alignments of 38 MATE amino acid sequences. The four major subgroups are marked with a different colored line. Each color represents one cluster (CL): cluster1 (CL1), blue color; cluster2 (CL2), green color; cluster3 (CL3), red color; cluster4 (CL4), violet color. (B) Exon pattern, red boxes represent exons while lines represent introns. (C) The conserved motifs in the MATE proteins were identified using MEME, gray lines represent the non-conserved sequences. Each motif is indicated by a colored box numbered at the bottom. The length of the motifs in each protein is exhibited proportionally. Twelve motifs are illustrated using different colored boxes to get more information about the motif sequence, refer to Table S3.
Figure 4
Figure 4
Principal component analysis of replicates samples at different developmental stages. Wc11 = White caryopsis, 11 days after flowering; Wc18 = White caryopsis, 18 days after flowering; Wc25 = White caryopsis, 25 days after flowering; Bc11 = Black caryopsis, 11 days after flowering; Bc18 = Black caryopsis, 18 days after flowering; Bc25 = Black caryopsis, 25 days after flowering. The distance of each sample point represents the distance of the sample. The closer the distance, the higher the similarity between the samples. The horizontal axis represents the contribution of principal component 1 (PC1) to the distinguished sample in the two-dimensional graph, and the vertical axis represents the contribution of principal component 2 (PC2) to the distinguished sample in the two-dimensional graphs.
Figure 5
Figure 5
Comparison of transcript and gene abundance in black and white caryopsis. (A) Venn diagram of commonly expressed and unique genes in black and white rice caryopsis. (B) Venn diagram of the differentially expressed genes (DEGs) in the black and white caryopsis at different developmental stages. (C) Venn diagram of commonly expressed and uniquely expressed genes in a different sample at different stages. (D) The number of DEGs between black and white caryopsis at 25 DAF, 18 DAF, and 11 DAF. The red bars denote the upregulated genes and the green indicate the downregulated genes. (E) Scatter diagram with the abscissa and ordinate, respectively, represents the expression levels of genes in white and black caryopsis where the value of the abscissa and the ordinate were logarithmicized and each point represents a specific gene. Red dots show significantly upregulated, green dots represent genes that were significantly downregulated, and gray dots non-significantly different genes. The closer the point is to 0, the lower the expression level; the greater the deviation from the diagonal line, the greater the difference in expression of a gene between the two samples.
Figure 6
Figure 6
Gene ontology analysis of DEGs; results are shown in three categories: Biological Process (gray), Cellular Component (orange), and Molecular Function (violet); the left axis represents the number of genes of each term, while the Y-axis represents the GO term; different colored bars represent different comparisons.
Figure 7
Figure 7
GO and KEGG enrichment: (A) Bar diagram showing GO enrichment in Bc vs. Wc; MF indicates the category molecular function; CC, the category cellular component; BP, the category biological process. (B) Histogram showing KEGG enrichment in Bc vs. Wc; the ordinate represents the KEGG pathway and the abscissa represents the significance level of enrichment under p-adjust < 0.5, which corresponds to the height of the column. The smaller the FDR and the greater the −log10 (FDR) value, the more significantly enriched the KEGG pathway. Different colors indicate 4 enriched branches of the KEGG metabolic pathway: genetic information processing (GIP), environmental information processing (EIP), biological systems (OS), and metabolism (M).
Figure 8
Figure 8
Heatmap showing expression profile and cluster analysis of DEGs in different samples: (A) Expression profile of twenty-seven anthocyanin biosynthesis DEGs including putative transporters. (B) Heatmap representation and hierarchical clustering of the transporters genes of various samples in black and white caryopsis. The transcript data of six samples from rice caryopsis were used to reconstruct the expression patterns of genes. The clear boxes indicate that the transcript abundance is zero. The bar at the right side of the heat map represents the relative expression values; values below 0 represent downregulated expression and values above 0 represent upregulated expression.
Figure 9
Figure 9
Real-time quantitative PCR validation of transcriptome data for four selected DEGs in all samples. The data were obtained from three independent repeats.

Similar articles

Cited by

References

    1. Ali I., He L., Ullah S., Quan Z., Wei S., Iqbal A., Munsif F., Shah T., Xuan Y., Luo Y., et al. Biochar addition coupled with nitrogen fertilization impacts on soil quality, crop productivity, and nitrogen uptake under double-cropping system. Food Energy Secur. 2020;9:e208. doi: 10.1002/fes3.208. - DOI
    1. Ranganathan J., Waite R., Searchinger T., Hanson C. How to Sustainably Feed 10 Billion People by 2050, in 21 Charts. [(accessed on 10 April 2020)];World Res. Ins. 2018 Available online: https://www.wri.org/blog/2018/12/how-sustainably-feed-10-billion-people-....
    1. Mbanjo E.G.N., Kretzschmar T., Jones H., Ereful N., Blanchard C., Boyd L.A., Sreenivasulu N. The Genetic Basis and Nutritional Benefits of Pigmented Rice Grain. Front. Genet. 2020;11:229. doi: 10.3389/fgene.2020.00229. - DOI - PMC - PubMed
    1. Terungwa T.I., Yuguda M. The impact of rice production, consumption and importation in Nigeria: The political economy perspectives. Int. J. Sustain. Dev. World Policy. 2014;3:90–99.
    1. Hao J., Zhu H., Zhang Z., Yang S., Li H. Identification of anthocyanins in black rice (Oryza sativa L.) by UPLC/Q-TOF-MS and their in-vitro and in-vivo antioxidant activities. J. Cereal Sci. 2015;64:92–99. doi: 10.1016/j.jcs.2015.05.003. - DOI

Publication types

LinkOut - more resources