

Effect of Indoor Air Pollution on Chronic Obstructive Pulmonary Disease (COPD) Deaths in Southern Asia-A Systematic Review and Meta-Analysis
- PMID: 33923825
- PMCID: PMC8074040
- DOI: 10.3390/toxics9040085
Effect of Indoor Air Pollution on Chronic Obstructive Pulmonary Disease (COPD) Deaths in Southern Asia-A Systematic Review and Meta-Analysis
Abstract
Background: About half of the population in developing countries are exposed to indoor pollution such as combustion fuels at present. Chronic obstructive pulmonary disease (COPD) is one of the leading causes of mortality globally and the primary cause of COPD in women is indoor air pollution exposure, while tobacco smoking is the leading cause in men. The aim of this systematic review and meta-analysis is to evaluate the correlation between the indoor air pollution and deaths related to COPD and COPD prevalence in South Asia.
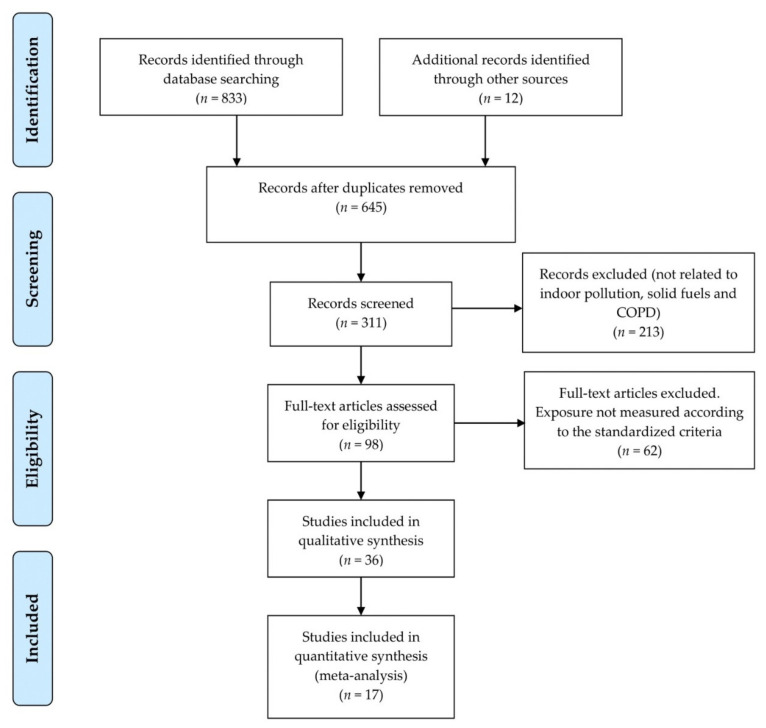
Methods: A systematic search on studies with sufficient statistical power has been conducted from 1985 until 30 June 2020, in English electronic databases following Preferred Reporting Items for Systematic Reviews and Meta-Analyses guidelines in MEDLINE and PubMed databases with the terms Chronic Obstructive Pulmonary disease COPD or Chronic Bronchitis or Emphysema or COPD Deaths or Chronic Obstructive Lung Disease or Airflow Obstruction or Chronic Airflow Obstruction or Airflow Obstruction, Chronic or Bronchitis, Chronic and Mortality or Death or Deceased was conducted. Studies were eligible if they were Prospective controlled or non-controlled trials conducted in Southern Asia/ Asia and Retrospective studies conducted in Southern Asia/ Asia.
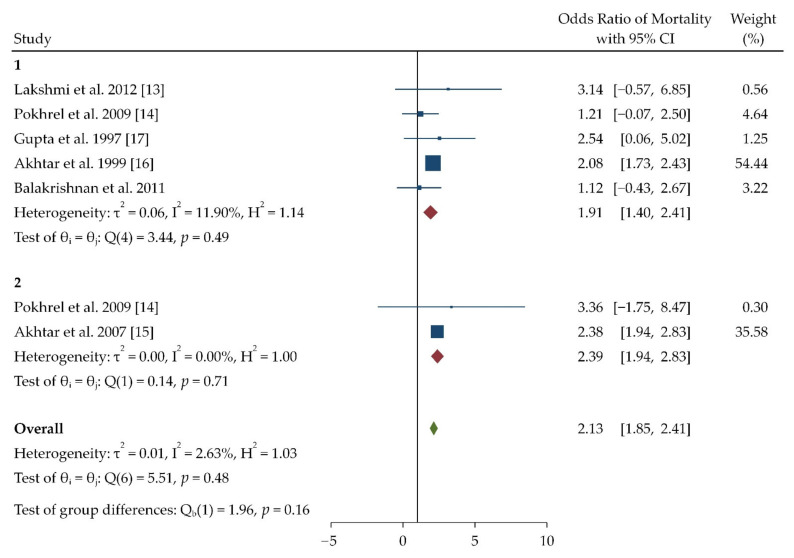
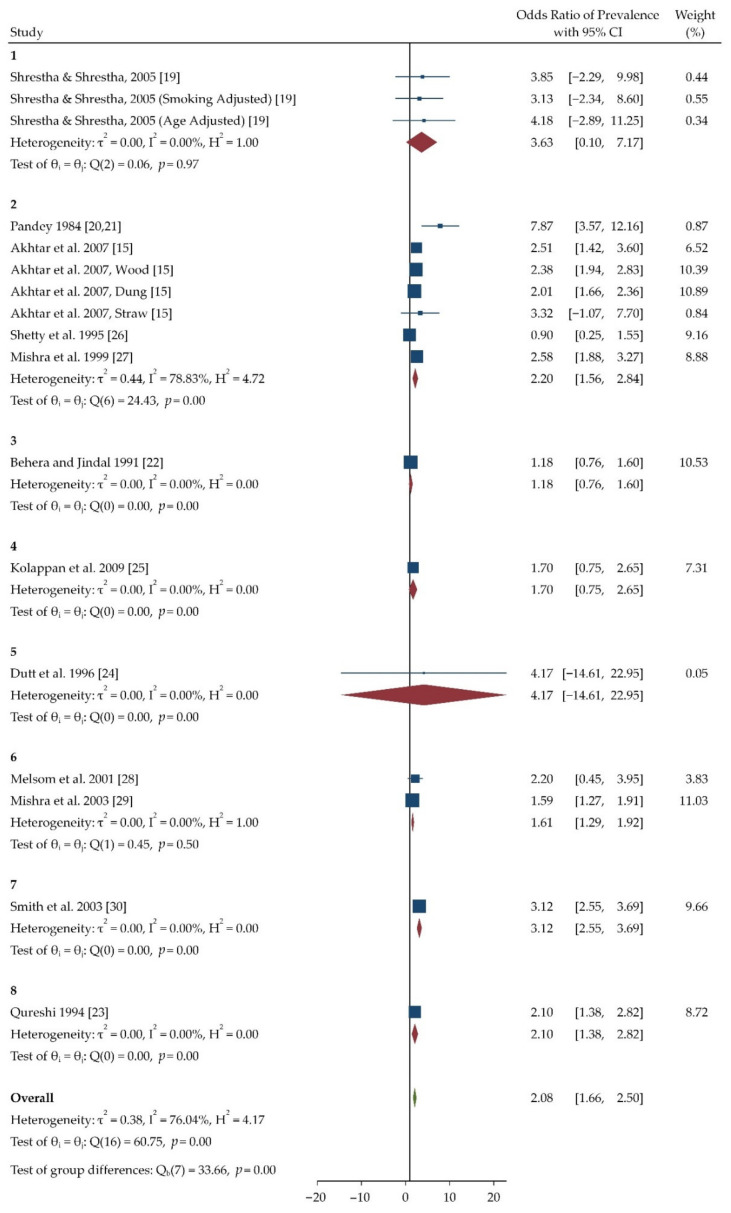
Results: The results have concluded that long term exposure to indoor pollution had a significant effect on COPD deaths as well as its symptoms. Odd's ratio was in a range of 1.05 (Randomized controlled trials) to 7.87 (Cross sectional studies) for all the studies mentioned. Meta-analysis observed a significantly higher Odds Ratio of 2.13 for COPD mortality and 2.08 for COPD prevalence on exposure to indoor air pollution.
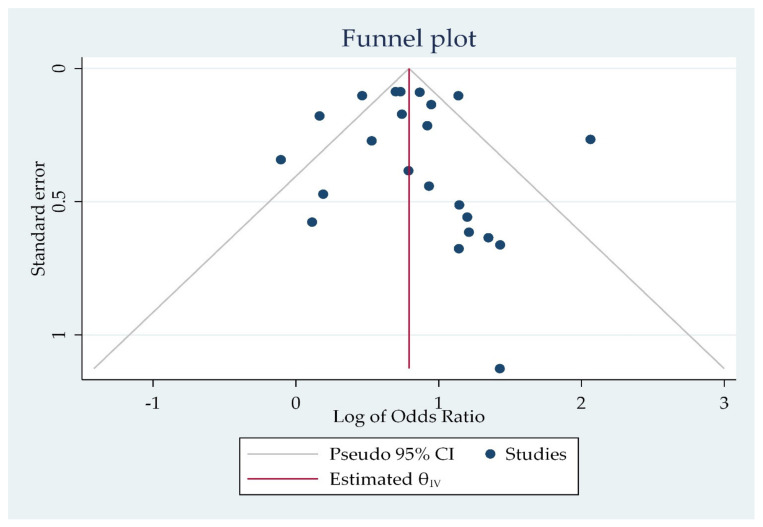
Conclusion: Exposure to solid fuel smoke is consistently and significantly correlated with COPD mortality and COPD prevalence in South Asian countries, in spite of heterogeneity observed in the studies included. For performing domestic tasks, initiatives are to be taken to reduce dependency on solid fuel by using cleaner alternatives or comparatively cleaner technology.
Keywords: COPD; South Asia; chronic obstructive pulmonary disease; death; indoor air pollution; indoor pollution; mortality.
Conflict of interest statement
The authors report no conflicts of interest in this work.
Figures
Similar articles
-
Risk of COPD due to indoor air pollution from biomass cooking fuel: a systematic review and meta-analysis.Int J Environ Health Res. 2020 Feb;30(1):75-88. doi: 10.1080/09603123.2019.1575951. Epub 2019 Feb 13. Int J Environ Health Res. 2020. PMID: 30754998
-
Chronic obstructive pulmonary disease associated with biomass fuel use in women: a systematic review and meta-analysis.BMJ Open Respir Res. 2018 Jan 12;5(1):e000246. doi: 10.1136/bmjresp-2017-000246. eCollection 2018. BMJ Open Respir Res. 2018. PMID: 29387422 Free PMC article.
-
Association between Household Air Pollution Exposure and Chronic Obstructive Pulmonary Disease Outcomes in 13 Low- and Middle-Income Country Settings.Am J Respir Crit Care Med. 2018 Mar 1;197(5):611-620. doi: 10.1164/rccm.201709-1861OC. Am J Respir Crit Care Med. 2018. PMID: 29323928 Free PMC article.
-
Household air pollution from domestic combustion of solid fuels and health.J Allergy Clin Immunol. 2019 Jun;143(6):1979-1987. doi: 10.1016/j.jaci.2019.04.016. J Allergy Clin Immunol. 2019. PMID: 31176380 Review.
-
Biomass fuels are the probable risk factor for chronic obstructive pulmonary disease in rural South China.Thorax. 2007 Oct;62(10):889-97. doi: 10.1136/thx.2006.061457. Epub 2007 May 4. Thorax. 2007. PMID: 17483137 Free PMC article.
Cited by
-
Chronic obstructive Pulmonary Disease (COPD) in non-smoking Sri Lankan adults; a cross-sectional study.BMC Res Notes. 2025 Feb 25;18(1):84. doi: 10.1186/s13104-025-07146-x. BMC Res Notes. 2025. PMID: 40001249 Free PMC article.
-
Impact of Acute Exacerbation and Its Phenotypes on the Clinical Outcomes of Chronic Obstructive Pulmonary Disease in Hospitalized Patients: A Cross-Sectional Study.Toxics. 2022 Nov 6;10(11):667. doi: 10.3390/toxics10110667. Toxics. 2022. PMID: 36355958 Free PMC article.
-
Chronic obstructive pulmonary disease across three decades: trends, inequalities, and projections from the Global Burden of Disease Study 2021.Front Med (Lausanne). 2025 Mar 24;12:1564878. doi: 10.3389/fmed.2025.1564878. eCollection 2025. Front Med (Lausanne). 2025. PMID: 40196348 Free PMC article.
-
COPD in females- Seeing through the smoke.Lung India. 2025 Jan 1;42(1):40-46. doi: 10.4103/lungindia.lungindia_366_24. Epub 2024 Dec 24. Lung India. 2025. PMID: 39718914 Free PMC article.
-
Identification of Modifiable Risk Factors of Exacerbations Chronic Respiratory Diseases with Airways Obstruction, in Vietnam.Int J Environ Res Public Health. 2022 Sep 4;19(17):11088. doi: 10.3390/ijerph191711088. Int J Environ Res Public Health. 2022. PMID: 36078802 Free PMC article.
References
-
- Smith K.R. Biomass Fuels, Air Pollution, and Health. A Global Review. Plenum Press; New York, NY, USA: 1987.
-
- Smith K.R., Apte M.G., Yuqing M., Wongsekiarttirat W., Kulkarni A. Air pollution and the energy ladder in Asian cities. Energy. 1994;19:587–600. doi: 10.1016/0360-5442(94)90054-X. - DOI
-
- IEA . WEO-2017 Special Report: Energy Access Outlook. IEA Webstore; Paris, France: 2017. [(accessed on 31 March 2021)]. Available online: https://webstore.iea.org/weo-2017-special-report-energy-access-outlook.
-
- Global Initiative for Chronic Obstructive Lung Disease . Global Strategy for the Diagnosis, Management, and Prevention of Chronic Obstructive Pulmonary Disease. Global Initiative for Chronic Obstructive Lung Disease, Inc.; Fontana, WI, USA: 2020. [(accessed on 8 March 2021)]. Available online: https://goldcopd.org.
Publication types
LinkOut - more resources
Full Text Sources
Other Literature Sources
