

Characteristics of Anti-SARS-CoV-2 Antibodies in Recovered COVID-19 Subjects
- PMID: 33923828
- PMCID: PMC8073159
- DOI: 10.3390/v13040697
Characteristics of Anti-SARS-CoV-2 Antibodies in Recovered COVID-19 Subjects
Abstract
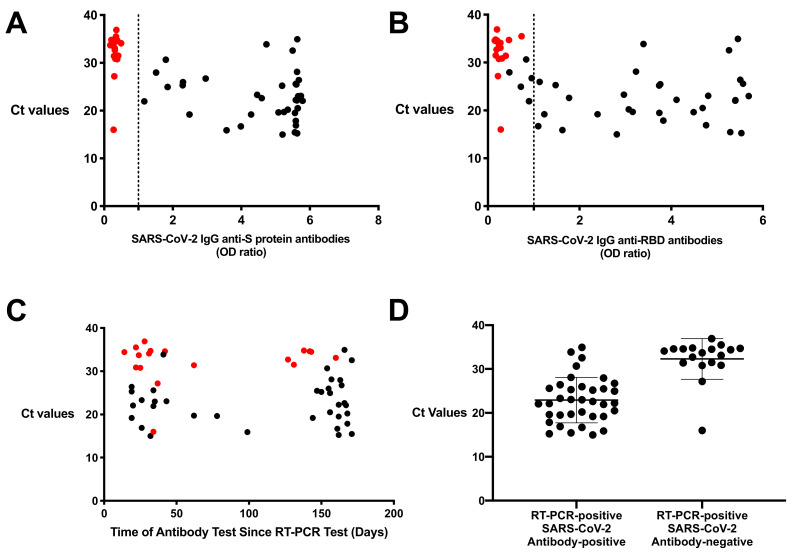
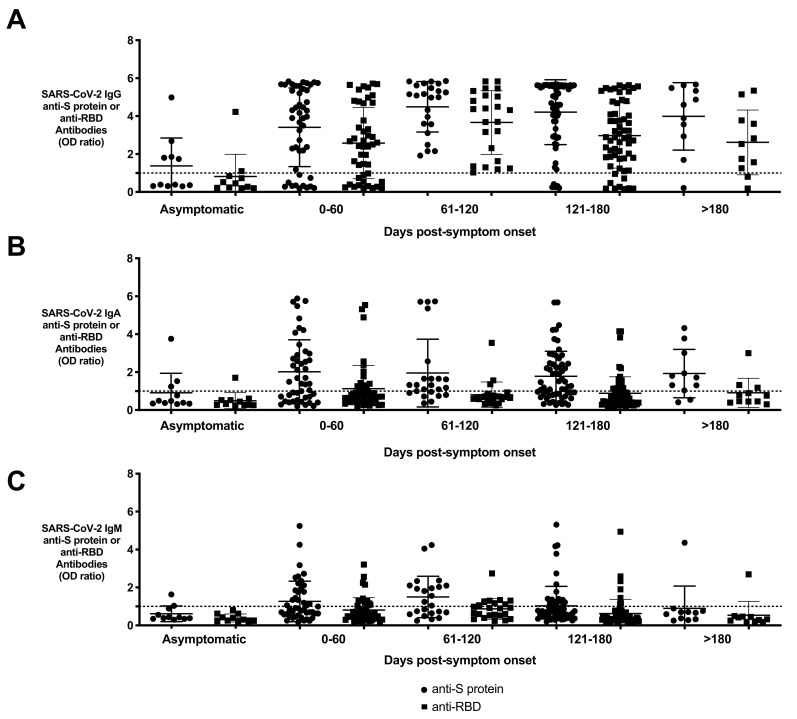
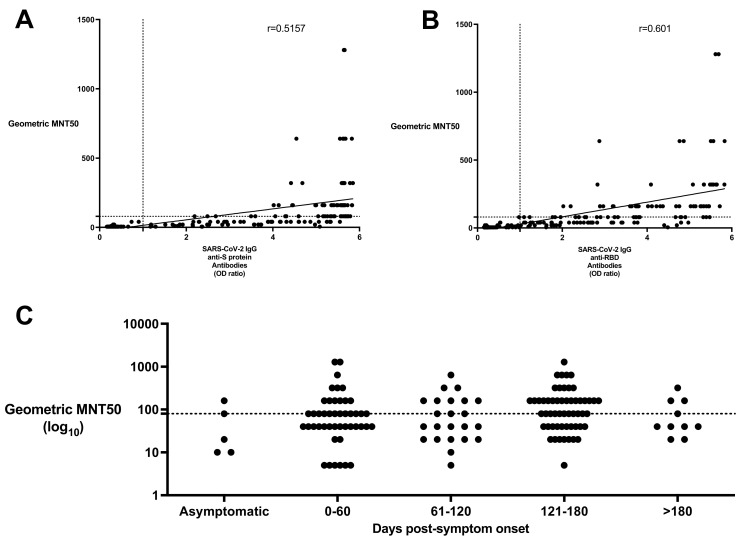
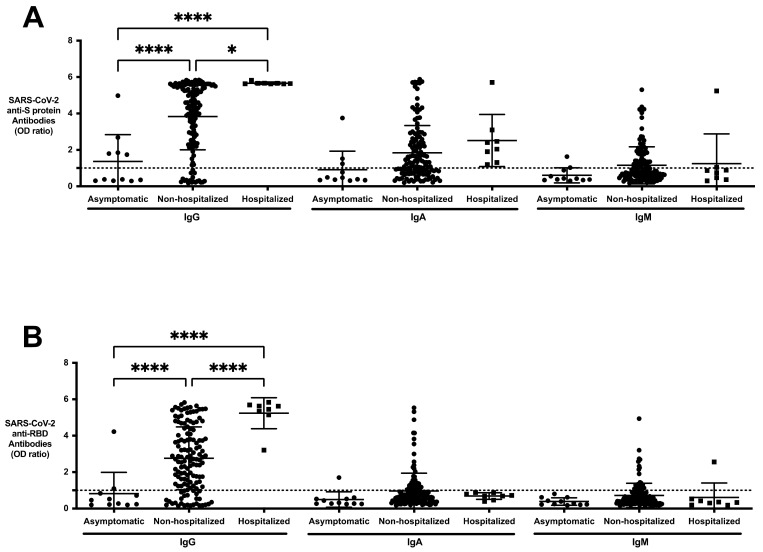
Coronavirus Disease 2019 (COVID-19) is a global pandemic caused by the novel severe acute respiratory syndrome coronavirus 2 (SARS-CoV-2). While detection of SARS-CoV-2 by polymerase chain reaction with reverse transcription (RT-PCR) is currently used to diagnose acute COVID-19 infection, serological assays are needed to study the humoral immune response to SARS-CoV-2. Anti-SARS-CoV-2 immunoglobulin (Ig)G/A/M antibodies against spike (S) protein and its receptor-binding domain (RBD) were characterized in recovered subjects who were RT-PCR-positive (n = 153) and RT-PCR-negative (n = 55) using an enzyme-linked immunosorbent assay (ELISA). These antibodies were also further assessed for their ability to neutralize live SARS-CoV-2 virus. Anti-SARS-CoV-2 antibodies were detected in 90.9% of resolved subjects up to 180 days post-symptom onset. Anti-S protein and anti-RBD IgG titers correlated (r = 0.5157 and r = 0.6010, respectively) with viral neutralization. Of the RT-PCR-positive subjects, 22 (14.3%) did not have anti-SARS-CoV-2 antibodies; and of those, 17 had RT-PCR cycle threshold (Ct) values > 27. These high Ct values raise the possibility that these indeterminate results are from individuals who were not infected or had mild infection that failed to elicit an antibody response. This study highlights the importance of serological surveys to determine population-level immunity based on infection numbers as determined by RT-PCR.
Keywords: COVID-19; SARS-CoV-2; antibody; serology.
Conflict of interest statement
The authors declare no conflict of interest.
Figures
Similar articles
-
Quantitative SARS-CoV-2 Serology in Children With Multisystem Inflammatory Syndrome (MIS-C).Pediatrics. 2020 Dec;146(6):e2020018242. doi: 10.1542/peds.2020-018242. Epub 2020 Sep 2. Pediatrics. 2020. PMID: 32879033
-
Comparative Analysis of Antigen-Specific Anti-SARS-CoV-2 Antibody Isotypes in COVID-19 Patients.J Immunol. 2021 May 15;206(10):2393-2401. doi: 10.4049/jimmunol.2001369. Epub 2021 May 3. J Immunol. 2021. PMID: 33941657 Clinical Trial.
-
Anti-SARS-CoV-2 Immunoglobulin Isotypes, and Neutralization Activity Against Viral Variants, According to BNT162b2-Vaccination and Infection History.Front Immunol. 2021 Dec 17;12:793191. doi: 10.3389/fimmu.2021.793191. eCollection 2021. Front Immunol. 2021. PMID: 34975897 Free PMC article.
-
A comparative review of immunoassays for COVID-19 detection.Expert Rev Clin Immunol. 2021 Jun;17(6):573-599. doi: 10.1080/1744666X.2021.1908886. Expert Rev Clin Immunol. 2021. PMID: 33787412 Review.
-
A Structural Landscape of Neutralizing Antibodies Against SARS-CoV-2 Receptor Binding Domain.Front Immunol. 2021 Apr 28;12:647934. doi: 10.3389/fimmu.2021.647934. eCollection 2021. Front Immunol. 2021. PMID: 33995366 Free PMC article. Review.
Cited by
-
Respiratory mucosal delivery of next-generation COVID-19 vaccine provides robust protection against both ancestral and variant strains of SARS-CoV-2.Cell. 2022 Mar 3;185(5):896-915.e19. doi: 10.1016/j.cell.2022.02.005. Epub 2022 Feb 9. Cell. 2022. PMID: 35180381 Free PMC article.
-
SARS-CoV-2 spike-dependent platelet activation in COVID-19 vaccine-induced thrombocytopenia.Blood Adv. 2022 Apr 12;6(7):2250-2253. doi: 10.1182/bloodadvances.2021005050. Blood Adv. 2022. PMID: 34724709 Free PMC article. No abstract available.
-
Performance estimation of two in-house ELISA assays for COVID-19 surveillance through the combined detection of anti-SARS-CoV-2 IgA, IgM, and IgG immunoglobulin isotypes.PLoS One. 2023 Feb 6;18(2):e0270388. doi: 10.1371/journal.pone.0270388. eCollection 2023. PLoS One. 2023. PMID: 36745590 Free PMC article.
-
Comparison of three dosing intervals for the primary vaccination of the SARS-CoV-2 mRNA Vaccine (BNT162b2) on magnitude, neutralization capacity and durability of the humoral immune response in health care workers: A prospective cohort study.PLoS One. 2023 Feb 15;18(2):e0281673. doi: 10.1371/journal.pone.0281673. eCollection 2023. PLoS One. 2023. PMID: 36791069 Free PMC article.
-
Validation of N Protein Antibodies to Diagnose Previous SARS-CoV-2 Infection in a Large Cohort of Healthcare Workers: Use of Roche Elecsys® Immunoassay in the S Protein Vaccination Era.Viruses. 2023 Apr 7;15(4):930. doi: 10.3390/v15040930. Viruses. 2023. PMID: 37112910 Free PMC article.
References
Publication types
MeSH terms
Substances
Grants and funding
LinkOut - more resources
Full Text Sources
Other Literature Sources
Medical
Miscellaneous
