. 2021 Apr 20;11(4):727.
doi: 10.3390/diagnostics11040727.

Imbalance of Mg Homeostasis as a Potential Biomarker in Colon Cancer

Affiliations

Imbalance of Mg Homeostasis as a Potential Biomarker in Colon Cancer

Davide Schiroli et al. Diagnostics (Basel). .

Abstract

Background: Increasing evidences support a correlation between magnesium (Mg) homeostasis and colorectal cancer (CRC). Nevertheless, the role of Mg and its transporters as diagnostic markers in CRC is still a matter of debate. In this study we combined X-ray Fluorescence Microscopy and databases information to investigate the possible correlation between Mg imbalance and CRC.

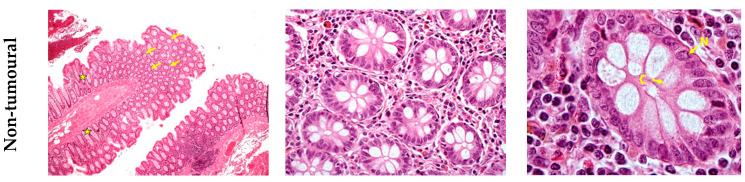
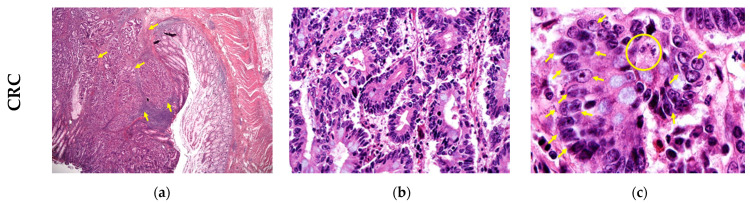
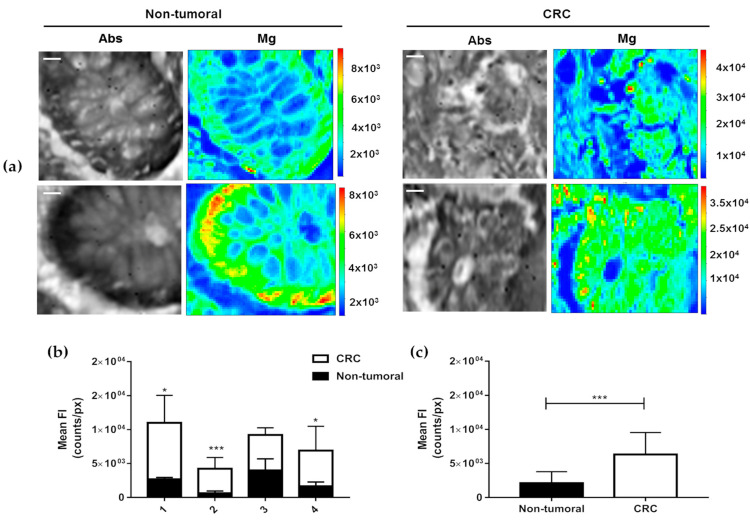
Methods: CRC tissue samples and their non-tumoural counterpart from four patients were collected and analysed for total Mg level and distribution by X-Ray Fluorescence Microscopy. We also reviewed the scientific literature and the main tissue expression databases to collect data on Mg transporters expression in CRC.

Results: We found a significantly higher content of total Mg in CRC samples when compared to non-tumoural tissues. Mg distribution was also impaired in CRC. Conversely, we evidenced an uncertain correlation between Mg transporters expression and colon malignancies.

Discussion: Although further studies are necessary to determine the correlation between different cancer types and stages, this is the first report proposing the measurement of Mg tissue localisation as a marker in CRC. This study represents thus a proof-of-concept that paves the way for the design of a larger prospective investigation of Mg in CRC.

Keywords: X-ray fluorescence microscopy; colon cancer; magnesium; magnesium homeostasis; magnesium transporters; synchrotron light source.


Conflict of interest statement

The authors declare no conflict of interest.

Figures

Figure 1
Figure 1
Histological inspection. Haematoxylin and eosin-stained representative regions of one out of four patients under study. Upper panel, non-tumoural adjacent colon shows the typical architecture with roundish (arrows) or elongated (stars) evenly spaced glandular structures lined by mucus secreting cells (a,b). In the lower panel, colorectal cancer presents crowded glands showing a cribriform or back-to-back growth pattern (arrows) (a,b). At higher magnification, normal gland shows a single layer of polarised cells with basal nuclei (N) and large cytoplasm (C) facing the lumen (c). Neoplastic glands show crowded enlarged nuclei (arrows) with prominent nucleolus and reduced cytoplasm. A mitotic figure is also present (see encircled nucleus) (c). The images were acquired at 40× (a) 400× (b) 1000× (c) magnification.
Figure 1
Figure 1
Histological inspection. Haematoxylin and eosin-stained representative regions of one out of four patients under study. Upper panel, non-tumoural adjacent colon shows the typical architecture with roundish (arrows) or elongated (stars) evenly spaced glandular structures lined by mucus secreting cells (a,b). In the lower panel, colorectal cancer presents crowded glands showing a cribriform or back-to-back growth pattern (arrows) (a,b). At higher magnification, normal gland shows a single layer of polarised cells with basal nuclei (N) and large cytoplasm (C) facing the lumen (c). Neoplastic glands show crowded enlarged nuclei (arrows) with prominent nucleolus and reduced cytoplasm. A mitotic figure is also present (see encircled nucleus) (c). The images were acquired at 40× (a) 400× (b) 1000× (c) magnification.
Figure 2
Figure 2
XRFM analysis. (a) Tissue morphology (Abs) and Mg content and distribution of non-tumoural colon epithelium (left panel) and CRC (right panel) tissues. The images shown are representative of the four patients under study; XRFM acquisition time= 6 s/pixel, Incident Energy= 1470 eV. Scale bars are 10 μm. Analysed areas: 78 × 78 μm2 and 78 × 60 μm2. (b) Mean fluorescence intensities of total Mg counts for each patient under study and (c) overall total Mg counts obtained considering all the Mg counts from each patient under study in non-tumoural adjacent and CRC tissues. Total counts were estimated by selecting the overall XRFM analysed areas and normalising the total counts by the size of area itself (pixels). Data are presented as mean ± SD. Non-tumoural (n = 21) and CRC (n = 15). The statistical significance was determined by Students’ t-test. * p-value < 0.05. *** p < 0.001.

References

    1. Jung G., Hernández-Illán E., Moreira L., Balaguer F., Goel A. Epigenetics of colorectal cancer: Biomarker and therapeutic potential. Nat. Rev. Gastroenterol. Hepatol. 2020;17:111–130. doi: 10.1038/s41575-019-0230-y. - DOI - PMC - PubMed
    1. Binefa G., Rodríguez-Moranta F., Teule A., Medina-Hayas M. Colorectal cancer: From prevention to personalized medicine. World J. Gastroenterol. 2014;20:6786–6808. doi: 10.3748/wjg.v20.i22.6786. - DOI - PMC - PubMed
    1. Bray F., Ferlay J., Soerjomataram I., Siegel R.L., Torre L.A., Jemal A. Global cancer statistics 2018: GLOBOCAN estimates of incidence and mortality worldwide for 36 cancers in 185 countries. CA Cancer J. Clin. 2018;68:394–424. doi: 10.3322/caac.21492. - DOI - PubMed
    1. Takeshima H., Ushijima T. Accumulation of genetic and epigenetic alterations in normal cells and cancer risk. NPJ Precis. Oncol. 2019;3:1–8. doi: 10.1038/s41698-019-0079-0. - DOI - PMC - PubMed
    1. Bardhan K., Liu K. Epigenetics and colorectal cancer pathogenesis. Cancers. 2013;5:676–713. doi: 10.3390/cancers5020676. - DOI - PMC - PubMed

LinkOut - more resources