. 2021 Apr 20;10(4):947.
doi: 10.3390/cells10040947.

The Role of Galectin-9 as Mediator of Atopic Dermatitis: Effect on Keratinocytes

Affiliations

The Role of Galectin-9 as Mediator of Atopic Dermatitis: Effect on Keratinocytes

Mab P Corrêa et al. Cells. .

Abstract

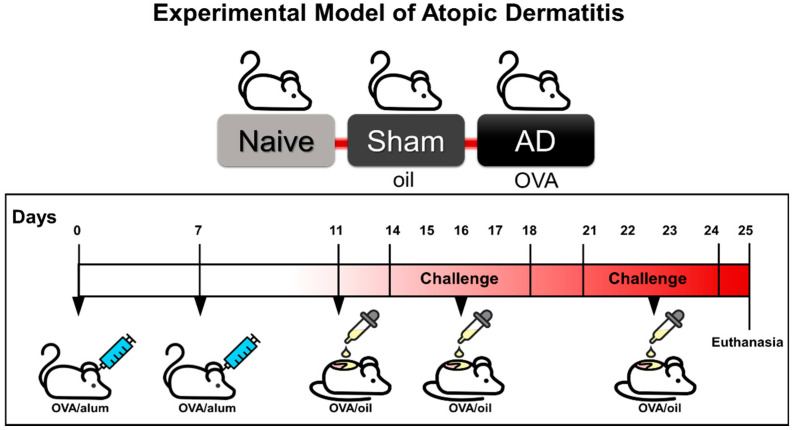
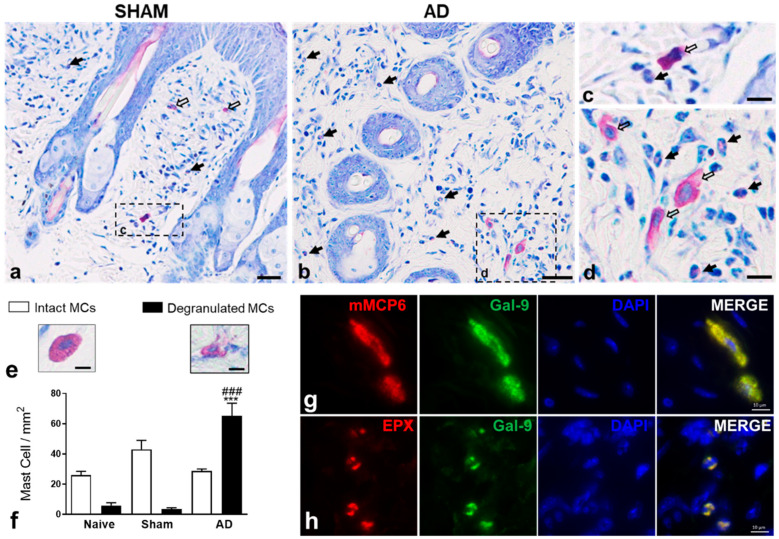
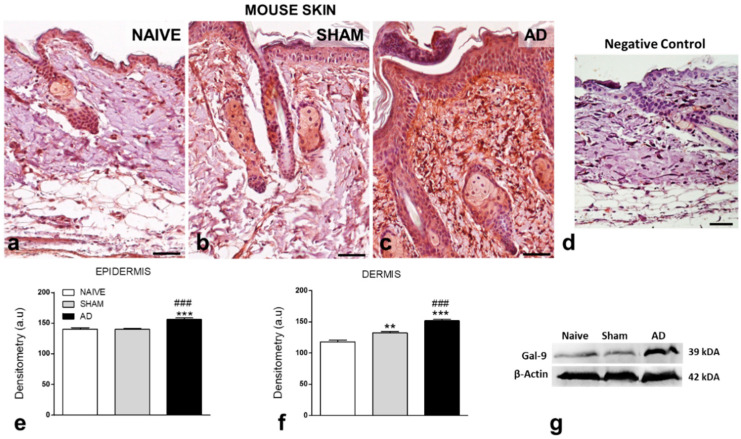
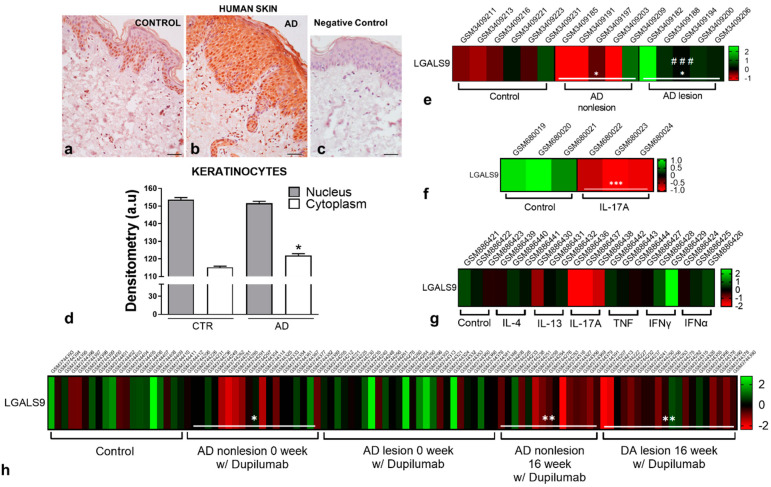
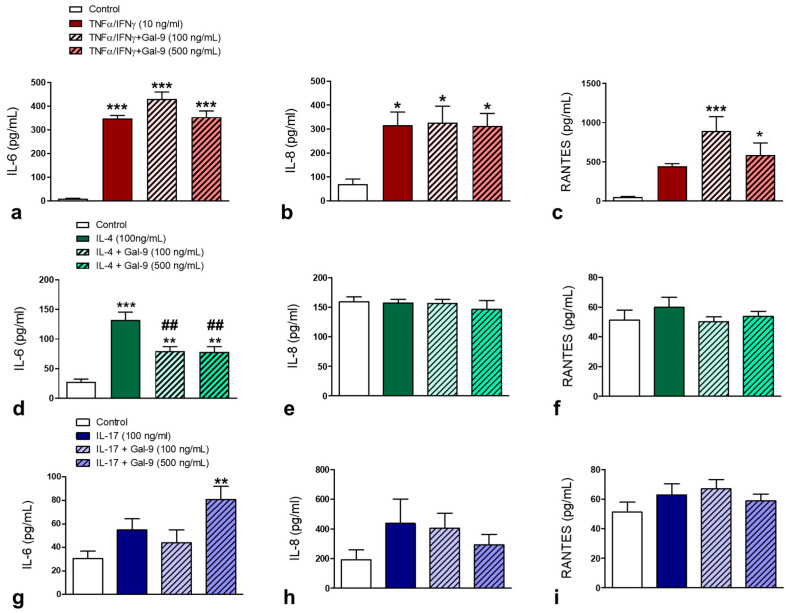
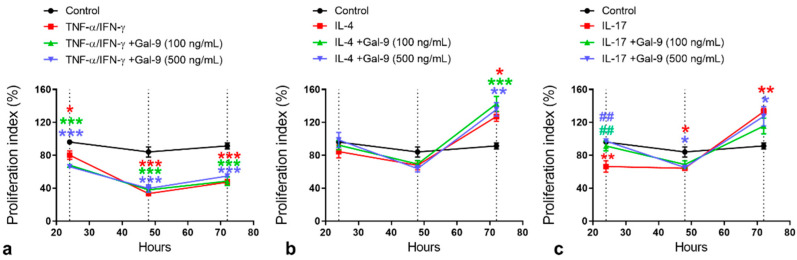
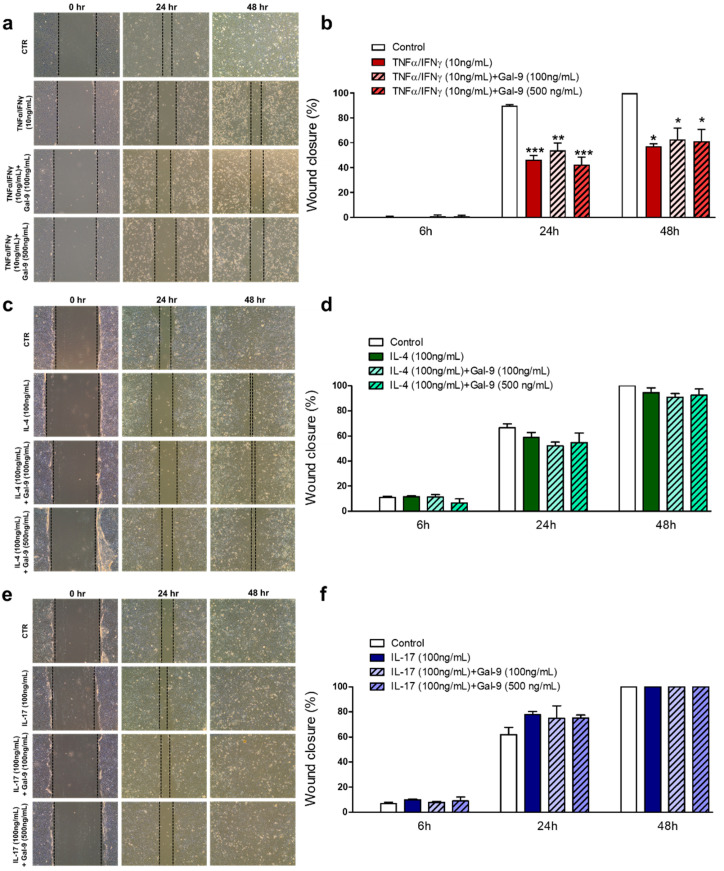
Galectin-9 (Gal-9) is a beta-galactoside-binding protein with a variety of biological functions related to immune response. However, in allergic diseases, its mechanism of action is not fully understood. This study evaluates the expression pattern of Gal-9 in patients with atopic dermatitis (AD), in ovalbumin (OVA)-induced experimental atopic dermatitis (AD) in mice, as well as its effect on human keratinocytes. The skin of OVA-immunized BALB/c mice was challenged with drops containing OVA on days 11, 14-18, and 21-24. HaCaT cells were cultured in the following experimental conditions: control (growth medium only) or stimulated with TNF-α/IFN-γ, or IL-4, or IL-17 with or without Gal-9 treatment. AD was characterized by increased levels of Gal-9 in mouse and human skin, especially in the epidermis, and with a marked influx of Gal-9 positive eosinophils and mast cells compared to the control group. Gal-9 showed an immunomodulatory effect on keratinocytes by decreasing the release of IL-6 by IL-4-stimulated keratinocytes or increasing the IL-6 and RANTES levels by IL-17- or TNF-α/IFN-γ-stimulated cells, respectively. Under IL-17, Gal-9 treatment also altered the proliferation rate of cells. Overall, increased levels of Gal-9 in AD skin contribute to the control of inflammatory response and the proliferative process of keratinocytes, suggesting this lectin as a relevant therapeutic target.

Keywords: IL-6; atopic dermatitis; eosinophil; galectin; keratinocyte; mast cell; skin inflammation.


Conflict of interest statement

The authors declare no conflict of interest.

Figures

Figure 1
Figure 1
Experimental model of atopic dermatitis (AD). On days 0 and 7, male BALB/c mice were immunized with a subcutaneous injection of 5 µg of ovalbumin (OVA) and 10 mg/mL of the aluminum hydroxide adjuvant (alum). On days 11, 14 to 18, and 21 to 24, dorsal shaved flanks of animals were challenged with 250 µg of OVA diluted in 50 µL of Johnson’s Baby® oil. Sham animals received only sterile saline (days 0 and 7) and oil (days 11, 14–18, 21–24), while the naive group was only manipulated. After 24 h of the last OVA challenge, animals were euthanized for skin analysis.
Figure 2
Figure 2
Inflammatory response in the skin. Intense influx of eosinophils (b,d; black arrows) and activated mast cells (d; white arrows) were observed in the (b) dermis of AD group in comparison to the (a) SHAM. Mast cells in (d) showed a weaker staining compared to the cell in (c) related to their greater activation with the release of cytoplasmic granules. Stain: Diff-Quick. (e,f) Quantification of intact (IMCs) and degranulated mast cells (DMCs) in the dermis. IMCs were characterized by metachromatic cytoplasmic granules, while DMCs by the exocytosis of granules in the dermis. Data represent mean ± SEM of the number of cells per mm2 (n = 5 animals/group). *** p < 0.001 vs. Naïve/Degranulated MCs; ### p < 0.001 vs. Sham/Degranulated MCs (ANOVA, Bonferroni post-test). (g,h) Immunofluorescence double staining for mouse mast cell protease 6 (mMCP6) or eosinophil peroxidase (EPX) and Gal-9 in AD skin. mMCP6 and EPX are colocalized with Gal-9 in the cytosol of mast cells (g) and eosinophils (h). DAPI was used as a nuclear counterstain. Scale bars: 25 µm (a,b); 10 µm (c,d,g,h); 5 µm (e).
Figure 3
Figure 3
Expression of Gal-9 in the mouse skin. (ac) Intense immunoreactivity for Gal-9 in the mouse epidermis and dermis detected in the AD group compared to controls (Naïve and Sham groups). (d) Negative control shows absence of immunoreactivity for Gal-9. Counterstain: hematoxylin. Scale bars: 40 µm. (e,f) Densitometric analysis of Gal-9 expression in mouse epidermis and dermis. Data represent means ± SEM of Gal-9 expression in arbitrary units (a.u.) (n = 5 animals/group). ** p < 0.01, *** p < 0.001 vs. Naive; ### p < 0.001 vs. Sham (Kruskal–Wallis, Dunn post-test). (g) Western blot analysis to measure Gal-9 levels in the mouse skins. β-actin was used as a protein loading control (data represent one illustrative blot from two independent experiments).
Figure 4
Figure 4
Expression of Gal-9 in the human skin. (a,b) Levels of Gal-9 in the human AD and control skins. Epidermis from AD skin samples shows intense immunoreactivity for Gal-9 compared to the control skin. (c) Absence of immunoreactivity for Gal-9 in the negative control. Counterstain: hematoxilin. Scale bars: 40 µm. (d) Densitometry for Gal-9 in keratinocytes. Data represent means ± SEM of Gal-9 expression in the nucleus and cytoplasm of cells in a.u. (n = 9–10 patients/group). * p < 0.05 vs. cytoplasm of control keratinocyte (Kruskal–Wallis, Dunn post-test). (eh) Heatmaps based on the Z-scores of LGALS9 transcriptional levels in the healthy (control) and AD human skins (GSE120721) (e); control/IL-17A-stimulated HaCaT cells (GSE27533) (f); control and cytokine (IL-4, IL-13, IL-17A, IFN-γ, IFN-α, and TNF)-stimulated primary keratinocytes (GSE36287) (g); and in the control (healthy patients), lesion, and nonlesion skins from AD patients treated weekly with subcutaneous doses of 200 mg of dupilumab for 16 weeks (GSE130588) (h). * p < 0.05, ** p < 0.01 vs. control (healthy skins); ### p < 0.001 vs. AD nonlesion (ANOVA, Bonferroni post-test). *** p < 0.001 vs. control HaCaT cells (t-test, unpaired).
Figure 5
Figure 5
Effect of Gal-9 on cytokine release by keratinocytes. (a,d,g) IL-6 levels. (b,e,h) IL-8 levels. (c,f,i) RANTES levels (n = 3/group in 2 independent experiments). Human keratinocytes were submitted to the following experimental conditions: control (growth media) or stimulated with TNF-α/IFN-γ (10 ng/mL; (a)) IL-4 (100 ng/mL; (d)) or IL-17 (100 ng/mL; (g)), and after 15 min they received human recombinant Gal-9 at 100 or 500 ng/mL or media (control). After 24 h, ELISA was performed to determine cytokine release. Data are presented as the mean ± SEM of cytokine levels (pg/mL). * p < 0.05; ** p < 0.01; *** p < 0.001 vs. control; ## p < 0.01 vs. at corresponding cytokine stimulation without Gal-9 (ANOVA, Bonferroni post-test).
Figure 6
Figure 6
Effect of Gal-9 on HaCaT proliferation rate. Human keratinocytes were submitted to the following experimental conditions: control (growth media) or stimulated with TNF-α/IFN-γ (10 ng/mL; (a)) IL-4 (100 ng/mL; (b)) or IL-17 (100 ng/mL; (c)), and after 15 min they received human recombinant Gal-9 at 100 or 500 ng/mL or media. After 24, 48, and 72 h, an MTT assay was performed to determine proliferation rate (% of control; data represent mean ± SEM) (n = 3/group in 2 independent experiments). * p < 0.05; ** p < 0.01; *** p < 0.001 vs. control; ## p < 0.01 vs. IL-17-stimulated cells (ANOVA, Bonferroni post-test).
Figure 7
Figure 7
Scratch assay: assessment of HaCaT migration rate after cytokine stimulation and Gal-9 treatment. Human keratinocytes were submitted to the following experimental conditions: control (growth media), stimulated with TNF-α/IFN-γ (10 ng/mL), IL-4 (100 ng/mL), or IL-17 (100 ng/mL), and after 15 min they received human recombinant Gal-9 at 100 or 500 ng/mL or media. Wound assays were observed after 6, 24, and 48 h. Cells were seeded in complete media. Representative photomicrographs show no effect of Gal-9 treatment on keratinocytes under TNF-α/IFN-γ (a,b), IL-4 (c,d), or IL-17 (e,f) stimulation compared to nontreated conditions (n = 3/group in 2 independent experiments). Data are presented as the mean ± SEM of wound closure (%). * p < 0.05; ** p < 0.01; *** p < 0.001 vs. control at the corresponding time point (ANOVA, Bonferroni post-test).

Similar articles

Cited by

References

    1. Leung D.Y., Guttman-Yassky E. Deciphering the complexities of atopic dermatitis: Shifting paradigms in treatment approaches. J. Allergy Clin. Immunol. 2014;134:769–779. doi: 10.1016/j.jaci.2014.08.008. - DOI - PMC - PubMed
    1. Guttman-Yassky E., Krueger J.G. Atopic dermatitis and psoriasis: Two different immune diseases or one spectrum? Curr. Opin. Immunol. 2017;48:68–73. doi: 10.1016/j.coi.2017.08.008. - DOI - PubMed
    1. Dainichi T., Kitoh A., Otsuka A., Nakajima S., Nomura T., Kaplan D.H., Kabashima K. The epithelial immune microenvironment (EIME) in atopic dermatitis and psoriasis. Nat. Immunol. 2018;19:1286–1298. doi: 10.1038/s41590-018-0256-2. - DOI - PubMed
    1. Elola M.T., Ferragut F., Méndez-Huergo S.P., Croci D.O., Bracalente C., Rabinovich G.A. Galectins: Multitask signaling molecules linking fibroblast, endothelial and immune cell programs in the tumor microenvironment. Cell Immunol. 2018;333:34–45. doi: 10.1016/j.cellimm.2018.03.008. - DOI - PubMed
    1. Liu F.T., Rabinovich G.A. Galectins: Regulators of acute and chronic inflammation. Ann. N. Y. Acad. Sci. 2010;1183:158–182. doi: 10.1111/j.1749-6632.2009.05131.x. - DOI - PubMed

Publication types

LinkOut - more resources