

QTL Analysis of Five Morpho-Physiological Traits in Bread Wheat Using Two Mapping Populations Derived from Common Parents
- PMID: 33923933
- PMCID: PMC8074140
- DOI: 10.3390/genes12040604
QTL Analysis of Five Morpho-Physiological Traits in Bread Wheat Using Two Mapping Populations Derived from Common Parents
Abstract
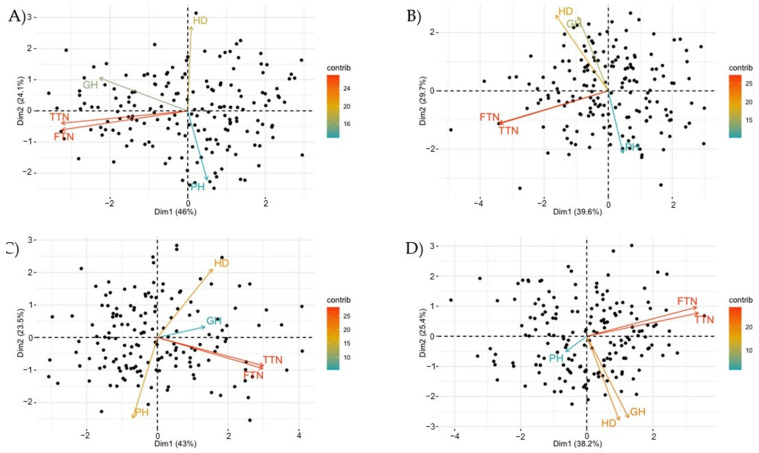
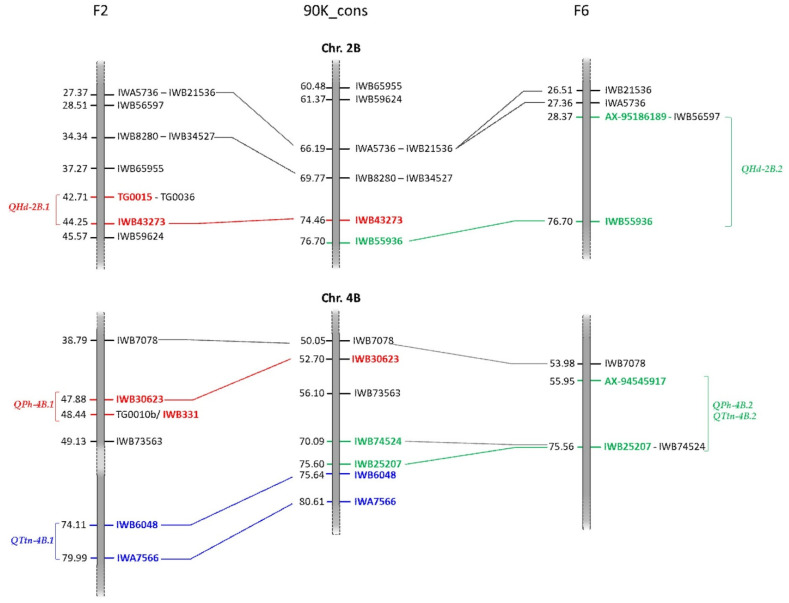
Traits such as plant height (PH), juvenile growth habit (GH), heading date (HD), and tiller number are important for both increasing yield potential and improving crop adaptation to climate change. In the present study, these traits were investigated by using the same bi-parental population at early (F2 and F2-derived F3 families) and late (F6 and F7, recombinant inbred lines, RILs) generations to detect quantitative trait loci (QTLs) and search for candidate genes. A total of 176 and 178 lines were genotyped by the wheat Illumina 25K Infinium SNP array. The two genetic maps spanned 2486.97 cM and 3732.84 cM in length, for the F2 and RILs, respectively. QTLs explaining the highest phenotypic variation were found on chromosomes 2B, 2D, 5A, and 7D for HD and GH, whereas those for PH were found on chromosomes 4B and 4D. Several QTL detected in the early generations (i.e., PH and tiller number) were not detected in the late generations as they were due to dominance effects. Some of the identified QTLs co-mapped to well-known adaptive genes (i.e., Ppd-1, Vrn-1, and Rht-1). Other putative candidate genes were identified for each trait, of which PINE1 and PIF4 may be considered new for GH and TTN in wheat. The use of a large F2 mapping population combined with NGS-based genotyping techniques could improve map resolution and allow closer QTL tagging.
Keywords: F2; QTL; RILs; SNP markers; bread wheat; genetic map.
Conflict of interest statement
The authors declare no conflict of interest.
Figures

References
-
- FAO Early Outlook for 2021 Crops. [(accessed on 15 April 2021)];2021 Available online: http://www.fao.org/worldfoodsituation/csdb/en/
-
- Hunter M.C., Smith R.G., Schipanski M., Atwood L.W., Mortensen D.A. Agriculture in 2050: Recalibrating targets for sustainable intensification. Bioscience. 2017;67:386–391. doi: 10.1093/biosci/bix010. - DOI
-
- Barrett B., Bayram M., Kidwell K., Weber W.E. Identifying AFLP and microsatellite markers for vernalization response gene Vrn-B1 in hexaploid wheat using reciprocal mapping populations. Plant Breed. 2002;121:400–406. doi: 10.1046/j.1439-0523.2002.732319.x. - DOI
Publication types
MeSH terms
LinkOut - more resources
Full Text Sources
Other Literature Sources
Miscellaneous
