. 2021 Apr 28;10(5):382.
doi: 10.3390/biology10050382.

Deletion of Mitochondrial Translocator Protein (TSPO) Gene Decreases Oxidative Retinal Pigment Epithelial Cell Death via Modulation of TRPM2 Channel

Affiliations

Deletion of Mitochondrial Translocator Protein (TSPO) Gene Decreases Oxidative Retinal Pigment Epithelial Cell Death via Modulation of TRPM2 Channel

Dilek Özkaya et al. Biology (Basel). .

Abstract

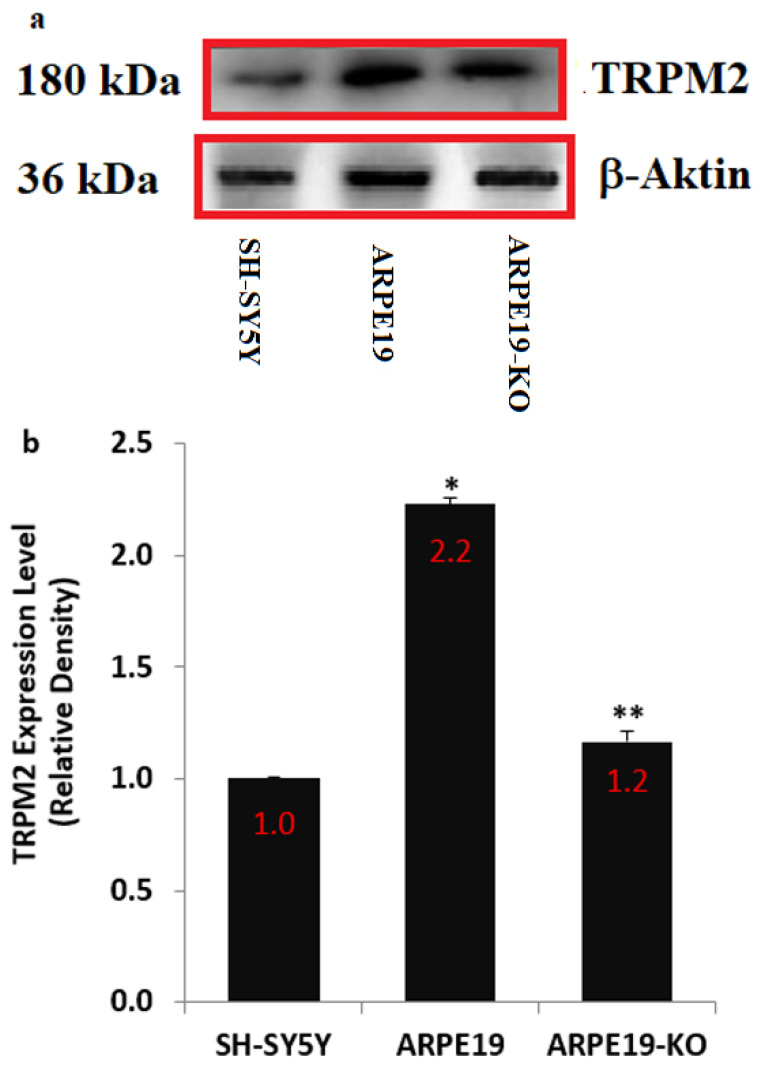
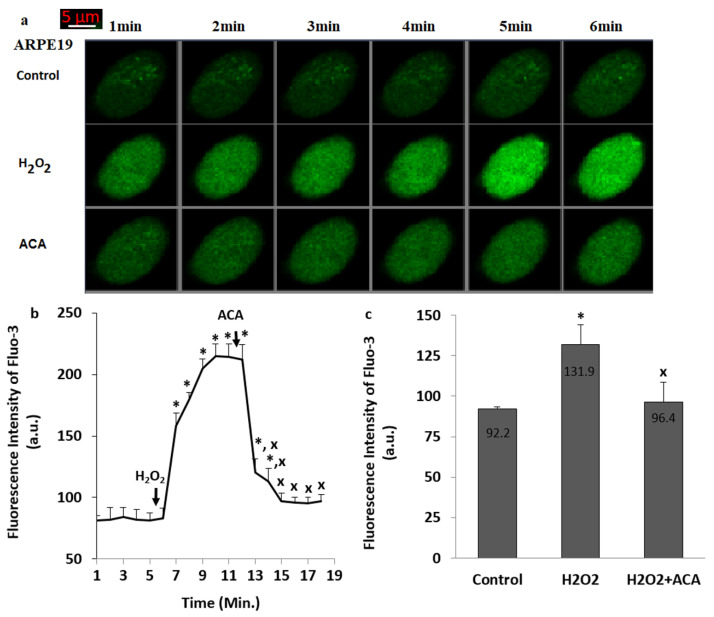
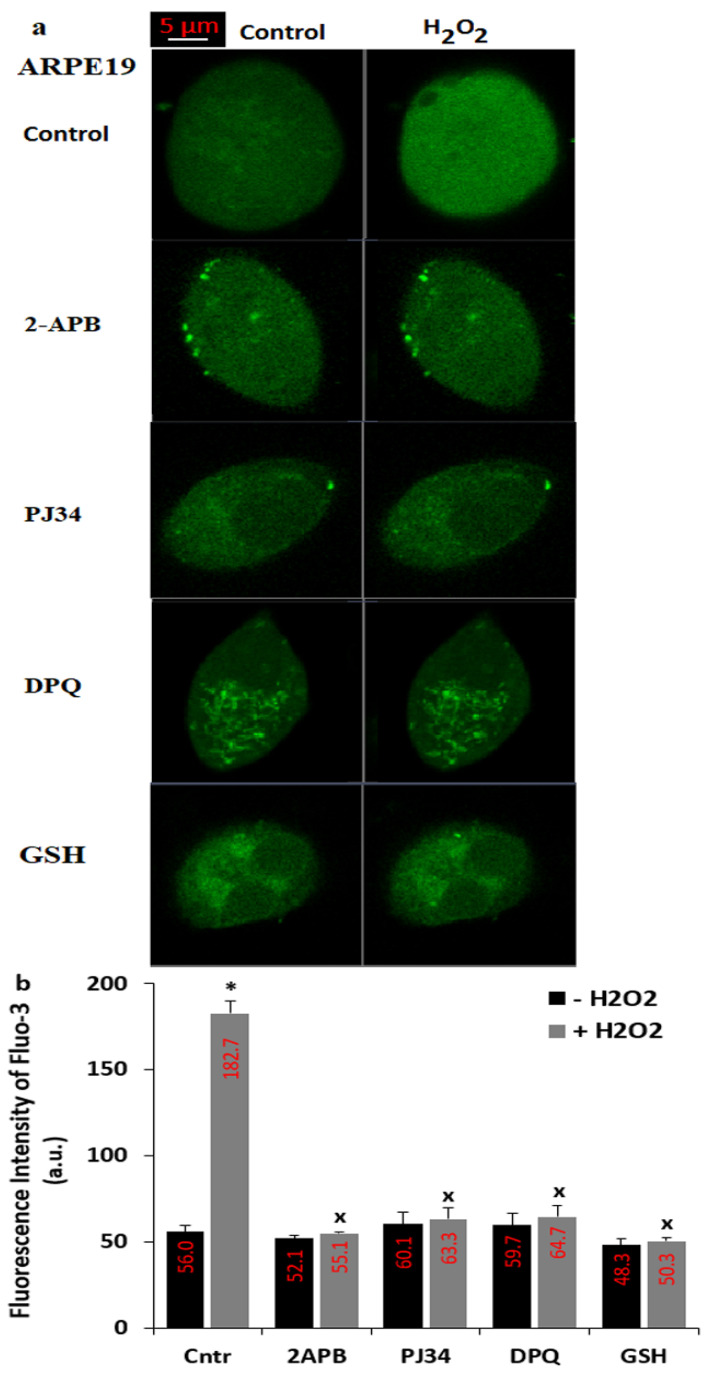
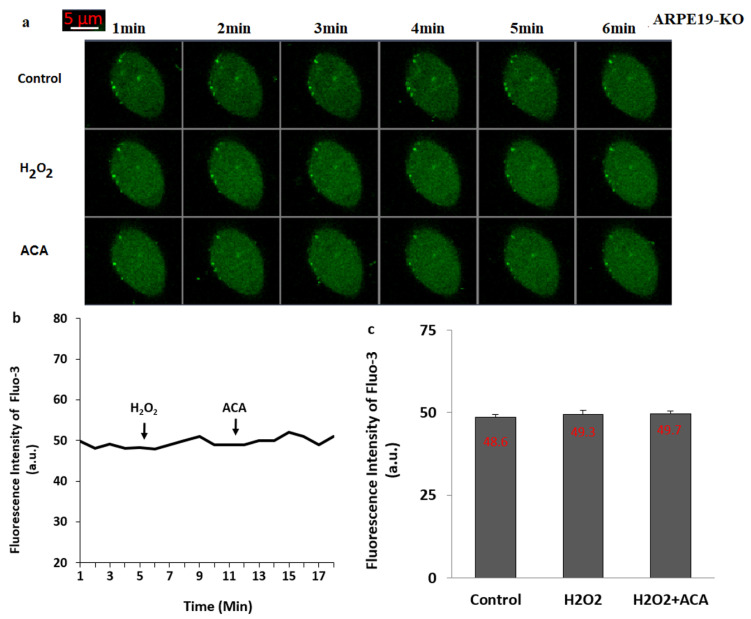
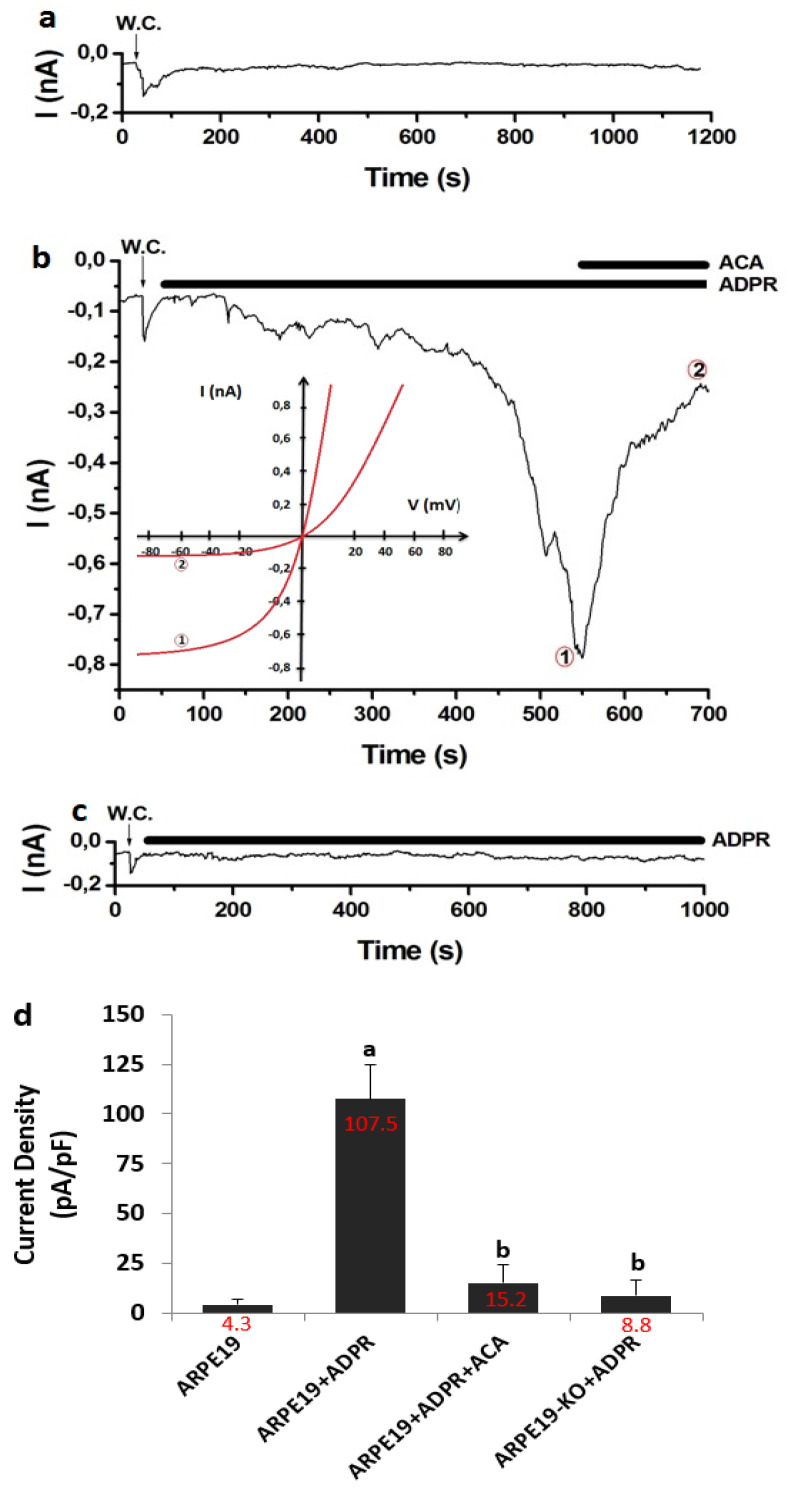
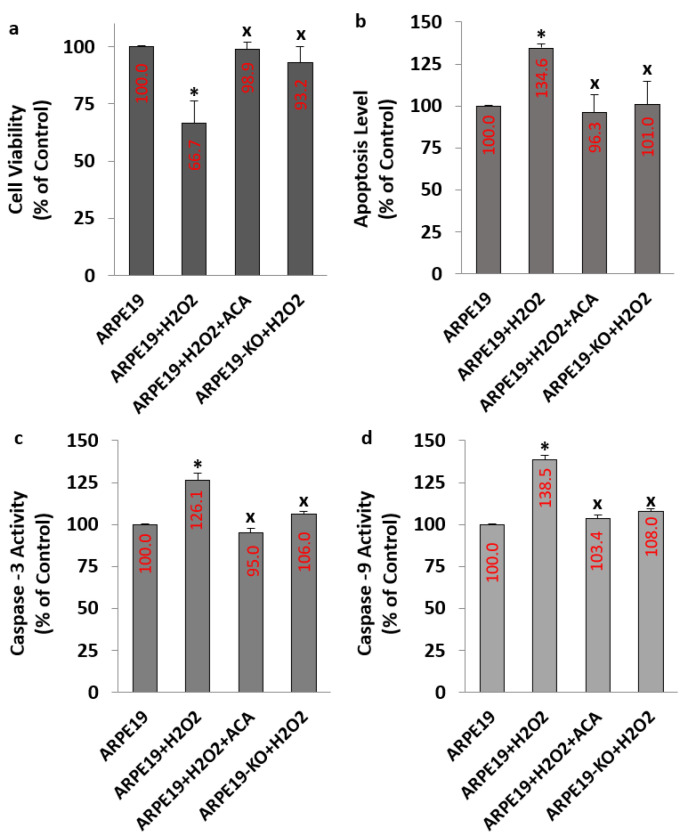
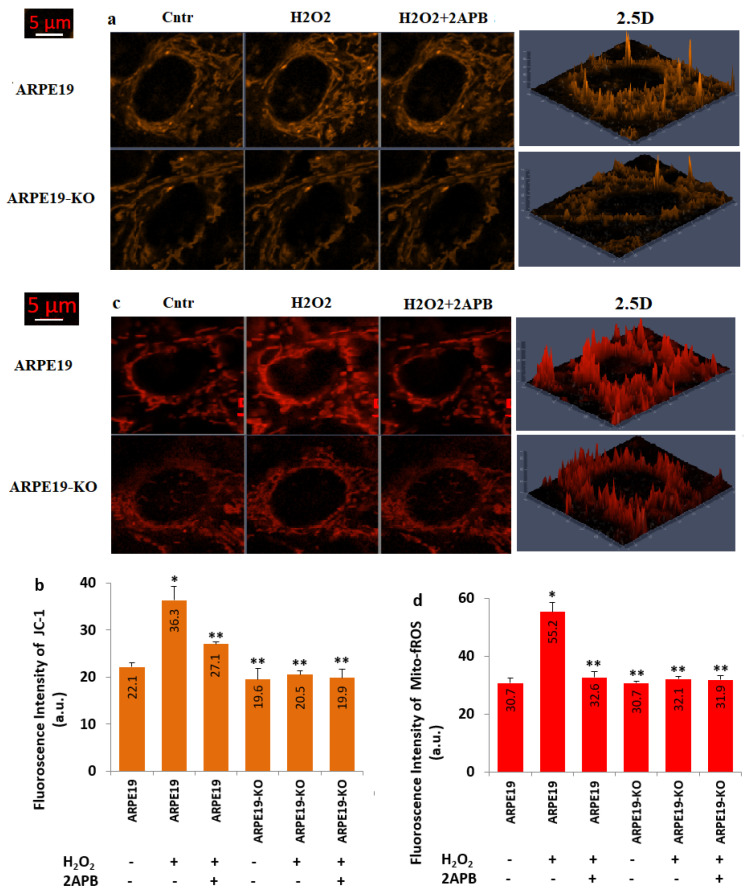
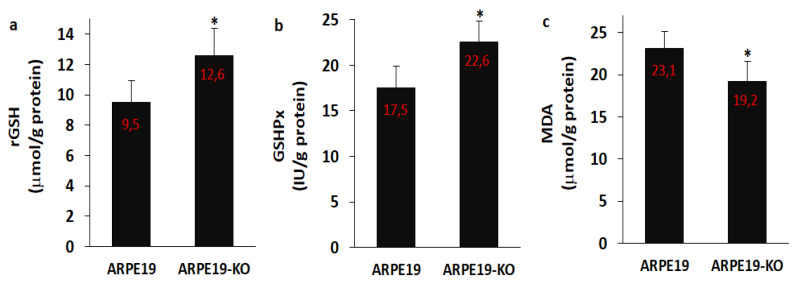
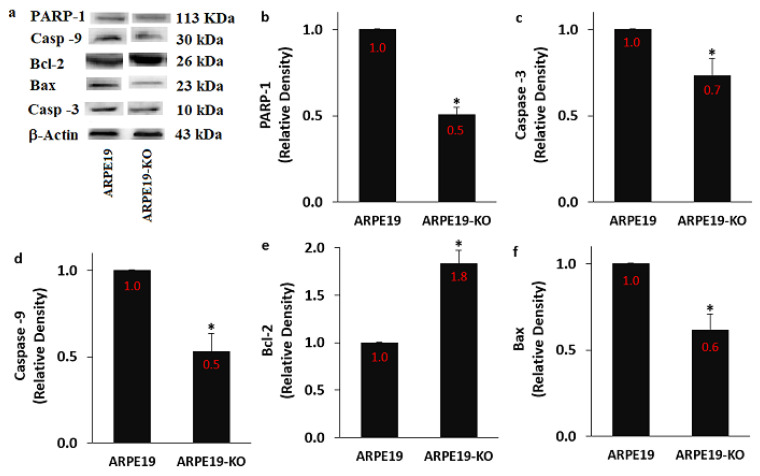
The current results indicated the possible protective actions of 18 kDa mitochondrial translocator protein (TSPO) deletion on TRPM2 stimulation, mitochondrial free ROS (Mito-fROS) and apoptotic harmful actions in the cells of adult retinal pigment epithelial19 (ARPE19). There was a direct relationship between TSPO and the disease of age-related macular degeneration. The nature of TSPO implicates upregulation of Mito-fROS and apoptosis via the activation of Ca2+ channels in ARPE19, although deletion of TSPO gene downregulates the activation. The decrease of oxidative cytotoxicity and apoptosis might induce in TSPO gene deleted cells by the inhibition of Mito-fROS and PARP-1 activation-induced TRPM2 cation channel activation. The ARPE19 cells were divided into two main groups as TSPO expressing (ARPE19) and non-expressing cells (ARPE19-KO). The levels of caspase -3 (Casp -3), caspase -9 (Casp -9), apoptosis, Mito-fROS, TRPM2 current and intracellular free Ca2+ were upregulated in the ARPE19 by the stimulations of H2O2 and ADP-ribose, although their levels were downregulated in the cells by the modulators of PARP-1 (DPQ and PJ34), TRPM2 (ACA and 2APB) and glutathione. However, the H2O2 and ADP-ribose-mediated increases were not observed in the ARPE19-KO. The expression levels of Bax, Casp -3, Casp -9 and PARP-1 were higher in the ARPE19 group as compared to the ARPE19-KO group. In summary, current results confirmed that TRPM2-mediated cell death and oxidative cytotoxicity in the ARPE19 cells were occurred by the presence of TSPO. The deletion of TSPO may be considered as a therapeutic way to TRPM2 activation-mediated retinal oxidative injury.

Keywords: ARPE19 cells; TRPM2 channel; cell death; mitochondrial oxidative cytotoxicity; mitochondrial translocator protein.


Conflict of interest statement

None declared.

Figures

Figure 1
Figure 1
The expression level of TRPM2 protein. (Mean ± SD and n = 3). For the expression levels of TRPM2 protein in the cells of SH-SY5Y, ARPE19 and ARPE19-KO, we used standard Western blot analyses. The protein bands of β-actin were used as control. (a) The protein bands of β-actin and TRPM2. (b) The mean levels of the band proteins in the column figure were expressed as Mean ± SD. 1:500. (* p ≤ 0.05 vs. SH-SY5Y cells. ** p ≤ 0.05 vs. ARPE19 cells).
Figure 2
Figure 2
The H2O2 -mediated upregulation of Ca2+ fluorescence intensity through the stimulation of TRPM2 in the ARPE19. (n = 25–30). After incubating the ARPE19 cells with Fluo-3AM (1 µM for 60 min), the TRPM2 stimulator (H2O2 and 1 mM) and blocker (ACA and 25 µM for 6 min) applied to the cells within three groups (control, H2O2 and H2O2 + ACA). The cells were analyzed. The fluorescence intensity of Fluo-3AM in the ARPE19 was imaged at 515 nm in the LSM 800 laser scan microscope with 40 × 1.3 oil objective and the results were indicated as arbitrary unit (a.u.). (a) Imagines of the Fluo-3AM. (b,c) The mean fluorescence intensity of Ca2+ in the column and line figures were expressed as Mean ± SD in the ARPE19 after the treatments of H2O2 and ACA. (* p ≤ 0.05 vs. control. x p ≤ 0.05 vs. H2O2 group).
Figure 3
Figure 3
There is no H2O2-mediated florescence change via TRPM2 activation in the presence of GSH, PARP-1, and TRPM2 blockers. (Mean ± SD). The ARPE19 cells in the dishes were incubated with Fluo-3AM (1 µM for 60 min.). After pre-incubation of cells with the inhibitors of PARP-1 (1 µM PJ34 and 30 µM DPQ), TRPM2 (100 µM 2APB for 30 min) and GSH (10 mM for 2 h), the cells were stimulated by H2O2 (1 mM for 6 min). The symbolic images (a) and the mean intensity values (b) of the [Ca2+]c from the groups of control (Cntr), 2APB, PJ34, DPQ and GSH groups were obtained. The images were captured in the LSM 800 laser confocal microscope with 40 × 1.3 oil objective and the results of Fluo-3AM florescence intensity were indicated as arbitrary unit (a.u.). The scale bar: 5 µm. One symbolic image from each group was selected from 25–30 cells of 6 independent investigations. (* p ≤ 0.05 vs. Cntr (− H2O2) group. x p ≤ 0.05 vs. vs. Cntr (+ H2O2) group).
Figure 4
Figure 4
The stimulation of H2O2 did not induce changes on the [Ca2+]c and TRPM2 activation in the cells of ARPE19-KO. (Mean ± SD). After incubating the cells of ARPE19-KO with Fluo-3AM (1 µM for 60 min), the TRPM2 stimulator (H2O2 and 1 mM) and blocker (ACA and 25 µM for 6 min) applied to the cells within three groups (control, H2O2 and H2O2 + ACA). The images of ARPE19-KO were captured in the LSM 800 with 40 × 1.3 oil objective. The scale bar was kept as 5 µm. The captured representative images (Figure 4a) and the mean Fluo-3AM intensity values (Figure 4b,c) in the groups of control (Cntr), H2O2 and H2O2 + ACA are shown in the Figure 4. One symbolic image from each group was selected from 25–30 cells of 6 independent investigations.
Figure 5
Figure 5
The stimulation of ADPR induced the activation of TRPM2 in the cells of ARPE19, but not in the cells of ARPE19-KO. (Mean ± SD and n = 6). The whole cell (W.C.) configuration current records of TRPM2 were taken in voltage-clamp (at −60 mV) (a) The cells of ARPE19 without cytosolic ADPR (1 mM). (b) ARPE19 + ADPR group. The cytosolic ADPR (1 mM)-mediated TRPM2 currents were inhibited by ACA (25 µM). (b)-I/V. Time points ADPR and ACA were indicated 1 and 2, respectively. (c) ARPE19-KO + ADPR group. There is no cytosolic ADPR (1 mM)-mediated TRPM2 current. (d) The mean current densities from the cells of ARPE19 and ARPE19-KO. (a p ≤ 0.05 vs. ARPE19). b p ≤ 0.05 vs. ARPE19 + ADPR).
Figure 6
Figure 6
The values of apoptosis, caspase -3 (Casp -3), and -9 (Casp -9) were upregulated, although the values of cell viability were downregulated in the cells of ARPE19 (but not in the cells of ARPE19-KO) by the stimulation of H2O2. (Mean ± SD and n = 6). For analyzing cell viability, the test of MTT was used (a), whereas the value of apoptosis (b) was analyzed by using the ApoPercantage kit. The fluorogenic substrates of Ac-DEVD-AMC and Ac-LEHD-AFC were used for the assays of Casp -3 (c) and Casp -9 (d), respectively. (* p ≤ 0.05 vs. ARPE19. x p ≤ 0.05 vs. ARPE19 + H2O2).
Figure 7
Figure 7
The levels of Mito-Dep (JC-1) and mitochondrial fROS (Mito-fROS) were upregulated in the ARPE19, but not in the ARPE19-KO by the stimulation of H2O2. (N = 25–30 and mean ± SD). After staining the cells with JC-1 (5 µM) and MitoTracker Red CM-H2ros (1 µM) dyes, the images of JC-1 and Mito-fROS were captured in the LSM 800 with the 40 × 1.3 oil objective. (a) The images of JC-1. (b) The mean fluorescence intensities of the JC-1 as arbitrary unit (a.u). (c) The images of MitoTracker Red CM-H2ros. (d) The mean fluorescence intensities of the Mito-fROS. (* p ≤ 0.05 vs. ARPE19 group. ** p ≤ 0.05 vs. ARPE19 + H2O2 group).
Figure 8
Figure 8
The levels of reduced glutathione (rGSH), glutathione peroxidase (GSHPx) and lipid peroxidation (MDA) were modulated in the ARPE19-KO cells by the deletion of TSPO (N = 6 and mean ± SD). The levels of rGSH (a), GSHPx (b) and MDA (c) were spectrophotometrically analyzed in the cells. (* p ≤ 0.05 vs. ARPE19).
Figure 9
Figure 9
The regulator role of TSPO deletion on the protein expressions of PARP-1, caspase-3 (Casp -3), caspase -9 (Casp -9), Bcl-2, and Bax. (Mean ± SD and n = 3). The band expressions of PARP-1, Casp -3, Casp -9, Bcl-2 and Bax were determined by standard method of Western blot. The proteins of β-actin were used as control. (a) Western blot bands. The mean values of PARP-1 (b), Casp -3 (c), Casp -9 (d), Bcl-2 (e) and Bax (f) were indicated in the Figure 8 by columns. (* p ≤ 0.05 vs. ARPE19).

Similar articles

Cited by

References

    1. Sreekumar P.G., Kannan R. Mechanisms of protection of retinal pigment epithelial cells from oxidant injury by humanin and other mitochondrial-derived peptides: Implications for age-related macular degeneration. Redox Biol. 2020;37:101663. doi: 10.1016/j.redox.2020.101663. - DOI - PMC - PubMed
    1. Pennington K.L., DeAngelis M.M. Epidemiology of age-related macular degeneration (AMD): Associations with cardiovascular disease phenotypes and lipid factors. Eye Vis. 2016;3:34. doi: 10.1186/s40662-016-0063-5. - DOI - PMC - PubMed
    1. Koc F., Erden V., Yurdakul N.S. Causes of low vision and blindness in a Turkish adult population: The Izmir eye study. East. Mediterr. Health J. 2018;24:161–168. doi: 10.26719/2018.24.2.161. - DOI - PubMed
    1. Alamri A., Biswas L., Watson D.G., Shu X. Deletion of TSPO Resulted in Change of Metabolomic Profile in Retinal Pigment Epithelial Cells. Int. J. Mol. Sci. 2019;20:1387. doi: 10.3390/ijms20061387. - DOI - PMC - PubMed
    1. Cougnard-Grégoire A., Delyfer M.-N., Korobelnik J.-F., Rougier M.-B., Le Goff M., Dartigues J.-F., Barberger-Gateau P., Delcourt C. Elevated High-Density Lipoprotein Cholesterol and Age-Related Macular Degeneration: The Alienor Study. PLoS ONE. 2014;9:e90973. doi: 10.1371/journal.pone.0090973. - DOI - PMC - PubMed

LinkOut - more resources