. 2021 Apr 28;13(5):783.
doi: 10.3390/v13050783.

CRISPR Interference Efficiently Silences Latent and Lytic Viral Genes in Kaposi's Sarcoma-Associated Herpesvirus-Infected Cells

Affiliations

CRISPR Interference Efficiently Silences Latent and Lytic Viral Genes in Kaposi's Sarcoma-Associated Herpesvirus-Infected Cells

Kevin Brackett et al. Viruses. .

Abstract

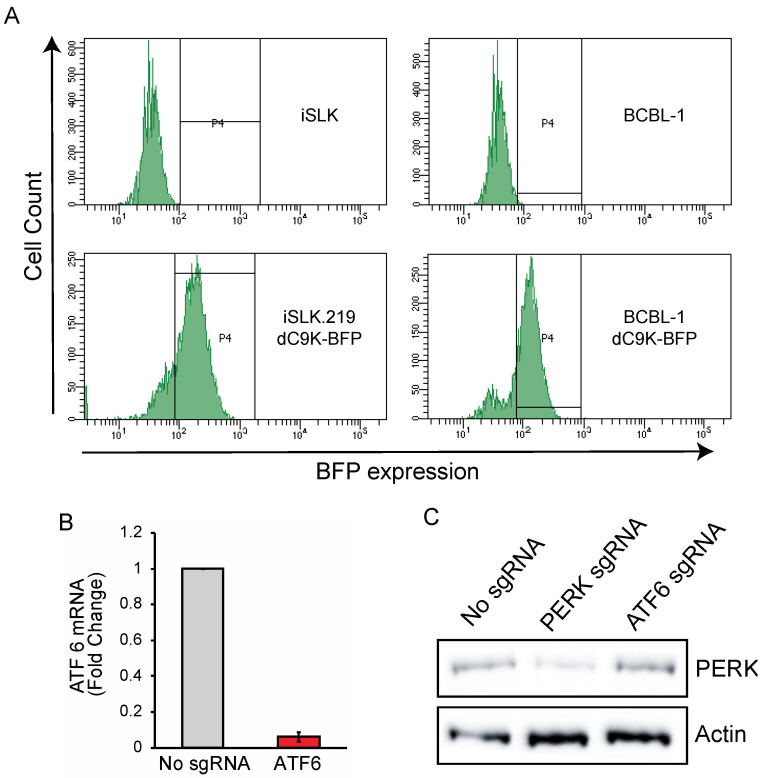
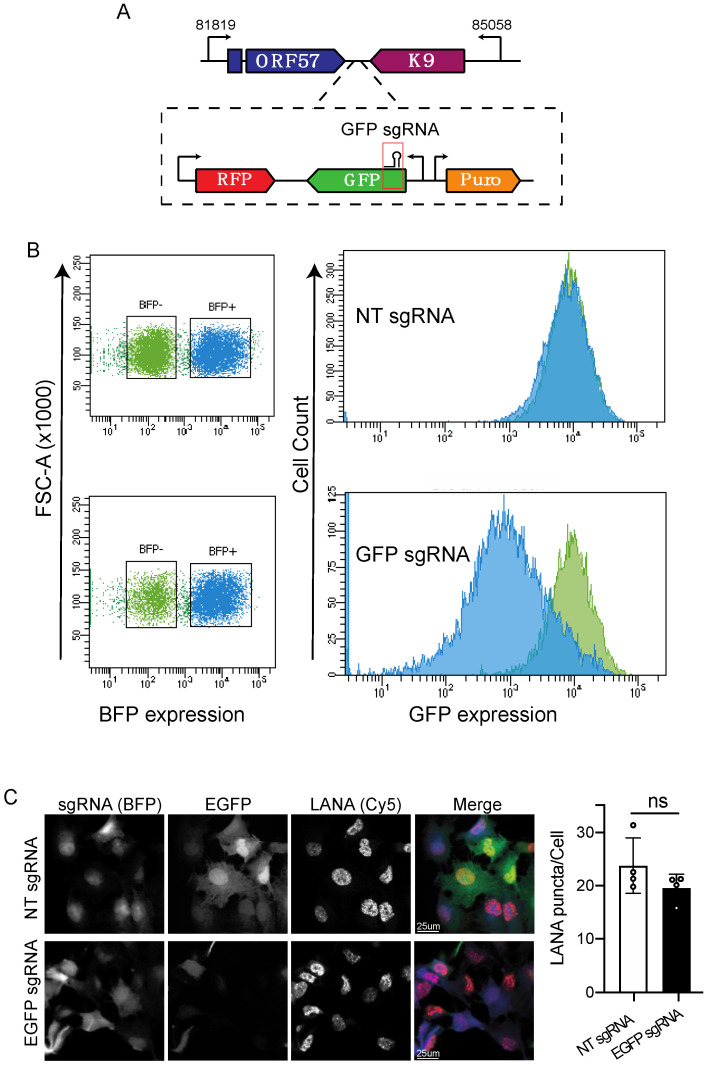
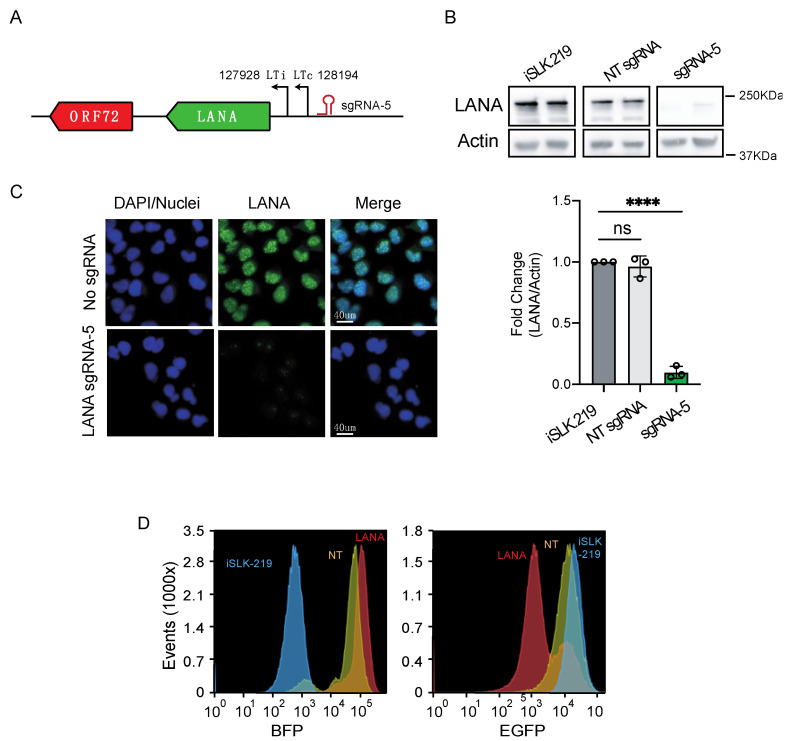
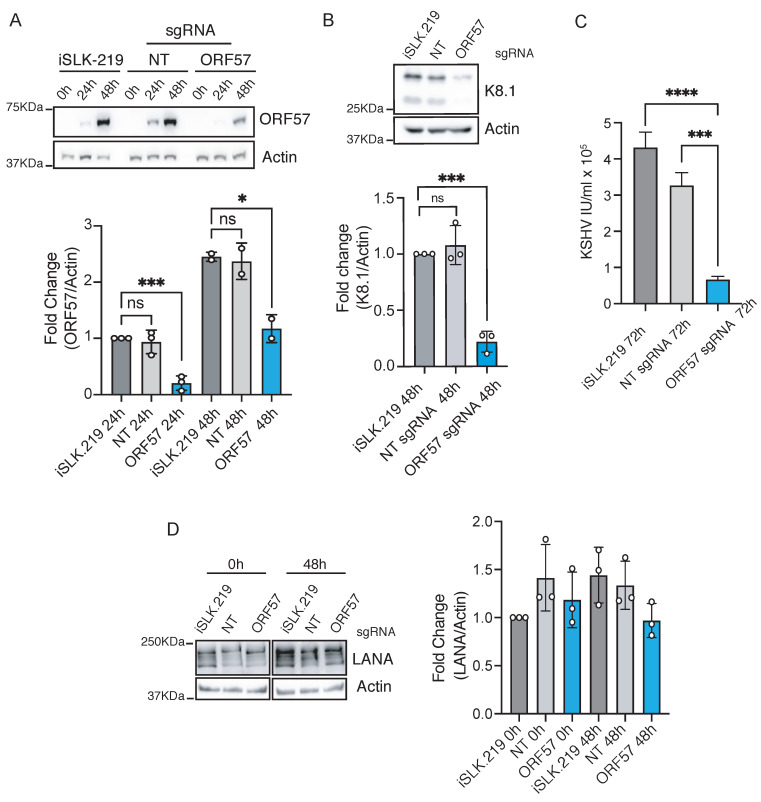
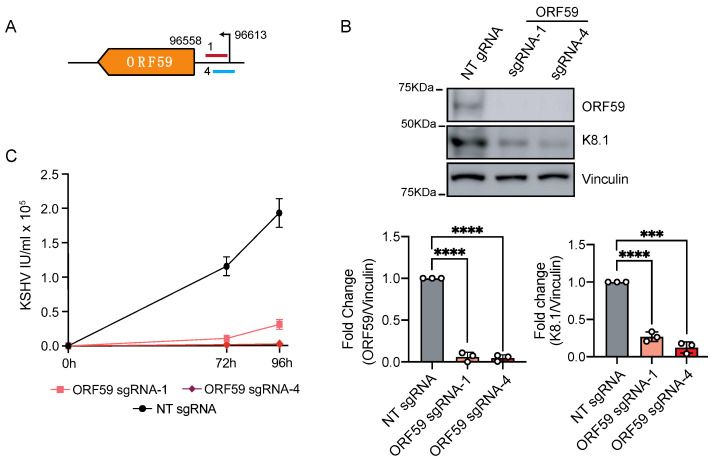
Uncovering viral gene functions requires the modulation of gene expression through overexpression or loss-of-function. CRISPR interference (CRISPRi), a modification of the CRISPR-Cas9 gene editing technology, allows specific and efficient transcriptional silencing without genetic ablation. CRISPRi has been used to silence eukaryotic and prokaryotic genes at the single-gene and genome-wide levels. Here, we report the use of CRISPRi to silence latent and lytic viral genes, with an efficiency of ~80-90%, in epithelial and B-cells carrying multiple copies of the Kaposi's sarcoma-associated herpesvirus (KSHV) genome. Our results validate CRISPRi for the analysis of KSHV viral elements, providing a functional genomics tool for studying virus-host interactions.

Keywords: CRISPR-interference; KSHV; Kaposi’s sarcoma-associated herpesvirus; dCas9-KRAB; gene expression; gene silencing.


Conflict of interest statement

The authors declare no conflict of interest.

Figures

Figure 1
Figure 1
Generation of iSLK-219-dC9K and BCBL-1-dC9K cell lines. (A) FACS traces showing mean fluorescence intensity (MFI) of iSLK-219 and BCBL-1 cells transduced with a lentiviral vector expressing dCas9-KRAB-BFP-Blasticidin, selected with blasticidin for 10 days and sorted by FACS for BFP+ expression (P4 gate) (B) RT-qPCR showing silencing of ATF6 in BCBL-1 cells. BCBL-1-dC9K cells were transduced with an ATF6 sgRNA targeting vector and selected with puromycin for 10 days. 28S rRNA was used as a loading control. Error bars: standard deviation (C) immunoblot showing silencing of PERK 10 days after iSLK-219 cells were transduced with a PERK sgRNA targeting vector and selected by FACS (BFP+).
Figure 2
Figure 2
CRISPRi silencing of KSHV-encoded EGFP. (A) Region of the viral genome encoding EGFP and position of the sgRNA. (B) Flow cytometry analysis (MFI) of iSLK-219-dC9K cells transduced with sgRNAs targeting EGFP or non-targeting (NT) sgRNAs. Note the downregulation of EGFP expression in cells transduced with the targeting sgRNA. (C) Immunofluorescence and confocal microscopy analyses of paraformaldehyde-fixed, BFP expressing cells (sgRNA), EGFP and LANA in iSLK-219-dC9K cells transduced with sgRNAs targeting EGFP or non-targeting (NT) sgRNAs. Quantification of LANA puncta/Cell in four independent fields (t-Test, ns p = 0.15).
Figure 3
Figure 3
CRISPRi silencing of latent genes in iSLK-219 cells. (A) Region of the viral genome encoding LANA (ORF73) and position of the sgRNA. (B) Immunoblot analysis of LANA in iSLK-219 cells, and iSLK-219-dC9K cells transduced with a non-targeting (NT) sgRNA or a LANA specific sgRNA. Image representative of three biological replicates. Bars: quantification of the data. (one-way ANOVA, **** p < 0.0001). Error bars: standard deviation, ns, not significant. (C) Immunofluorescence analyses of LANA in methanol-fixed iSLK-219-dC9K cells transduced with a LANA specific sgRNA. Image representative of three biological replicates. (D) Flow cytometry analyses (MFI) of iSLK-219 (blue trace), or iSLK-219-dC9K cells transduced with a non-targeting (NT) sgRNA (yellow trace) or a LANA specific sgRNA (red trace). Note the downregulation of EGFP expression in cells where LANA has been silenced. Image representative of two biological replicates.
Figure 4
Figure 4
CRISPRi silencing of immediate–early genes in iSLK-219 cells. Immunoblot analysis of (A) ORF57 (one-way ANOVA, 24 h **** p < 0.001, 48 h * p value 0.025), (B) K8.1 (one-way ANOVA, 48 h *** p < 0.001) and (D) LANA (Kruskal–Wallis test, 0.99 < p < 0.3) in latent and lytic (24 and 48 h post-reactivation) iSLK-219 cells, and iSLK-219-dC9K cells transduced with a non-targeting (NT) sgRNA or an ORF57-specific sgRNA. Image representative of three biological replicates. Bars: quantification of the data. Error bars: standard deviation, ns, not significant. (C) Quantification of viral titers (IU, infectious units) in the filtered supernatant of iSLK-219 or iSLK-219-dC9K cells transduced with a non-targeting (NT) sgRNA or an ORF57-specific sgRNA, collected at 72 h post-reactivation. Error bars: standard deviation. (one-way ANOVA, **** p < 0.001, *** p < 0.001).
Figure 5
Figure 5
CRISPRi silencing of delayed-early genes in iSLK-219 cells. (A) Region of the viral genome encoding ORF59 and position of the sgRNAs. Immunoblot analysis of (A) ORF59, and (B) K8.1 (in latent and lytic (96 h post-reactivation) in iSLK-219-dC9K cells transduced with a non-targeting (NT) sgRNA or an ORF59-specific sgRNA. Image representative of three biological replicates. Bars: quantification of the data. Error bars: standard deviation (one-way ANOVA, **** p < 0.001, *** p < 0.001). (C) Quantification of viral titers (IU, infectious units) in the filtered supernatant of iSLK-219-dC9K cells transduced with a non-targeting (NT) sgRNA or ORF59-specific sgRNAs, collected at 72 and 96 h post-reactivation. Error bars: standard deviation.
Figure 6
Figure 6
CRISPRi silencing of latent genes in BCBL-1 cells. (A) Region of the viral genome encoding LANA (ORF73) and position of the sgRNAs. (B) Immunoblot analysis of LANA in iSLK-219 cells, and iSLK-219-dC9K cells transduced with a non-targeting (NT) sgRNA or a LANA specific sgRNA. Image representative of three biological replicates. (C) Quantification of the immunoblot data for sgRNAs that silenced LANA. Error bars: standard deviation (one-way ANOVA, *** p = 0.0004, ** p = 0.004, * p = 0.0124, ns, not significant).

Similar articles

Cited by

References

    1. Dissinger N.J., Damania B. Recent Advances in Understanding Kaposi’s Sarcoma-associated Herpesvirus. F1000Research. 2016;5:740. doi: 10.12688/f1000research.7612.1. - DOI - PMC - PubMed
    1. International Agency for Research on Cancer . Globocan 2012: Estimated Cancer Incidence, Mortality and Prevalence Worldwide in 2012. World Health Organisation (WHO); Geneva, Switzerland: 2015.
    1. Mesri E.A., Cesarman E., Boshoff C. Kaposi’s Sarcoma and Its Associated Herpesvirus. Nat. Rev. Cancer. 2010;10:707–719. doi: 10.1038/nrc2888. - DOI - PMC - PubMed
    1. What Are the Key Statistics about Kaposi Sarcoma? American Cancer Society; Burlington, VT, USA: 2016.
    1. Arias C., Weisburd B., Stern-Ginossar N., Mercier A., Madrid A.S., Bellare P., Holdorf M., Weissman J.S., Ganem D. KSHV 2.0: A Comprehensive Annotation of the Kaposi’s Sarcoma-Associated Herpesvirus Genome Using Next-Generation Sequencing Reveals Novel Genomic and Functional Features. PLoS Pathog. 2014;10:e1003847. doi: 10.1371/journal.ppat.1003847. - DOI - PMC - PubMed

Publication types

Substances

LinkOut - more resources