. 2021 Apr 28;12(5):661.
doi: 10.3390/genes12050661.

The Consequences of Budding versus Binary Fission on Adaptation and Aging in Primitive Multicellularity

Affiliations

The Consequences of Budding versus Binary Fission on Adaptation and Aging in Primitive Multicellularity

Hanna Isaksson et al. Genes (Basel). .

Abstract

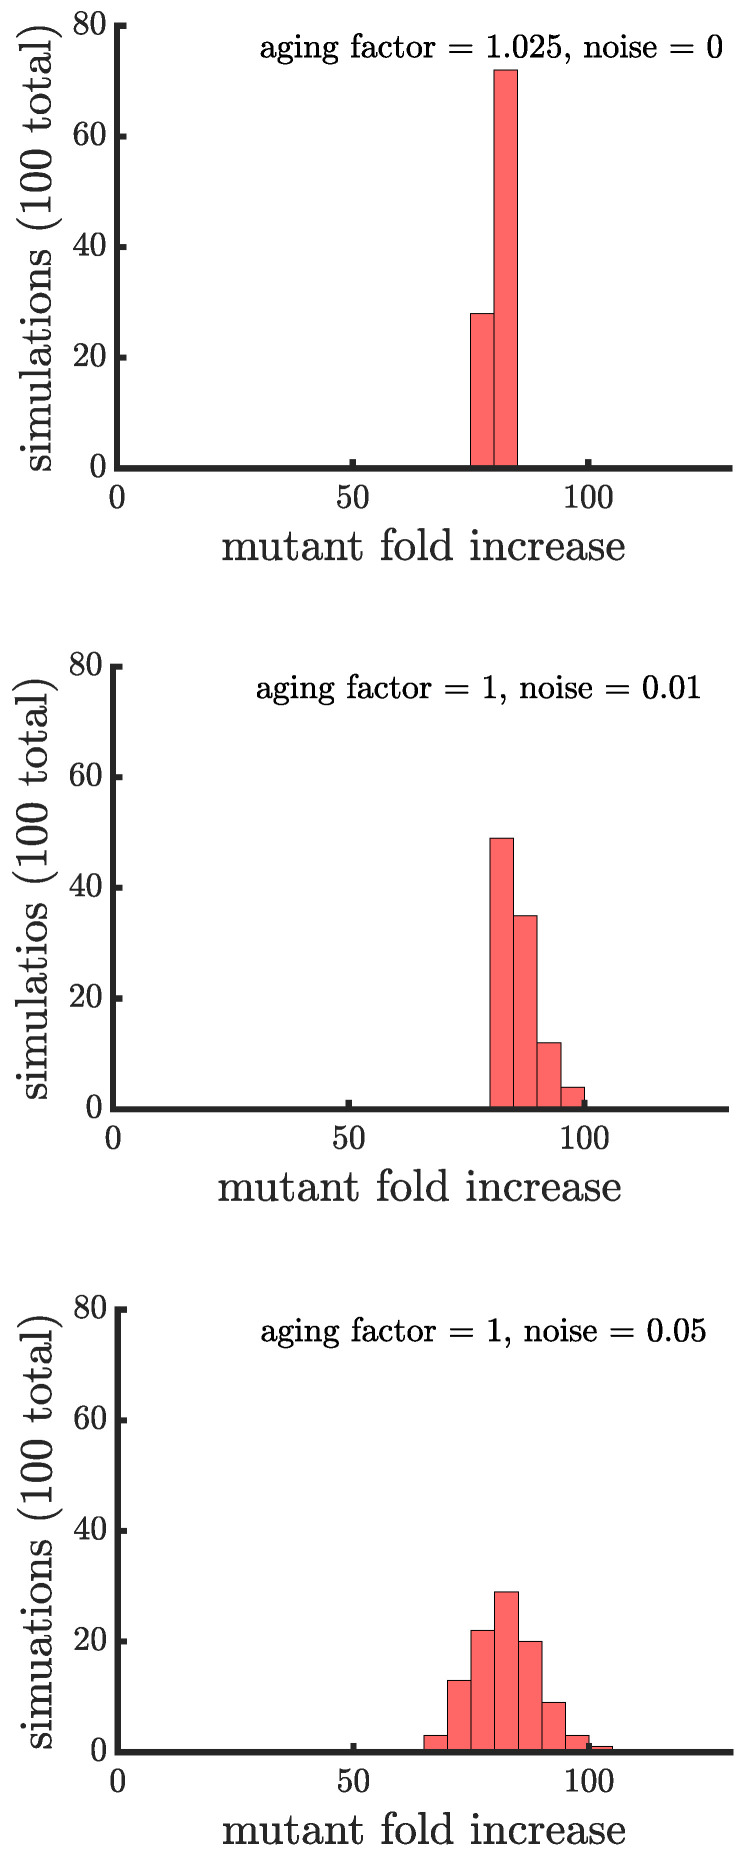
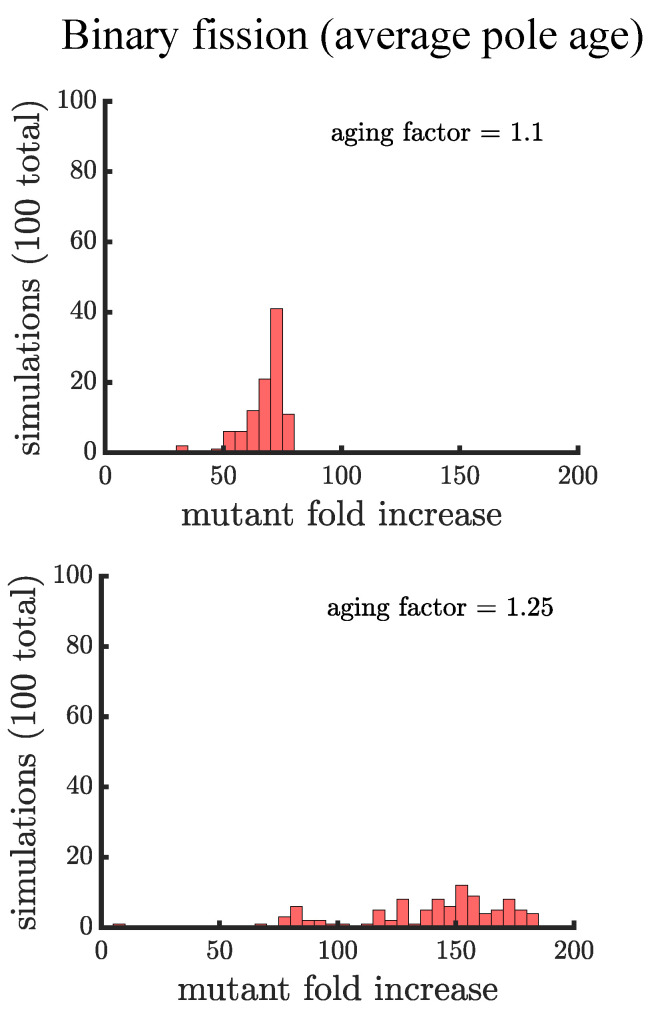
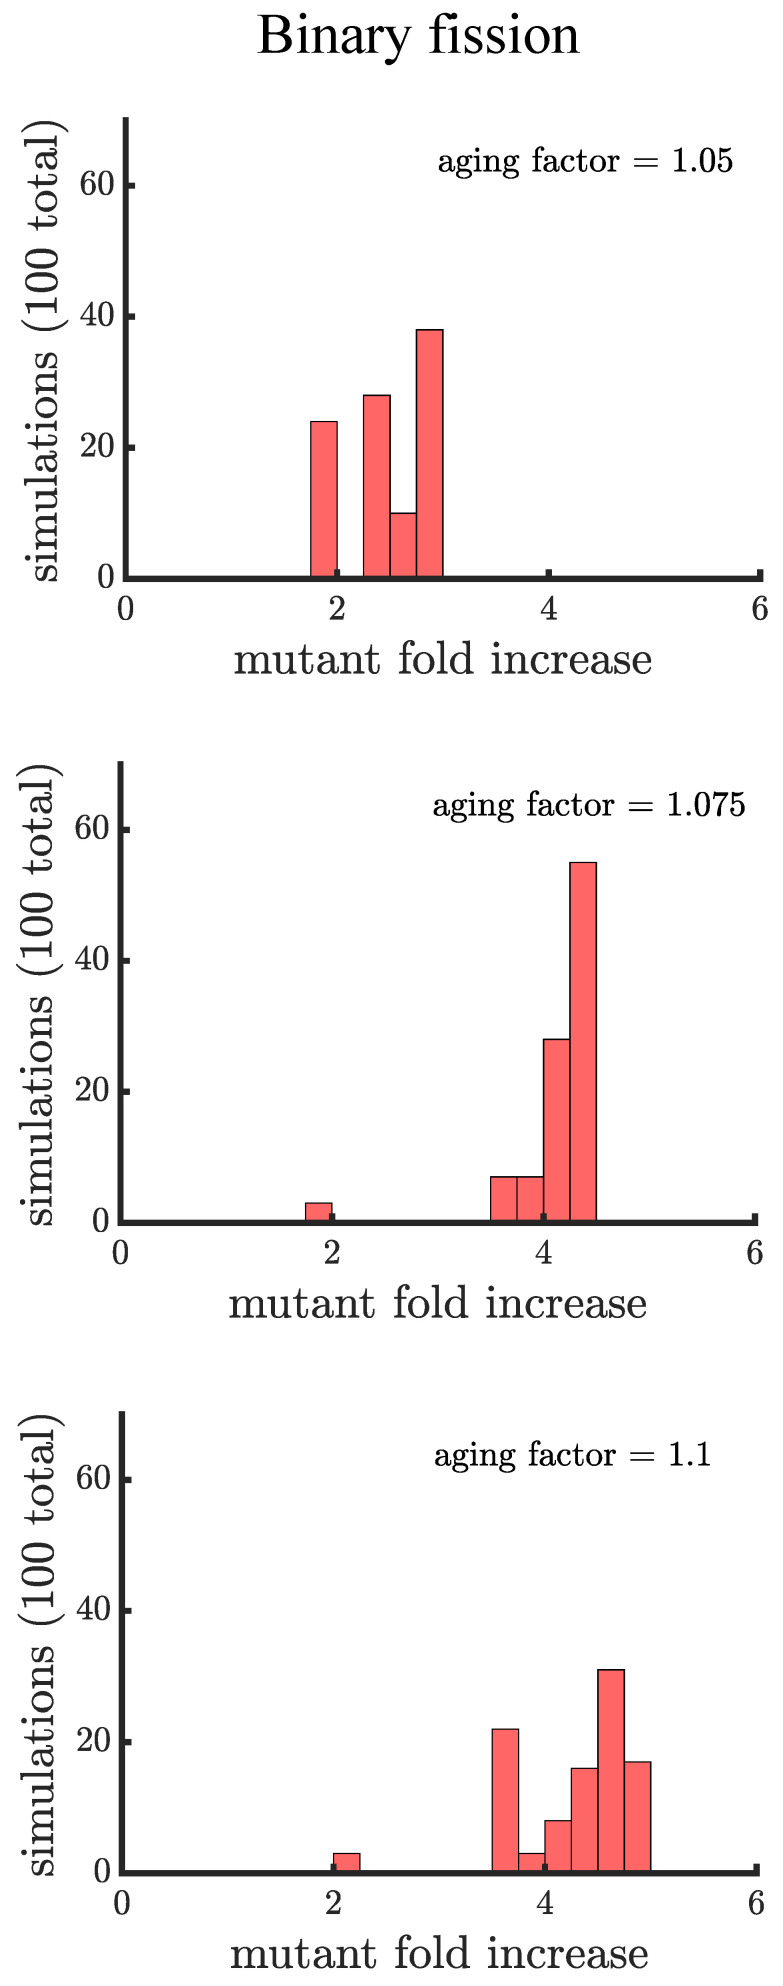
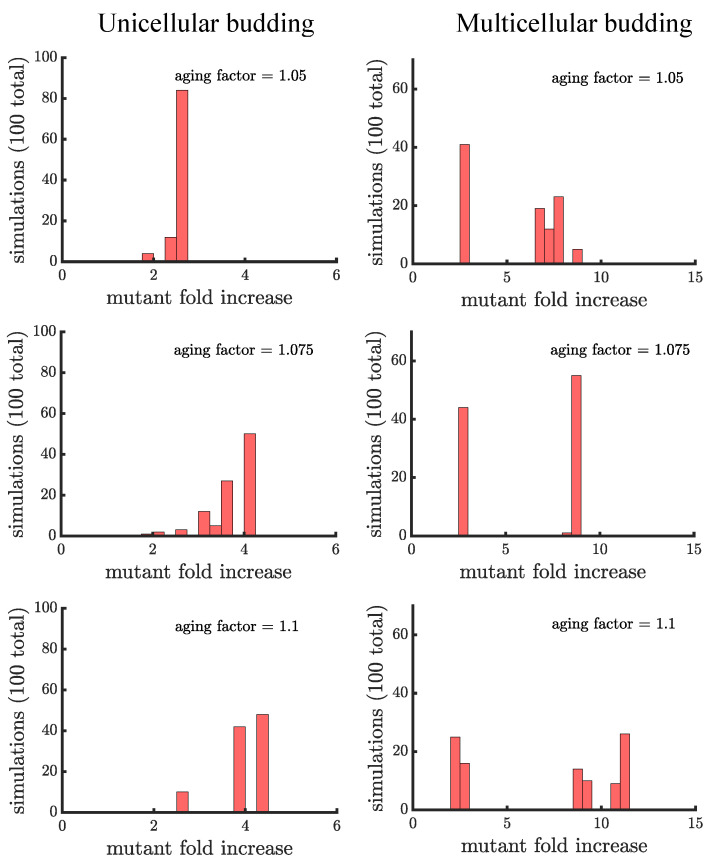
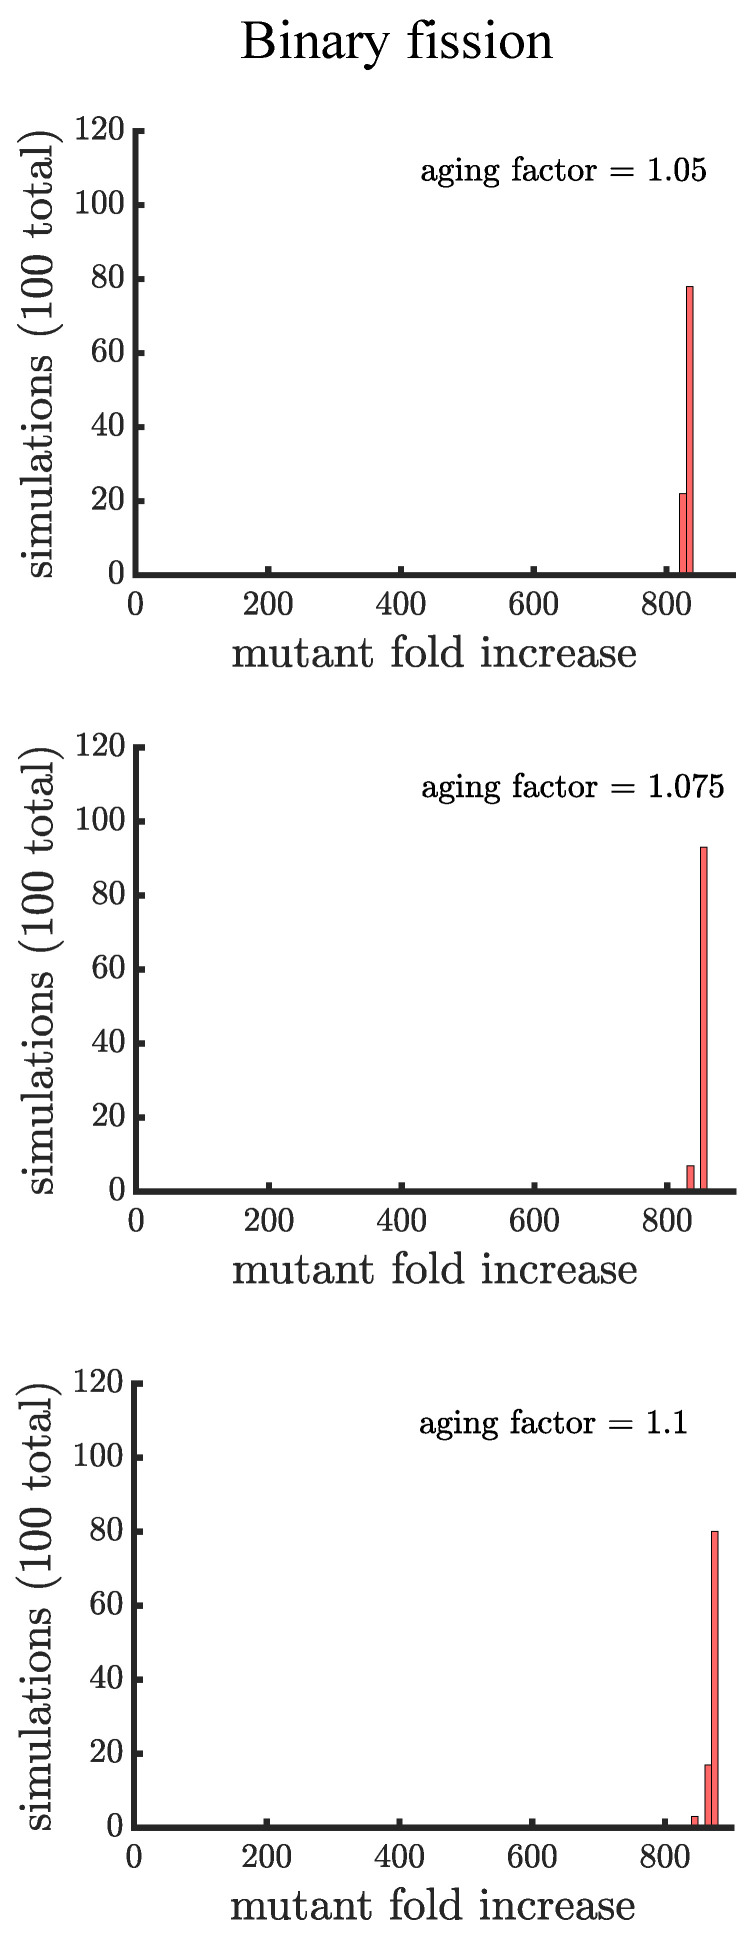
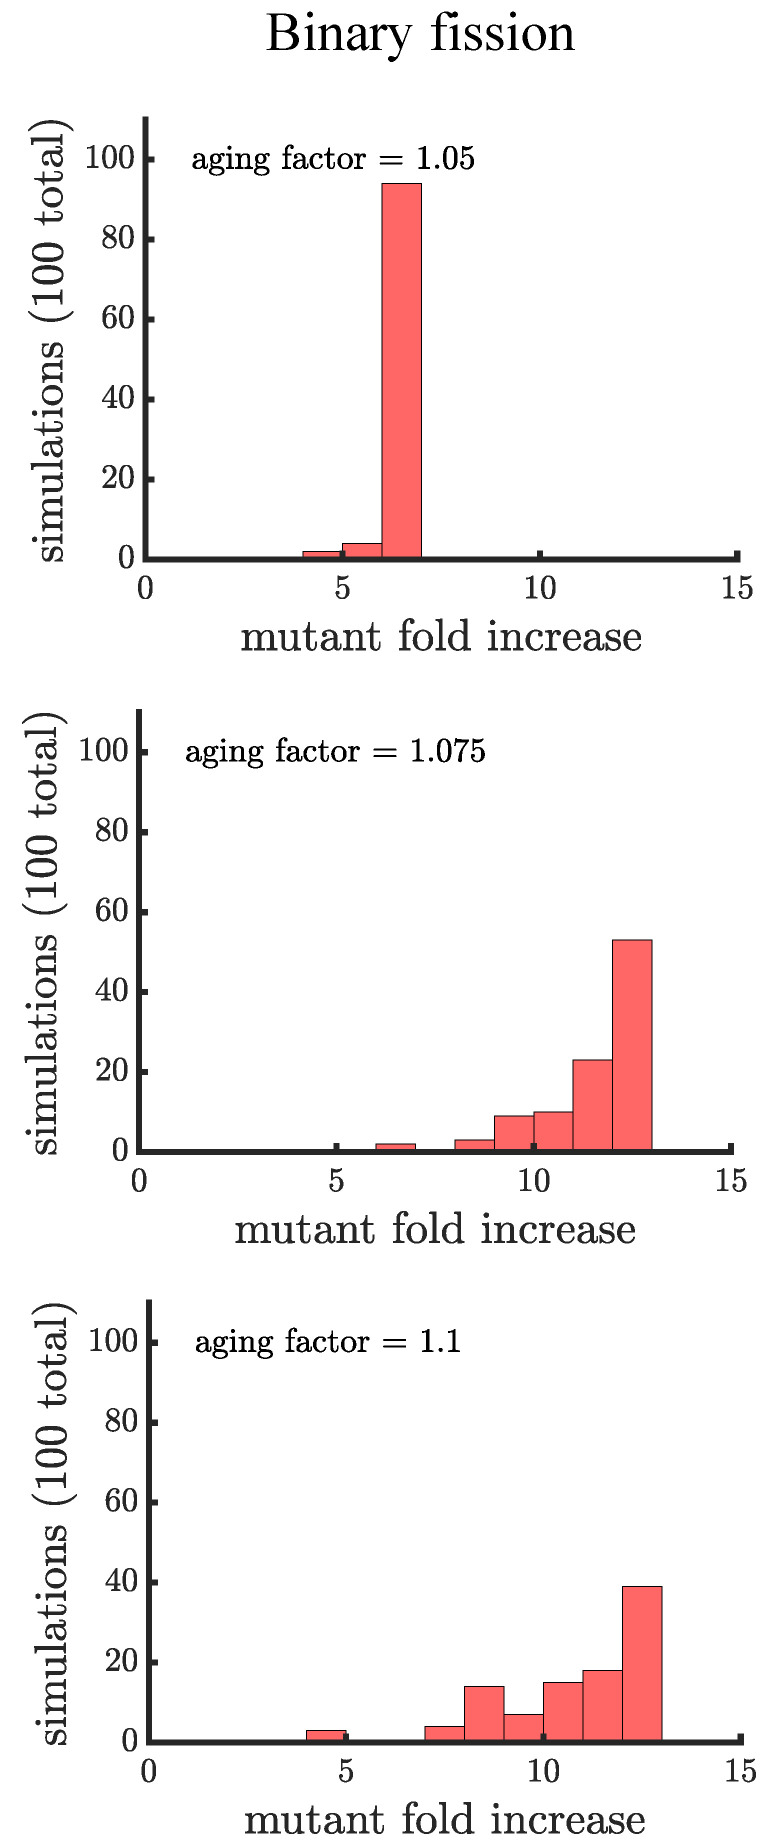
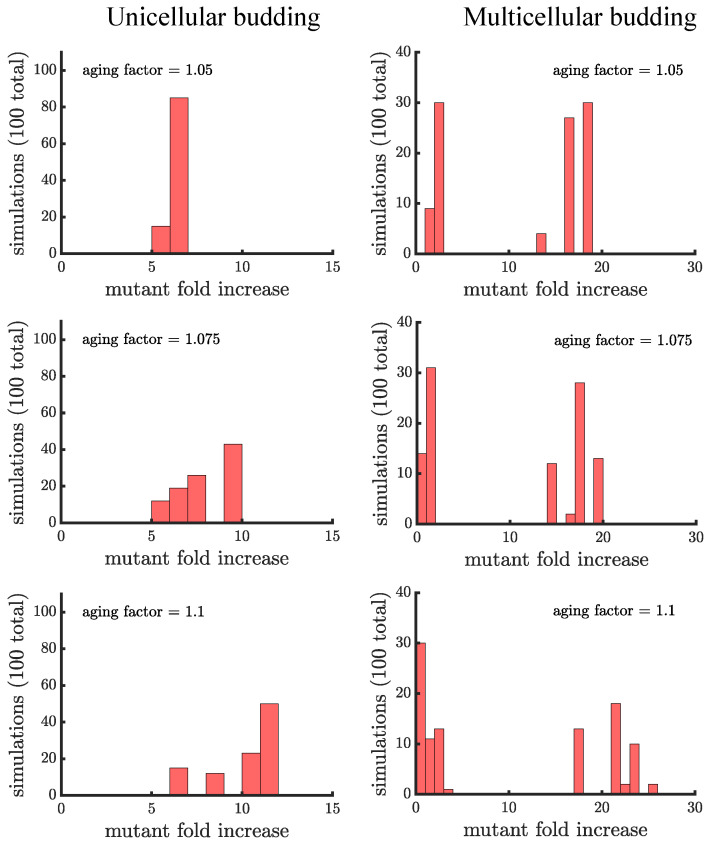
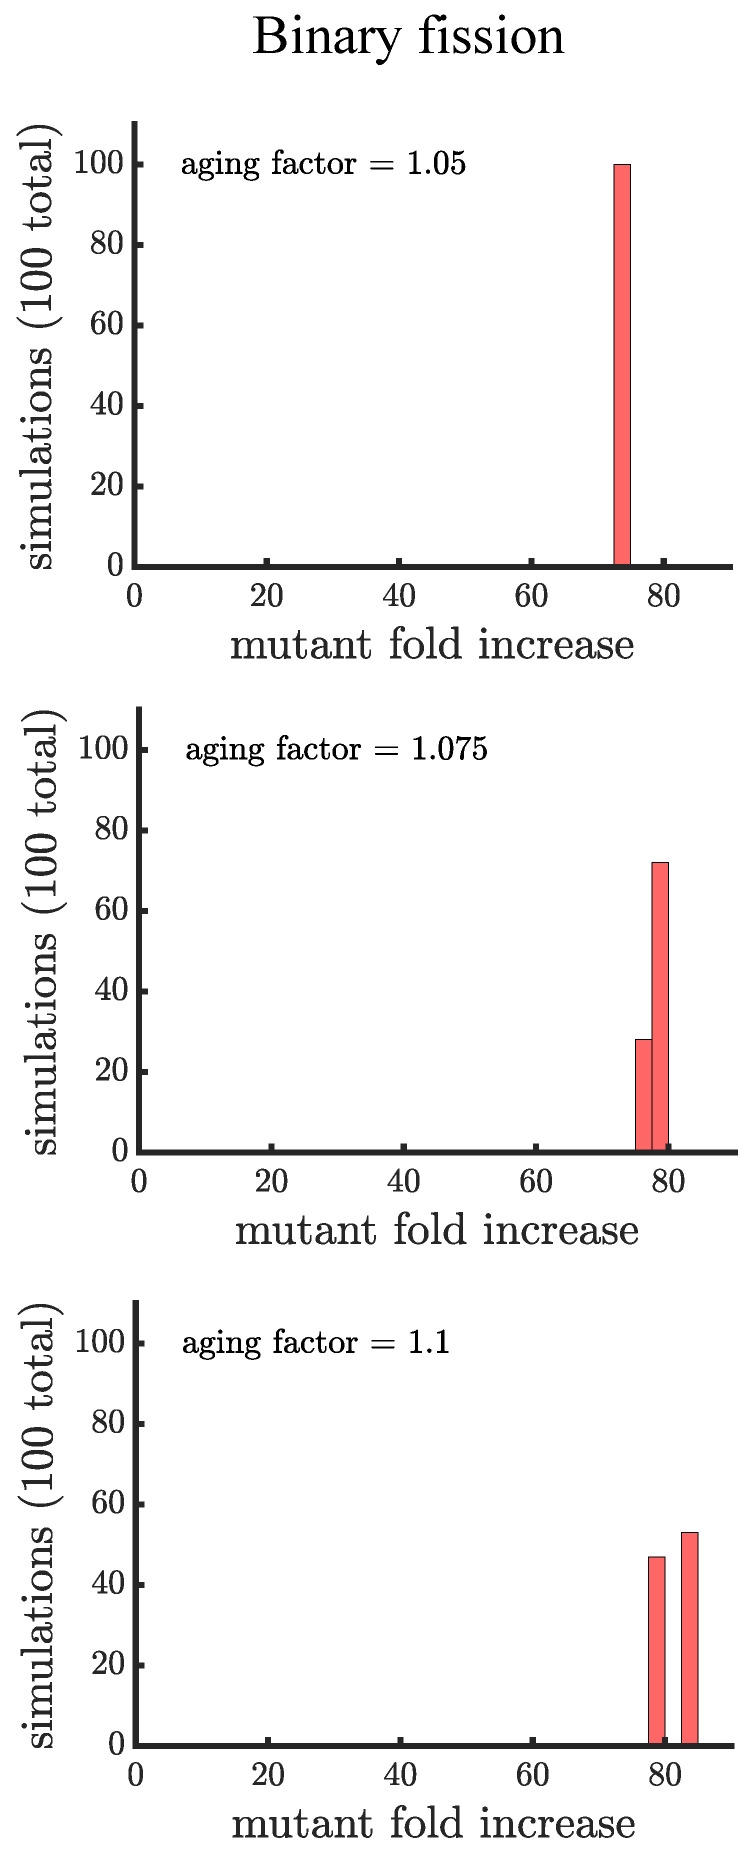
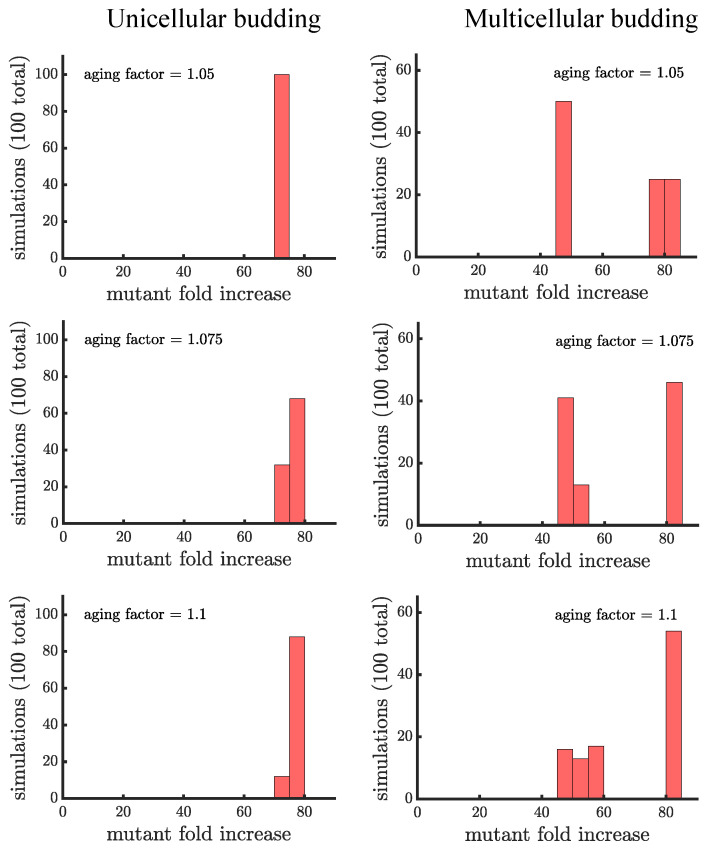
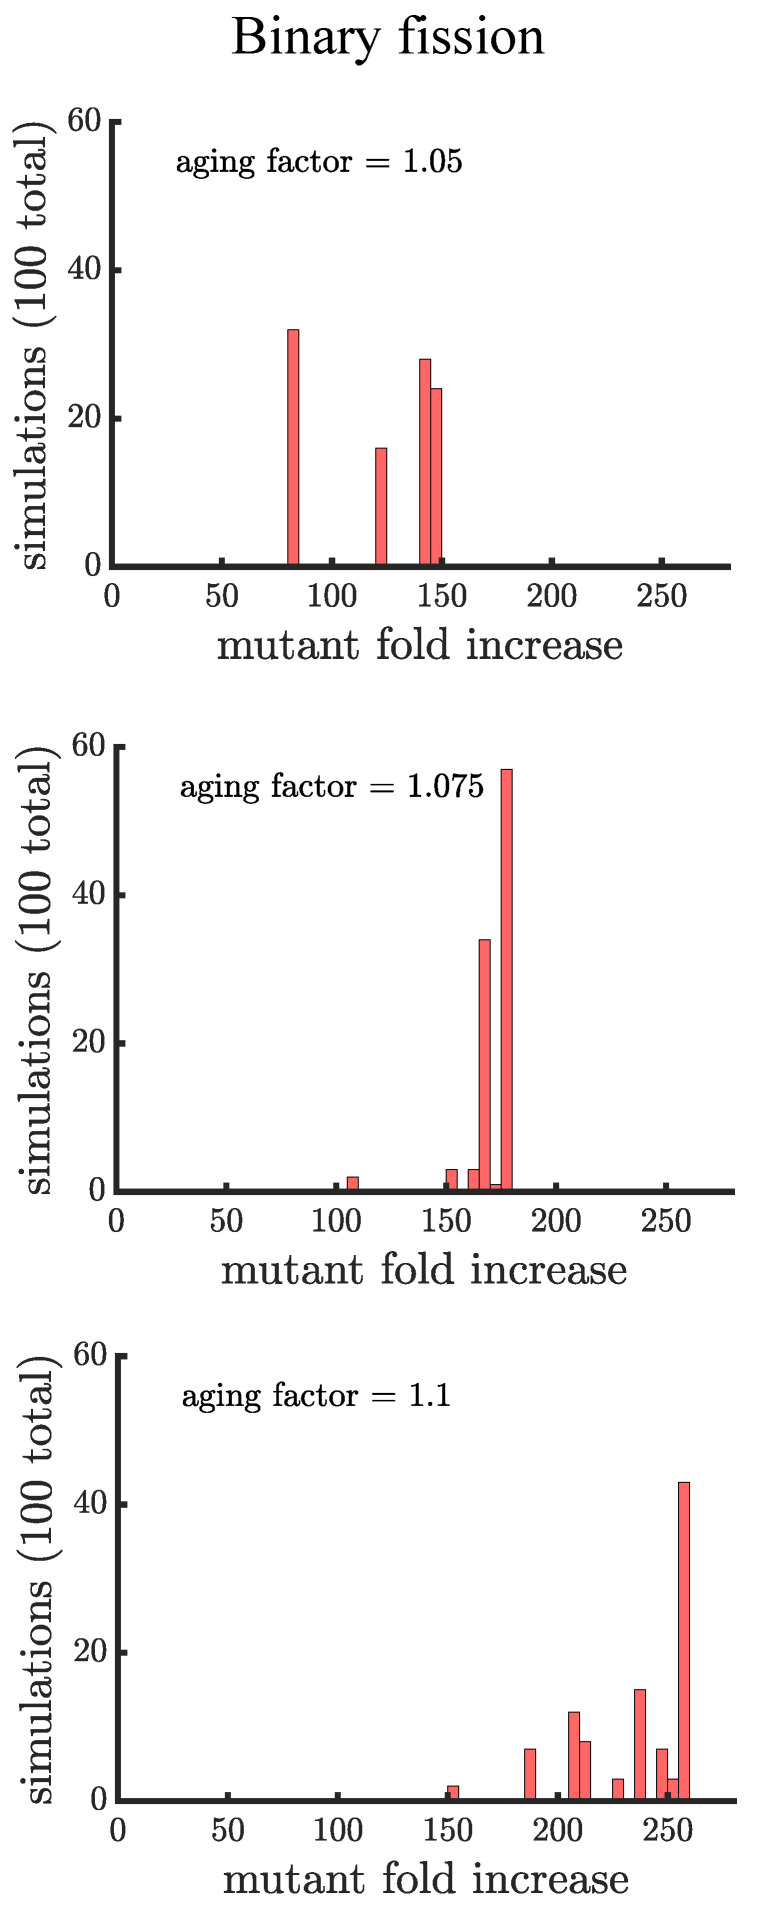
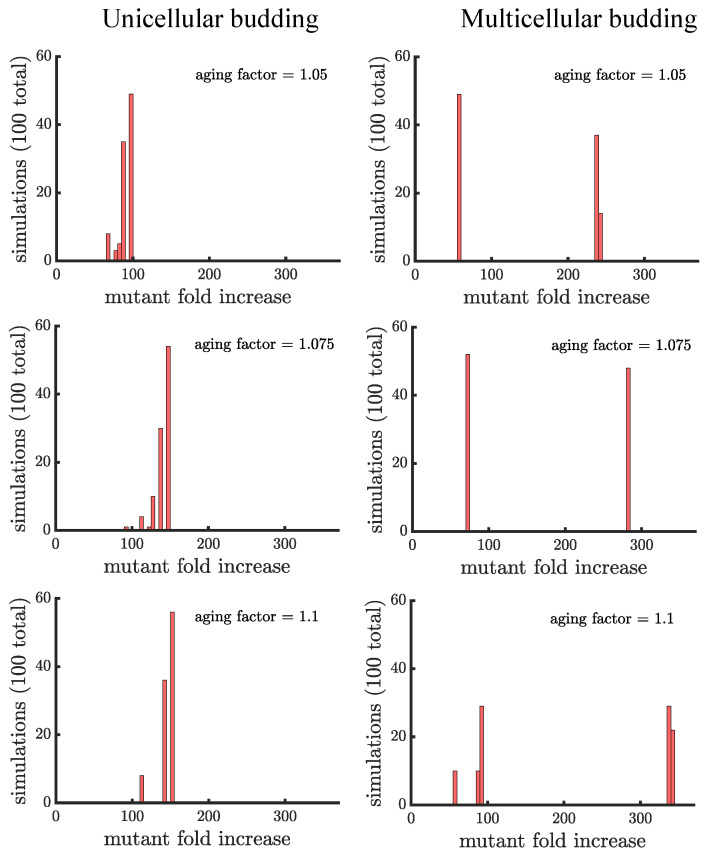
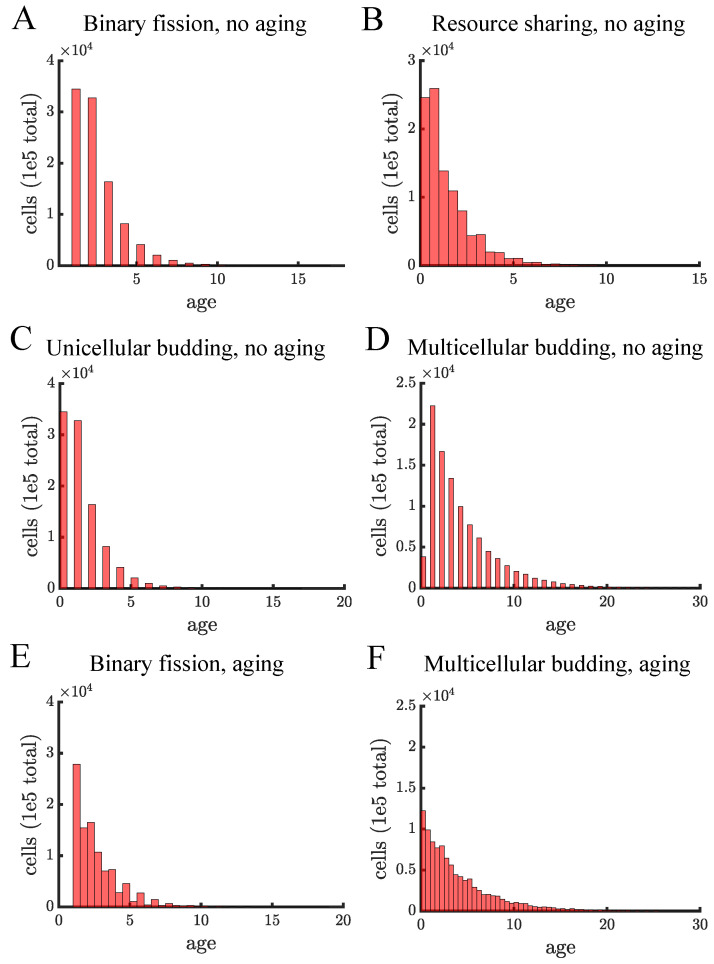
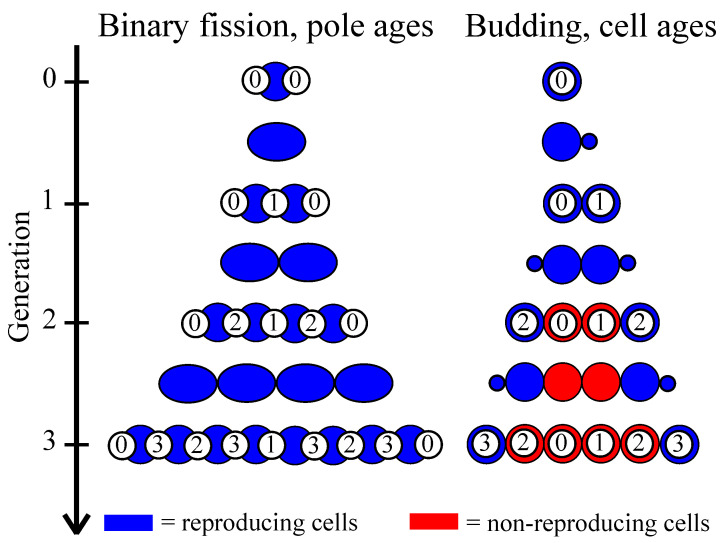
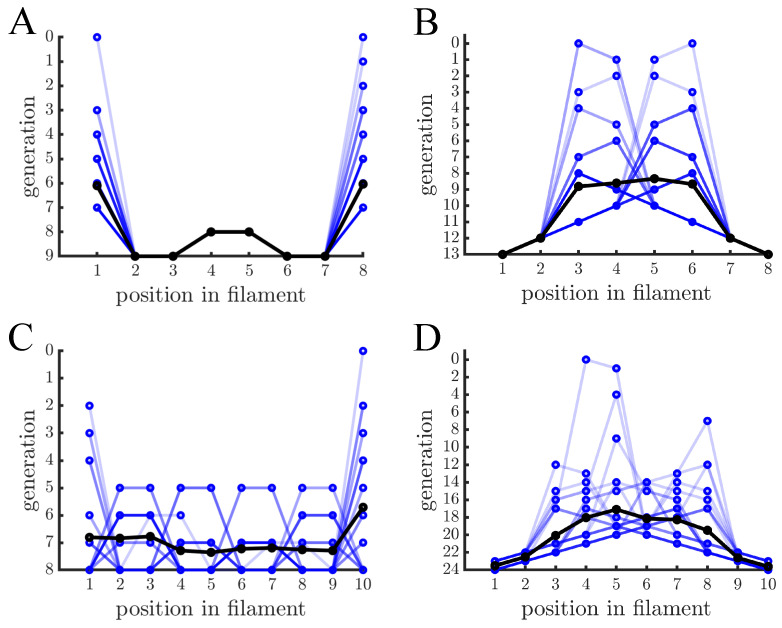
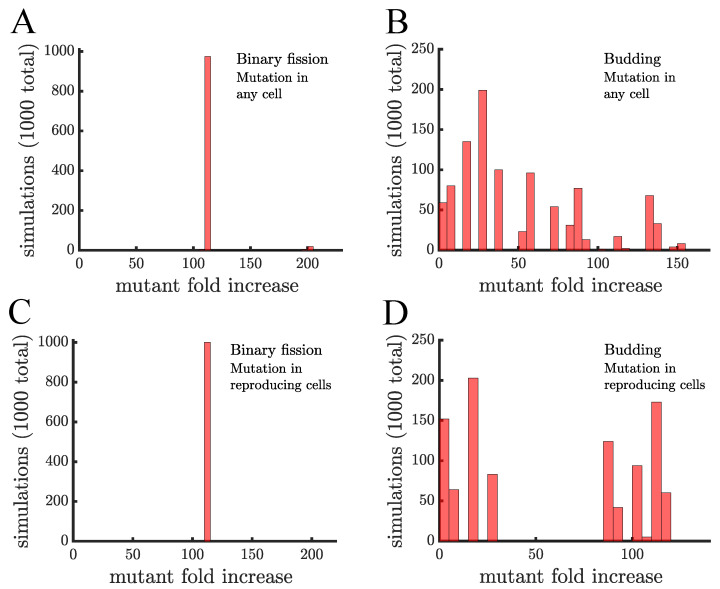
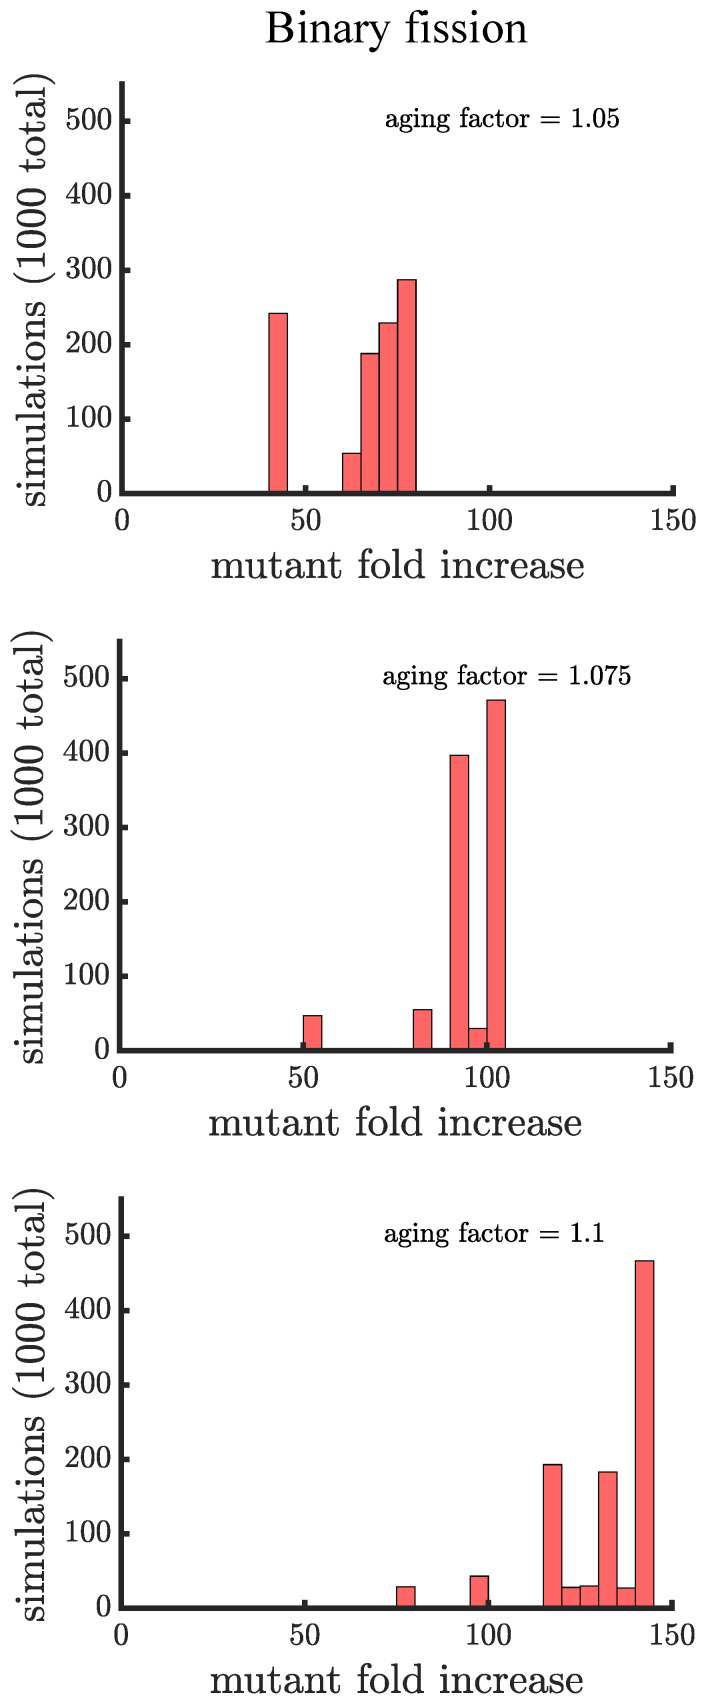
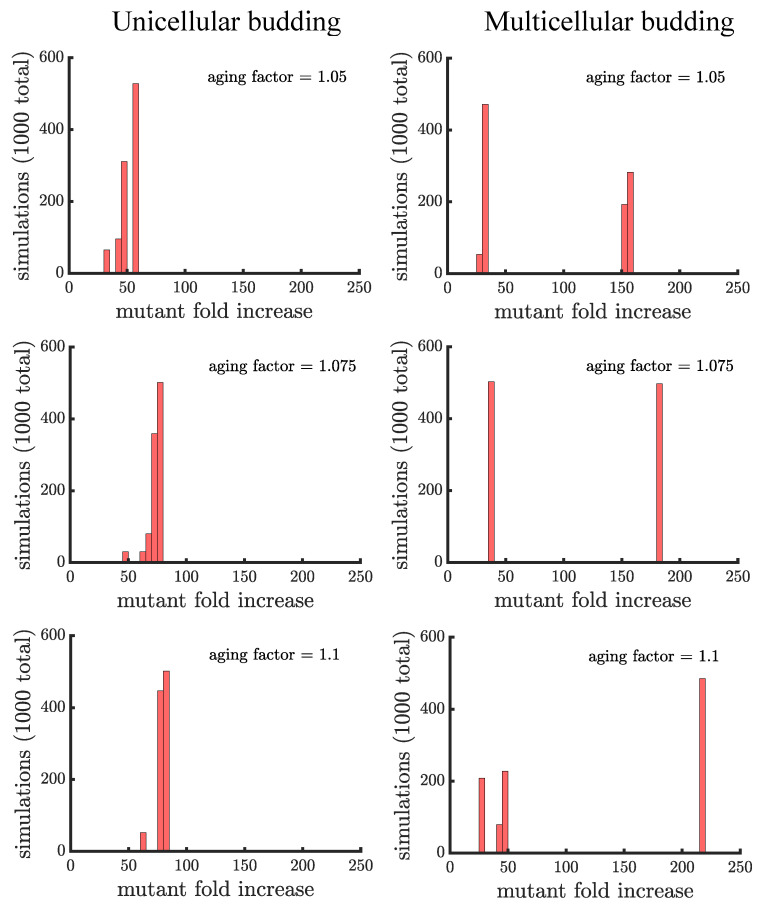
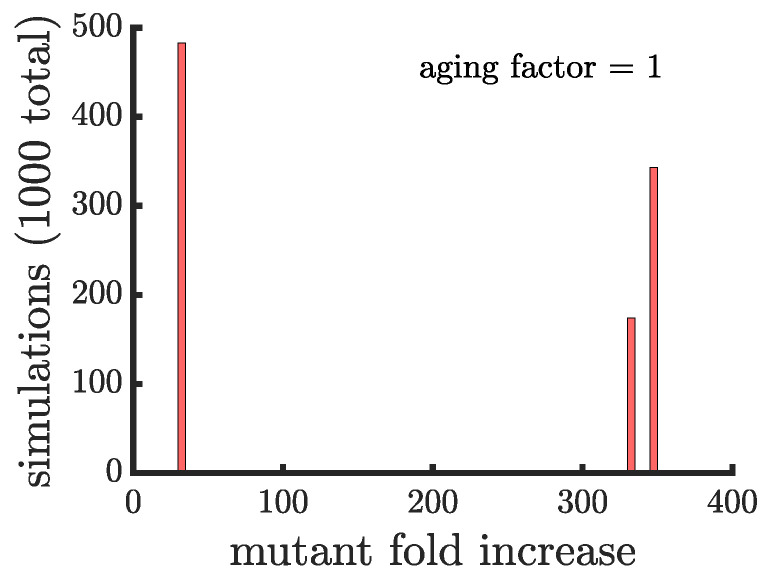
Early multicellular organisms must gain adaptations to outcompete their unicellular ancestors, as well as other multicellular lineages. The tempo and mode of multicellular adaptation is influenced by many factors including the traits of individual cells. We consider how a fundamental aspect of cells, whether they reproduce via binary fission or budding, can affect the rate of adaptation in primitive multicellularity. We use mathematical models to study the spread of beneficial, growth rate mutations in unicellular populations and populations of multicellular filaments reproducing via binary fission or budding. Comparing populations once they reach carrying capacity, we find that the spread of mutations in multicellular budding populations is qualitatively distinct from the other populations and in general slower. Since budding and binary fission distribute age-accumulated damage differently, we consider the effects of cellular senescence. When growth rate decreases with cell age, we find that beneficial mutations can spread significantly faster in a multicellular budding population than its corresponding unicellular population or a population reproducing via binary fission. Our results demonstrate that basic aspects of the cell cycle can give rise to different rates of adaptation in multicellular organisms.

Keywords: adaptation; aging; binary fission; budding; filaments; multicellularity.


Conflict of interest statement

The authors declare no conflict of interest.

Figures

Figure A1
Figure A1
Comparison of the spread of a fast-growing mutation in binary fission populations between a small aging factor and noise in the reproductive times. (top) Plotted is a histogram of the fold increase of the mutant fraction (finalfractioninitialfraction, where the initial fraction is 103) for 100 independent simulations of populations reproducing via binary fission and with an aging factor of 1.025. (middle) Plotted is another histogram similar to the top panel except there is no age-related decrease in growth rate but there is random noise sampled from a normal distribution with 0 mean and standard deviation 0.01. The noise term disrupts the population synchrony, causing the distribution to resemble a population with no noise and an aging factor of 1.025 (bottom) Plotted is a histogram similar to the middle panel except the noise term has a standard of deviation of 0.05. The greater noise leads to more dispersion in the distribution.
Figure A2
Figure A2
The spread of a fast-growing mutation in binary fission populations in which cell age is average pole age. Plotted are histograms of the fold increase of the mutant fraction (finalfractioninitialfraction, where the initial fraction is 103) for 100 independent simulations of populations reproducing via binary fission and with an aging factor of 1.1 (top) and 1.25 (bottom). In comparison with Figure 4 the final mutation fraction is less in populations with an aging factor of 1.1 (i.e., the mutant fold increase distribution is shifted to the left).
Figure A3
Figure A3
Companion to Figure 4 for a mutant with less of a growth rate advantage. Here, the growth rate advantage of the mutant is 25% faster than the wild type, compared to the 50% faster considered in Figure 4 and the main text.
Figure A4
Figure A4
Companion to Figure 5 for a mutant with less of a growth rate advantage. Here, the growth rate advantage of the mutant is 25% faster than the wild type, compared to the 50% faster considered in Figure 5 and the main text.
Figure A5
Figure A5
Companion to Figure 4 for a mutant with more of a growth rate advantage. Here, the growth rate advantage of the mutant is 75% faster than the wild type, compared to the 50% faster considered in Figure 4 and the main text.
Figure A6
Figure A6
Companion to Figure 5 for a mutant with more of a growth rate advantage. Here, the growth rate advantage of the mutant is 75% faster than the wild type, compared to the 50% faster considered in Figure 5 and the main text.
Figure A7
Figure A7
Companion to Figure 4 when the mutant is introduced at a population size of 10,000 versus 1000.
Figure A8
Figure A8
Companion to Figure 5 when the mutant is introduced at a population size of 10,000 versus 1000.
Figure A9
Figure A9
Companion to Figure 4 when the mutant is introduced at a population size of 100 versus 1000.
Figure A10
Figure A10
Companion to Figure 5 when the mutant is introduced at a population size of 100 versus 1000.
Figure A11
Figure A11
Companion to Figure 4 with a population that has double the carrying capacity.
Figure A12
Figure A12
Companion to Figure 5 with a population that has double the carrying capacity.
Figure A13
Figure A13
Age structure for different populations. Each panel shows the distribution of cell ages in a population once it reaches carrying capacity. Each distribution is from a single simulation in which the only stochasticity comes in choosing the final cells to reproduce so that the population reaches carrying capacity exactly. (A) In our model there is no difference between unicellular and multicellular binary fission populations so their age distributions should be identical. Since age in binary fission populations is the age of the oldest pole, there are no cells with age 0. (B) The resource sharing population consists of budding multicellular filaments. The populations reaches carrying capacity at the same time as populations reproducing via binary fission and unicellular budding populations (17 time units). (C) The unicellular budding population has a similar age structure to resource sharing in B). (D) In multicellular budding without aging the population takes much longer to reach carrying capacity (41 time units) which causes the age distribution to be much broader. (E,F) These are similar populations as in (A,D), respectively, except there are growth-related costs of aging in terms of an aging factor of 1.05. In the absence of aging, cells reproduce synchronously so there are fewer possible distinct ages in comparison to populations with an aging factor—this explains why there are more bars in (E,F).
Figure 1
Figure 1
Schematic for cell reproduction via binary fission versus budding in multicellular filaments. Multicellular filaments can arise from cells reproducing via binary fission (left) or budding (right). In binary fission, cells (blue ovals) increase in size and then split down the middle to generate two daughter cells. Each daughter cell gets a newly synthesized pole and one from its parent (white circle with number indicating when it originated). The final age distribution of poles has a characteristic pattern where young and old cell poles are next to one another and the oldest poles are at the ends of the filament. In budding (right) each cell generates a bud that becomes a daughter cell. When budding cells form a multicellular filament this pattern of growth means that only terminal cells can reproduce (non-reproducing cells shown in red). Cell age is then the difference between the current generation and when the cell was created (number in white circle), and so the youngest cells are at the ends of the filament.
Figure 2
Figure 2
Age distribution within multicellular filaments. (A) The age of cells within multicellular filaments is shown as a function of cell position. Cells reproduce via binary fission and filaments reproduce once they reach 8 cells— different blue lines indicate different multicellular filaments and black lines indicate the population mean. A cell’s age corresponds to the generation that its oldest pole was created. In this case the oldest cells are at the ends of the filament and the next oldest cells are in the middle. (B) The graph is similar in structure to (A) except cells reproduce via budding so cell age is the generation in which the cell was created. Contrary to binary fission, the ends of the filaments contain the youngest cells and the older cells are in the middle. (C,D) The graphs are similar to (A,B), respectively, except that multicellular filaments reproduce at 10 cells. Budding has the same basic age structure but binary fission has a less regular pattern because not every cell has reproduced (i.e., filament size is not a power of 2).
Figure 3
Figure 3
The spread of a fast-growing mutant without age-related fitness costs. (A) A histogram shows the fold increase of the mutant fraction (finalfractioninitialfraction, where the initial fraction is 103) for 103 independent simulations of a population reproducing via binary fission. In this panel the mutation is introduced in a random cell from the entire population regardless of when it reproduces. There is almost no dispersion in the histogram because at the point the mutation is introduced every cell is identical. The only outlier bar comes from the case in which the mutation is introduced in a cell that is just about to reproduce, i.e., the mutation is introduced when the population reaches 1000 but by the end of that time step the population will be 1024. (B) This panel shows the same type of data as a) but for a population of cells reproducing via budding. Here, cell reproduction depends on location in the filament so at the point the mutant is introduced cells differ in terms of their next expected reproduction time. The histogram is much more dispersed and the majority of simulations (868) have a lower mutant fold increase than in populations reproducing via binary fission in (A). (C,D) These panels are similar to (A,B), respectively, except the mutant is introduced in cells that just reproduced. This has no effect on binary fission populations but in budding populations it produces a more bimodal distribution with 498 mutations having a fold increase >75 and 502 having a fold increase <30, depending on whether the mutation occurs in the daughter or parent cell, respectively.
Figure 4
Figure 4
The spread of a fast-growing mutant in binary fission populations with age-related fitness costs. Plotted are histograms of the fold increase of the mutant fraction (finalfractioninitialfraction, where the initial fraction is 103) for 103 independent simulations experiencing different age-related fitness costs. The aging factor (the parameter b in Equation (1)) is the multiplicative factor by which reproductive time increases with age such that 1.05 means a 5% increase in reproductive time in the simulations. As the aging factor is increased the distribution shifts to the right indicating that the final mutant fraction increases in simulations. See Appendix C, Appendix D and Appendix E for robustness analyses and companion figures using different simulation parameters.
Figure 5
Figure 5
The spread of a fast-growing mutant in budding populations with age-related fitness costs. (left) Plotted are histograms of the fold increase of the mutant fraction (finalfractioninitialfraction, where the initial fraction is 103) for 103 independent simulations of unicellular budding populations experiencing different age-related fitness costs (similar in structure to Figure 4). Increasing the aging factor shifts the distribution to the right elevating the final mutant fraction. (right) Plotted are another set of histograms similar to the left panel except for multicellular budding populations. Compared to the unicellular budding populations, the distributions are more bimodal. If we consider the higher mode of the distributions we find that again the aging factor increases the final mutant fraction but by a much greater amount than in the corresponding unicellular populations: 216.40±0.82 in a multicellular budding population for an aging factor of 1.1 compared to 79.18±5.64 in the unicellular budding population. See Appendix C, Appendix D and Appendix E for robustness analyses and companion figures using different simulation parameters.
Figure 6
Figure 6
The spread of a fast-growing mutation in multicellular budding populations with resource sharing. The histogram shows the fold increase of the mutant fraction (finalfractioninitialfraction, where the initial fraction is 103) for 103 independent simulations of multicellular budding populations that have resource sharing (k0=0.46) and no age-related fitness costs. The budding populations reach the carrying capacity at the same time as a population reproducing by binary fission. The distribution is still bimodal but the higher part of the distribution has increased by a factor of ≈3 compared to Figure 3.

References

    1. Maynard Smith J., Szathmary E. The Major Transitions in Evolution. Oxford University Press; New York, NY, USA: 1997.
    1. Grosberg R.K., Strathmann R.R. The evolution of multicellularity: A minor major transition? Annu. Rev. Ecol. Evol. Syst. 2007;38:621–654. doi: 10.1146/annurev.ecolsys.36.102403.114735. - DOI
    1. Rokas A. The origins of multicellularity and the early history of the genetic toolkit for animal development. Annu. Rev. Genet. 2008;42:235–251. doi: 10.1146/annurev.genet.42.110807.091513. - DOI - PubMed
    1. Domazet-Lošo T., Tautz D. Phylostratigraphic tracking of cancer genes suggests a link to the emergence of multicellularity in metazoa. BMC Biol. 2010;8:1–10. doi: 10.1186/1741-7007-8-66. - DOI - PMC - PubMed
    1. Aktipis C.A., Boddy A.M., Jansen G., Hibner U., Hochberg M.E., Maley C.C., Wilkinson G.S. Cancer across the tree of life: Cooperation and cheating in multicellularity. Philos. Trans. R. Soc. Biol. Sci. 2015;370:20140219. doi: 10.1098/rstb.2014.0219. - DOI - PMC - PubMed

Publication types

LinkOut - more resources