. 2021 Apr 28;13(9):2131.
doi: 10.3390/cancers13092131.

IFN-γ Critically Enables the Intratumoural Infiltration of CXCR3+ CD8+ T Cells to Drive Squamous Cell Carcinoma Regression

Affiliations

IFN-γ Critically Enables the Intratumoural Infiltration of CXCR3+ CD8+ T Cells to Drive Squamous Cell Carcinoma Regression

Zhen Zeng et al. Cancers (Basel). .

Abstract

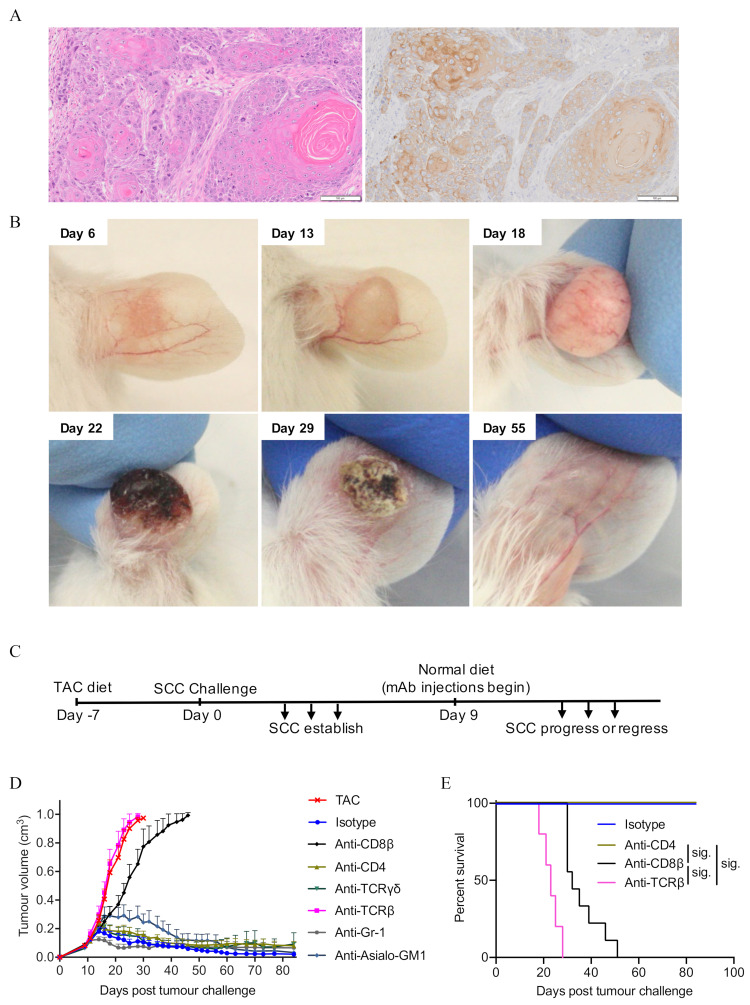
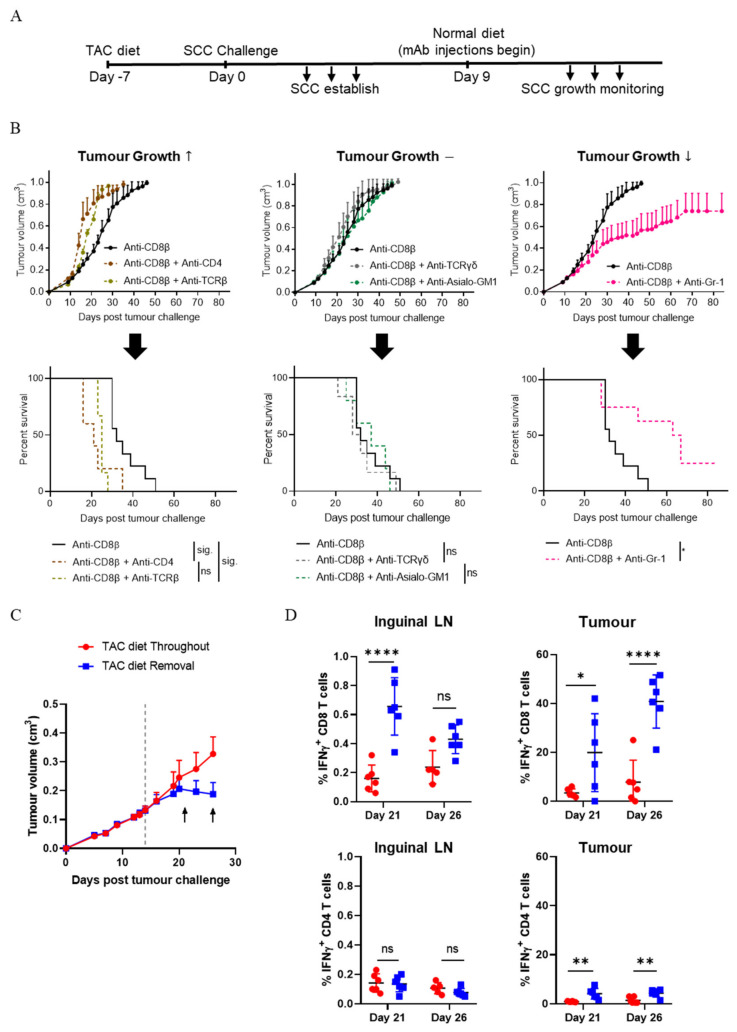
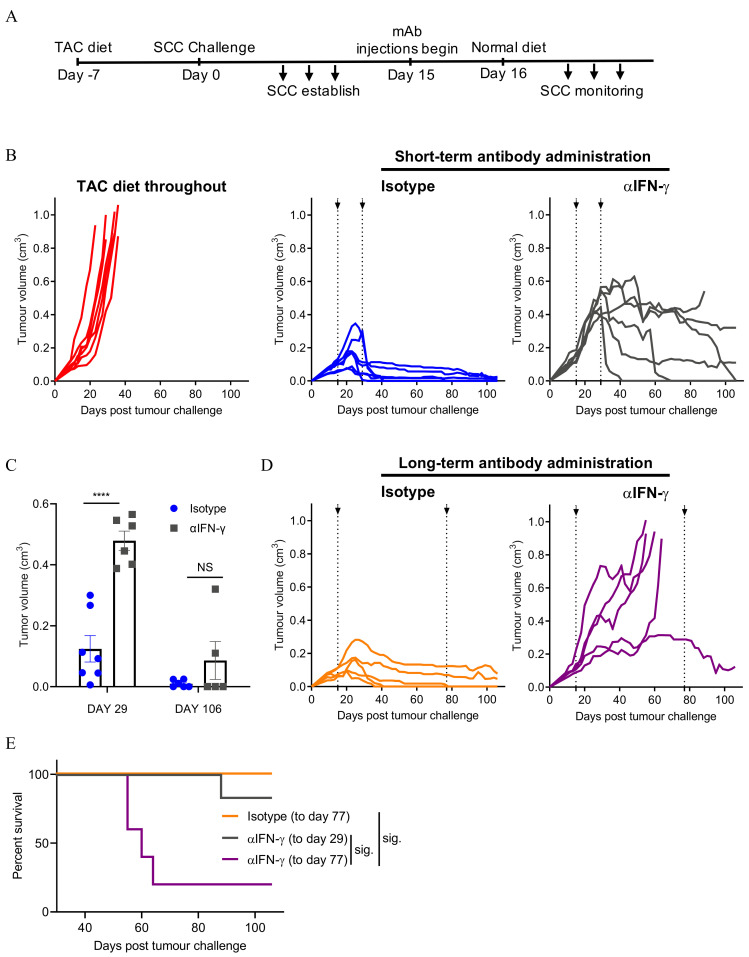
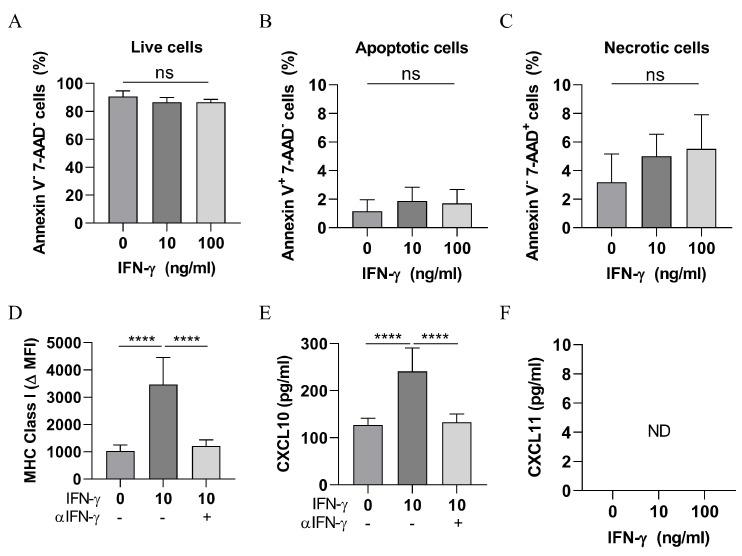
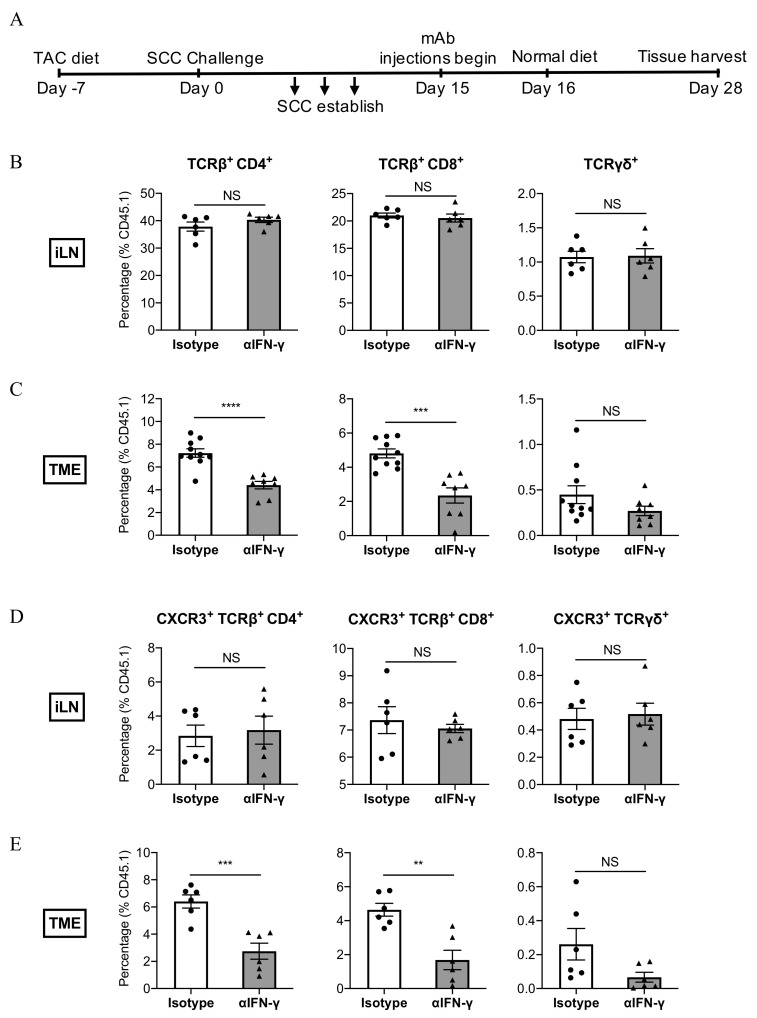
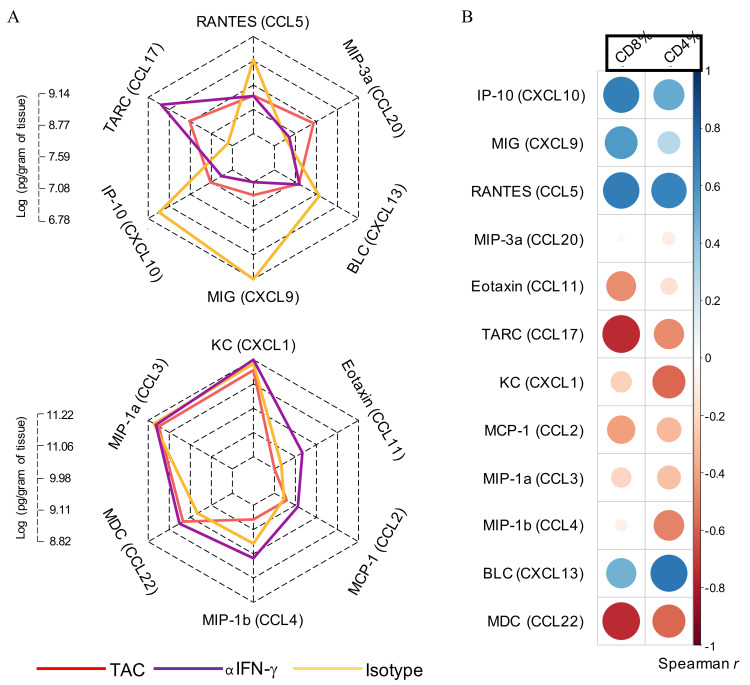
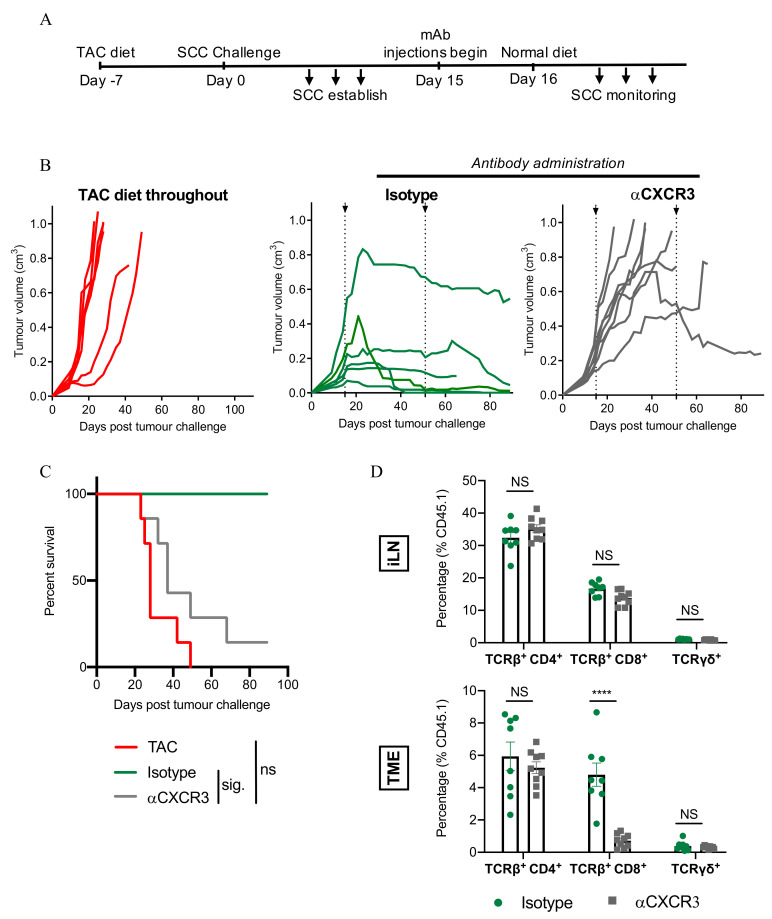
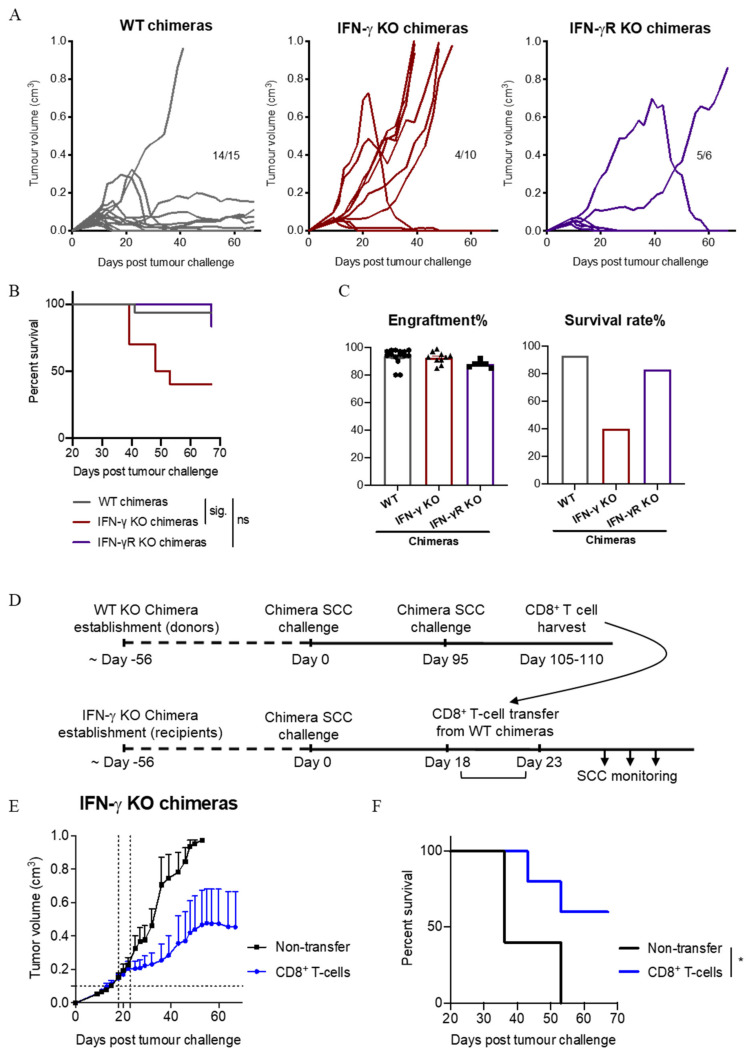
Ultraviolet (UV) radiation-induced tumours carry a high mutational load, are highly immunogenic, and often fail to grow when transplanted into normal, syngeneic mice. The aim of this study was to investigate factors critical for the immune-mediated rejection of cutaneous squamous cell carcinoma (SCC). In our rejection model, transplanted SCC establish and grow in mice immunosuppressed with tacrolimus. When tacrolimus is withdrawn, established SCC tumours subsequently undergo immune-mediated tumour rejection. Through the depletion of individual immune subsets at the time of tacrolimus withdrawal, we established a critical role for CD8+ T cells, but not CD4+ T cells, γδ T cells, or NK cells, in driving the regression of SCC. Regression was critically dependent on IFN-γ, although IFN-γ was not directly cytotoxic to SCC cells. IFN-γ-neutralisation abrogated SCC regression, significantly reduced CD8+ T cell-infiltration into SCC, and significantly impaired the secretion of CXCL9, CXCL10 and CCL5 within the tumour microenvironment. A strong positive correlation was revealed between CXCL10 expression and CD8+ T cell abundance in tumours. Indeed, blockade of the CXCL10 receptor CXCR3 at the time of tacrolimus withdrawal prevented CD8+ T cell infiltration and the regression of SCC. Chimeric models revealed an important role for immune cells as producers of IFN-γ, but not as recipients of IFN-γ signals via the IFN-γ receptor. Together, these findings suggest a key role for IFN-γ in driving the expression of chemokines within the tumour environment essential for the destruction of established SCC by CD8+ T cells.

Keywords: CD8 T cell; IFN-γ; immune control; regression; squamous cell carcinoma.


Conflict of interest statement

The authors declare no conflict of interest. The funders had no role in study design; data collection, analysis, or interpretation; decision to publish; writing of the manuscript; or in the decision to publish the results.

Figures

Figure 1
Figure 1
Depletion of immune subsets highlights a role for CD8+ T cells as mediators of SCC tumour regression. (A) Representative photomicrographs of SCC tumours growing in immunosuppressed mice. Left hand side: H&E; Right hand side: pan-cytokeratin. Scale bar = 100 μm. (B) Example of established SCC regression following the removal of tacrolimus diet on day 13. Ear model used for illustrative purposes only. (C) Treatment schedule for SCC regression experiments. (D) SCC regression following depletion of immune subsets with the indicated antibodies. Combined data from 3 independent experiments (mean ± SEM) shown, n = 5–13/group. (E) Mouse survival in (D). Survival analyses was performed by Log-rank (Mantel-Cox) test. Results then displayed as significant (sig.) after bonferroni-corrected multiple comparison test. Bonferroni-corrected threshold = 0.0125, K = 4.
Figure 2
Figure 2
Multiple immune subsets impact upon SCC growth rate. (A) Treatment schedule for immune subset depletion experiments. (B) Tumour growth rate and corresponding survival curves following depletion with the indicated antibodies. Combined data from 3 independent experiments (mean ± SEM) shown, n = 5–13/group. Survival analyses was performed by Log-rank (Mantel-Cox) test. Results then displayed as significant (sig.) or not significant (ns) after bonferroni-corrected multiple comparison test (bottom left and bottom middle). Bonferroni-corrected threshold = 0.016, K = 3. Bottom right: Survival analyses was performed by Log-rank (Mantel-Cox) test (*, p < 0.05; **, p<0.01; ****, p<0.0001). (C) Time points assessed for T cell-associated IFN-γ production in lymph nodes and tumours of mice undergoing SCC regression. TAC diet removed on day 14 as indicated by horizontal dotted line. Arrows indicate harvest timepoints (left, day 21; right, day 26). Mean ± SEM, n = 12/group. (D) Analysis of day 21 and day 26 CD8+-and CD4+ T cell IFN-γ production as described in (C). n = 6/time point/group. Two-way ANOVA, bars represent mean ± SEM, data points represent individual mice.
Figure 3
Figure 3
IFN-γ neutralisation abrogates SCC rejection. (A) Experimental schedule. (B) SCC growth pattern following short-term treatment with the indicated antibodies. Combined data from 2 independent experiments, individual tumour growth shown, n = 6–7/group. (C) Tumour volume during (Day 29) and after cessation (Day 106) of anti-IFN-γ treatment. Two-way ANOVA, bars represent mean ± SEM, data points represent individual mice. p < 0.0001 (****), (D) SCC growth pattern following long-term treatment with the indicated antibodies. Combined data from 2 independent experiments, individual tumours shown, n = 5/group. (E) Comparison of mouse survival in B and D. Survival analyses was performed by Log-rank (Mantel-Cox) test. Results then displayed as significant (sig.) after bonferroni-corrected multiple comparison test. Bonferroni-corrected threshold = 0.016, K = 3. Dotted lines in (B,D) indicate the period of antibody administration.
Figure 4
Figure 4
Direct effects of IFN-γ on SCC. (AC) Viability of SCC cells following IFN-γ treatment. SCC cells were treated with IFN-γ for 72 h and then assessed for Annexin V and 7AAD staining by flow cytometry. Bars represent mean ± SD, n = 6/group, one-way ANOVA. (D) MHC class I expression. The delta mean-fluorescence-intensity (∆MFI) of H-2Kq is shown. Bars represent mean ± SD, n = 6–9/group, one-way ANOVA followed by Tukey’s multiple comparisons test. p < 0.0001 (****), (E) CXCL10 and (F) CXCL11 secretion in supernatants assessed by ELISA assay. Bars represent the mean ± SD, n = 6–9/group, one-way ANOVA followed by Tukey’s multiple comparisons test (E). Data are derived from 3 independent experiments with similar results. p < 0.0001 (****), ND = not detected. ns = not significant.
Figure 5
Figure 5
IFN-γ neutralisation reduces the number of CD8+ T cells that infiltrate into SCC. (A) Experimental schedule. (B,C) Abundance of T cell subsets, and (D,E) abundance of CXCR3-expressing T cell subsets in the inguinal lymph nodes (iLN) or tumour microenvironment (TME) respectively. Indicated antibody treatments started on day 15 and continued up to the point of tissue harvest. Each dot corresponds to one mouse, bars represent the mean ± SEM. (BE) Data are derived from 3 independent experiments, n = 6–10/group, and are normalised to CD45.1 expression to mitigate the impact caused by large differences in total cell counts when comparing mice with regressing and non-regressing tumours. Statistical analysis was performed by unpaired Student’s t-test. p < 0.01 (**), p < 0.001 (***), p < 0.0001 (****).
Figure 6
Figure 6
IFN-γ neutralisation alters chemokine abundance within the tumour microenvironment. (A) Homogenized tumour samples were analyzed by cytometric bead array to determine chemokine content. Radar charts of mean log-abundance values of chemokines. The axis length at each radius ranges from the minimum to maximum magnitude of log-abundance values across the analytes and the axis labels mark the log-abundance values at quartile intervals (0%, 25%, 50%, 75%, 100%). (B) Correlation analysis of chemokine expression with T cell infiltrate. Spearman correlation r values are plotted as a heatmap with the area of each circle corresponding to the strength of the correlation. Blue = positive correlation, Red = negative correlation. The correlation and statistical testing was performed using the rcorr function embedded in the Hmisc R package. TAC = tacrolimus.
Figure 7
Figure 7
The CXCL10/CXCL11/CXCR3 axis plays a role in SCC regression. (A) Experimental schedule. (B) SCC growth pattern following treatment with the indicated antibodies. Combined data from 2 independent experiments, individual tumours shown, n = 6–8/group. (C) Survival comparisons of mice in B. Survival analyses were performed by Log-rank (Mantel-Cox) test. Results then displayed as significant (sig.) or not significant (ns) after bonferroni-corrected multiple comparison test. Bonferroni-corrected threshold = 0.016, K = 3. (D) Abundance of T cell subsets (%) in the inguinal lymph nodes (iLN) or in the tumour microenvironment (TME), as shown. Two-way ANOVA, bars represent mean ± SEM, data points represent individual mice. Data are combined from 2 independent experiments. p < 0.0001 (****), Dotted lines in (B) indicate the period of antibody administration.
Figure 8
Figure 8
IFN-γ secretion by CD8+ T cells is important for SCC tumour control. (A) SCC establishment in individual chimeric mice. n = 15 WT, 10 IFN-γ−/−, and 6 IFN-γR−/−. Data shown are combined from 4 independent experiments. Numbers in panels represent the proportion of mice alive at the end of the experiment. (B) Comparison of mouse survival in A. Survival analyses was performed by Log-rank (Mantel-Cox) test. Results then displayed as significant (sig.) or not significant (ns) after bonferroni-corrected multiple comparison test. Bonferroni-corrected threshold = 0.016, K = 3. (C) Bone marrow engraftment efficiency and survival percentage in A. Data points represent individual mice. (D) Experimental schedule for CD8+ T cell transfer experiments into tumour-bearing IFN-γ KO chimeras. (E) Growth of established SCC tumours before and after CD8+ T cell transfer. T cells were transferred when individual tumours reached 0.1 cm3 (indicated by horizontal dotted line), which occurred between days 18 and 23 (represented by vertical dotted lines). Data shown combined from 2 independent experiments, mean ± SEM, n = 5/group. (F) Comparison of mouse survival in E. Survival analysis was performed by Log-rank (Mantel-Cox) test. *, p < 0.05.

References

    1. Rogers H.W., Weinstock M.A., Feldman S.R., Coldiron B.M. Incidence Estimate of Nonmelanoma Skin Cancer (Keratinocyte Carcinomas) in the U.S. Population, 2012. JAMA Dermatol. 2015;151:1081–1086. doi: 10.1001/jamadermatol.2015.1187. - DOI - PubMed
    1. Jung J.-W., Overgaard N.H., Burke M.T., Isbel N., Frazer I.H., Simpson F., Wells J.W. Does the nature of residual immune function explain the differential risk of non-melanoma skin cancer development in immunosuppressed organ transplant recipients? Int. J. Cancer. 2015;138:281–292. doi: 10.1002/ijc.29450. - DOI - PubMed
    1. Chockalingam R., Downing C., Tyring S.K. Cutaneous Squamous Cell Carcinomas in Organ Transplant Recipients. J. Clin. Med. 2015;4:1229–1239. doi: 10.3390/jcm4061229. - DOI - PMC - PubMed
    1. Geissler E.K. Skin cancer in solid organ transplant recipients: Are mTOR inhibitors a game changer? Transplant. Res. 2015;4:1. doi: 10.1186/s13737-014-0022-4. - DOI - PMC - PubMed
    1. Lindelof B. Incidence of skin cancer in 5356 patients following organ transplantation. Br. J. Dermatol. 2000;143:513. doi: 10.1046/j.1365-2133.2000.03703.x. - DOI - PubMed

LinkOut - more resources