. 2021 Apr 28;23(5):543.
doi: 10.3390/e23050543.

Entropy of the Land Parcel Mosaic as a Measure of the Degree of Urbanization

Affiliations

Entropy of the Land Parcel Mosaic as a Measure of the Degree of Urbanization

Agnieszka Bitner et al. Entropy (Basel). .

Abstract

Quantifying the urbanization level is an essential yet challenging task in urban studies because of the high complexity of this phenomenon. The urbanization degree has been estimated using a variety of social, economic, and spatial measures. Among the spatial characteristics, the Shannon entropy of the landscape pattern has recently been intensively explored as one of the most effective urbanization indexes. Here, we introduce a new measure of the spatial entropy of land that characterizes its parcel mosaic, the structure resulting from the division of land into cadastral parcels. We calculate the entropies of the parcel areas' distribution function in different portions of the urban systems. We have established that the Shannon and Renyi entropies R0 and R1/2 are most effective at differentiating the degree of a spatial organization of the land. Our studies are based on 30 urban systems located in the USA, Australia, and Poland, and three desert areas from Australia. In all the cities, the entropies behave the same as functions of the distance from the center. They attain the lowest values in the city core and reach substantially higher values in suburban areas. Thus, the parcel mosaic entropies provide a spatial characterization of land to measure its urbanization level effectively.

Keywords: Renyi entropy; Shannon entropy; city growth; land division pattern; land fragmentation; land parcel; spatial analysis; urbanization.


Conflict of interest statement

The authors declare no conflict of interest.

Figures

Figure 1
Figure 1
The land parcel mosaic of Warwick (AU) urban system (left), and the corresponding arrangement of the centroids of the parcels (right). The solid lines represent boundaries of the parcels. The areas of the parcels whose centroids lie within the pinkish ring are collected and used to prepare histogram.
Figure 2
Figure 2
Shannon entropy, S, as a function of the distance from the center obtained for the city of Warwick (AU). The solid line represents a fit of Equation (12) to the data. The values of Smin and Ssur are indicated.
Figure 3
Figure 3
The entropies R2, R1/2, R0, R1/2, S, and R2 plotted as functions of the distance from the center of a city of Dalby (AU).
Figure 4
Figure 4
Shannon entropy plotted as a function of r for selected urban systems.
Figure 5
Figure 5
Renyi entropy, R0, plotted as a function of r for selected urban systems.
Figure 6
Figure 6
Renyi entropy, R1/2, plotted as a function of r for selected urban systems.
Figure 7
Figure 7
Two samples of the land parcel mosaic observed in (a) 4 km from the center of Brisbane, and (b) in the suburban region of Brisbane at the distance of 25 km from the center. In both cases the scale bar is 500 m. The white color in the maps represents streets that are excluded from the analysis. The corresponding parcel area probability distribution functions are shown on the (right).
Figure 8
Figure 8
The dependence of the relative entropy R0supR0 as a function of the distance from the center plotted for selected cities.
Figure 9
Figure 9
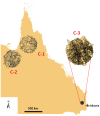
Location of the areas C-1, C-2, and C-3 on the map of Queensland in Australia. The solid lines represent boundaries of the land parcels.
Figure 10
Figure 10
Parcel area probability distribution function calculated for the area C-1.
Figure 11
Figure 11
Summary of results for the urban systems and three desert areas for (a) S, (b) R0, and (c) R1/2. The numbers on the abscissa correspond to the numbers of the urban systems and the desert areas that are given in Table 1 and Table 3.

References

    1. Purvis B., Mao Y., Robinson D. Entropy and its Application to Urban Systems. Entropy. 2019;21:56. doi: 10.3390/e21010056. - DOI - PMC - PubMed
    1. Batty M. Spatial Entropy. Geogr. Anal. 1974;6:1–31. doi: 10.1111/j.1538-4632.1974.tb01014.x. - DOI
    1. Batty M., Morphet R., Masucci P., Stanilov K. Entropy, complexity, and spatial information. J. Geogr. Syst. 2014;16:363–385. doi: 10.1007/s10109-014-0202-2. - DOI - PMC - PubMed
    1. Punia M., Singh L. Entropy Approach for Assessment of Urban Growth: A Case Study of Jaipur, India. J. Indian Soc. Remote Sens. 2012;40:231–244. doi: 10.1007/s12524-011-0141-z. - DOI
    1. Cabral P., Augusto G., Tewolde M., Araya Y. Entropy in Urban Systems. Entropy. 2013;15:5223–5236. doi: 10.3390/e15125223. - DOI

LinkOut - more resources