. 2021 Apr 28;22(9):4680.
doi: 10.3390/ijms22094680.

Skeletal Muscle Proteomic Profile Revealed Gender-Related Metabolic Responses in a Diet-Induced Obesity Animal Model

Affiliations

Skeletal Muscle Proteomic Profile Revealed Gender-Related Metabolic Responses in a Diet-Induced Obesity Animal Model

Manuela Moriggi et al. Int J Mol Sci. .

Abstract

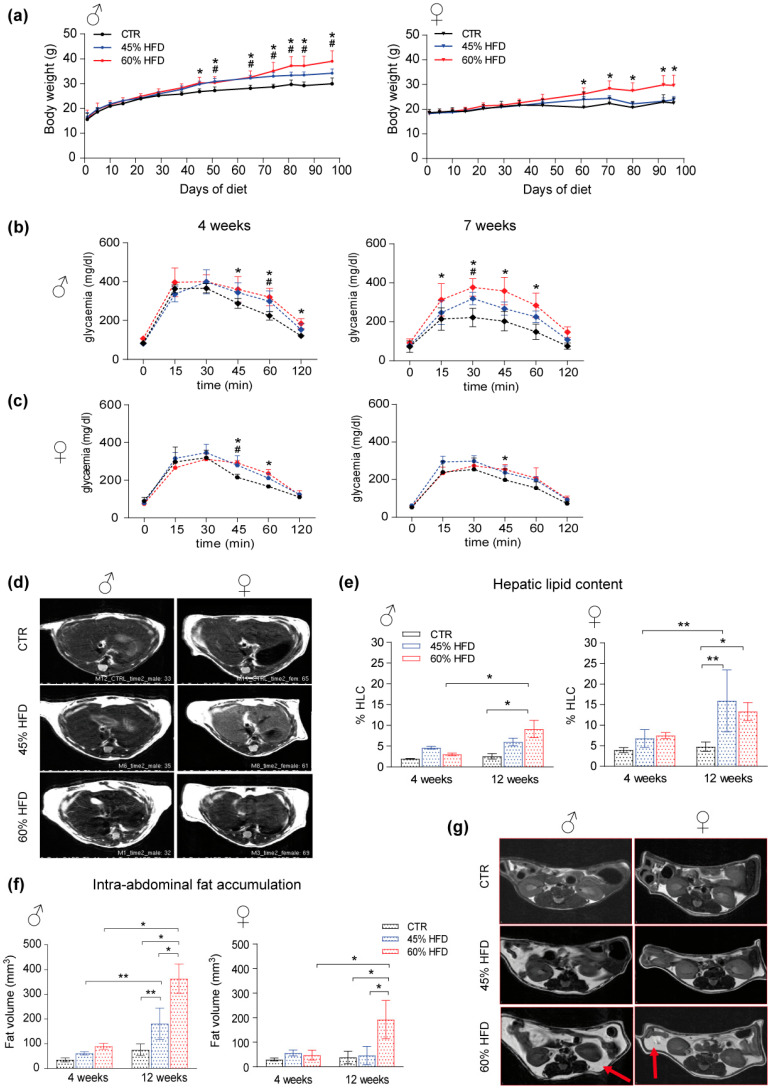
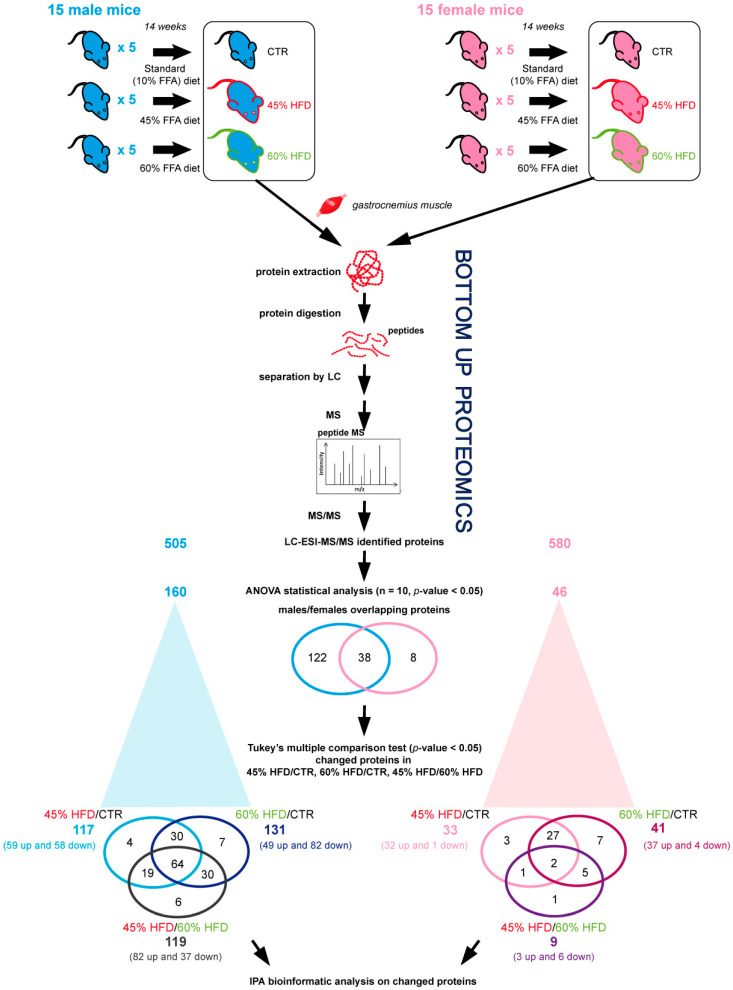
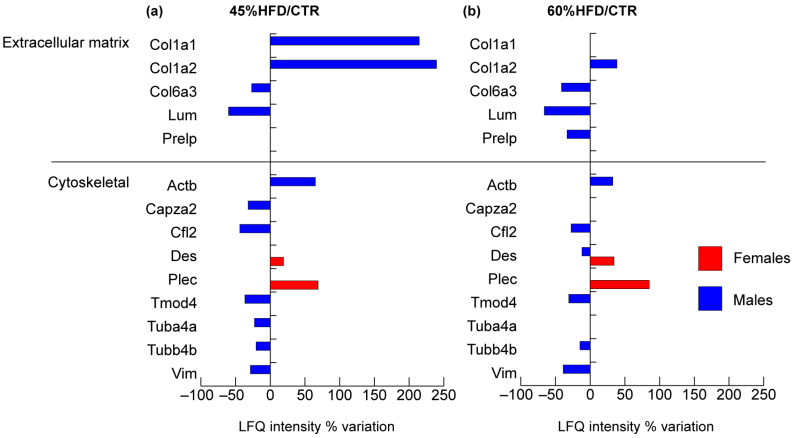
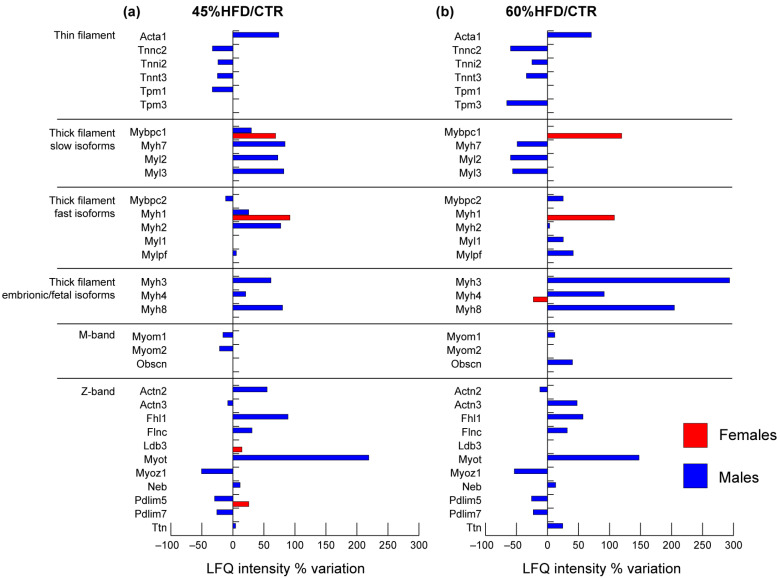
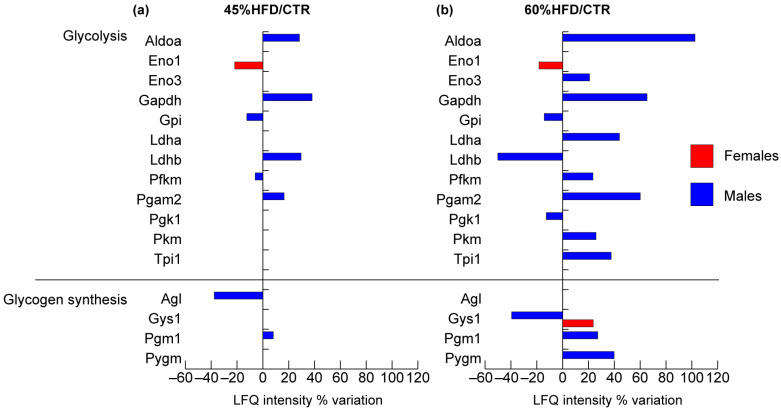
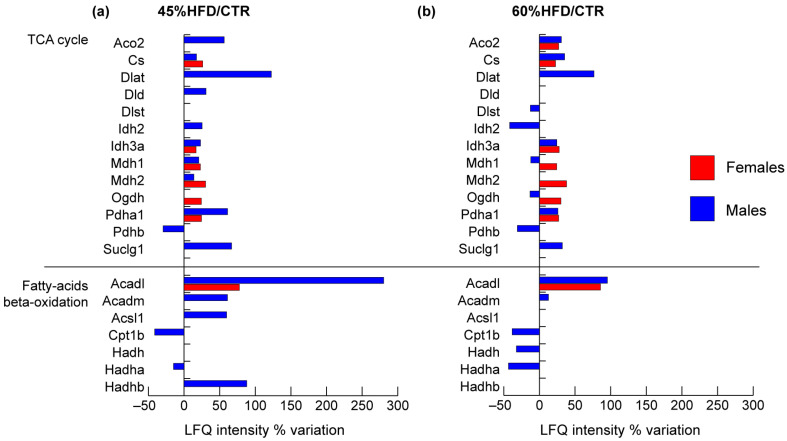
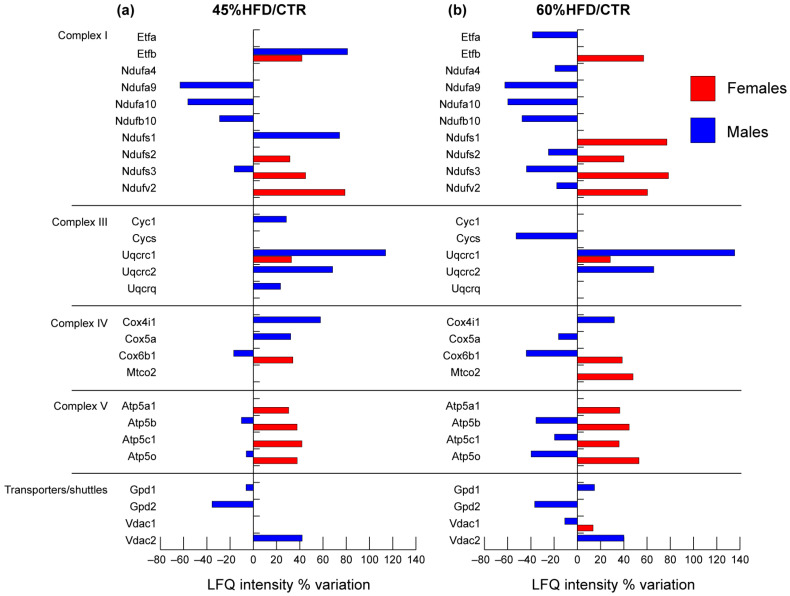
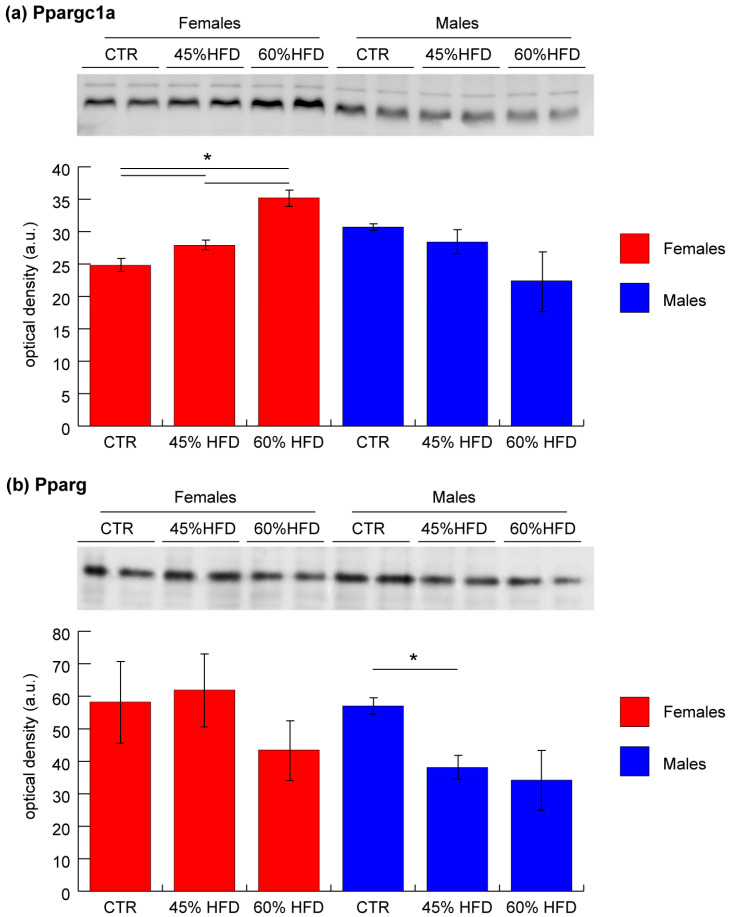
Obesity is a chronic, complex pathology associated with a risk of developing secondary pathologies, including cardiovascular diseases, cancer, type 2 diabetes (T2DM) and musculoskeletal disorders. Since skeletal muscle accounts for more than 70% of total glucose disposal, metabolic alterations are strictly associated with the onset of insulin resistance and T2DM. The present study relies on the proteomic analysis of gastrocnemius muscle from 15 male and 15 female C56BL/J mice fed for 14 weeks with standard, 45% or 60% high-fat diets (HFD) adopting a label-free LC-MS/MS approach followed by bioinformatic pathway analysis. Results indicate changes in males due to HFD, with increased muscular stiffness (Col1a1, Col1a2, Actb), fiber-type switch from slow/oxidative to fast/glycolytic (decreased Myh7, Myl2, Myl3 and increased Myh2, Mylpf, Mybpc2, Myl1), increased oxidative stress and mitochondrial dysfunction (decreased respiratory chain complex I and V and increased complex III subunits). At variance, females show few alterations and activation of compensatory mechanisms to counteract the increase of fatty acids. Bioinformatics analysis allows identifying upstream molecules involved in regulating pathways identified at variance in our analysis (Ppargc1a, Pparg, Cpt1b, Clpp, Tp53, Kdm5a, Hif1a). These findings underline the presence of a gender-specific response to be considered when approaching obesity and related comorbidities.

Keywords: insulin resistance; obesity; proteomics; sarcopenia; skeletal muscle.


Conflict of interest statement

The authors declare no conflicts of interest. The funders had no role in the design of the study; in the collection, analyses, or interpretation of data; in the writing of the manuscript, or in the decision to publish the results.

Figures

Figure 1
Figure 1
High-fat animal model characterization. (a) male (♂, left) and female (♀, right) mice body weight increase (* significant variation in 60% HFD vs. CTR, # significant variation in 45% HFD vs. CTR). Data were analyzed using two-way ANOVA for diet and time point as variables, followed by Tukey’s post hoc test for multiple comparisons (n = 4, p-value < 0.05). (b) Longitudinal glucose tolerance test in male and (c) female HFD mice at 4 and 7 weeks of diet (* significant variation in 60% HFD vs. CTR, # significant variation in 45% HFD vs. CTR). Data were analyzed using two-way ANOVA in which within each row, each column mean was compared, followed by Tukey’s post hoc test for multiple comparisons (n = 4, p-value < 0.05). (d) T2-MRI images of male (left) and female liver (liver) section per group of study (CTR, 45% HFD and 60% HFD) at 12 weeks of diet. Non-fat suppression images in which whiter liver reveals higher lipid content. (e) % Hepatic lipid content (% HLC) spectroscopy evaluation on male (left) and female (right) liver section at 4 and 12 weeks of diet (* significant variation p-value < 0.05, ** significant variation p-value < 0.01). (f) Fat volume longitudinal quantification in male (left) and female (right) mice at 4 and 12 weeks of diet. Data were analyzed using two-way ANOVA for diet and time point as variables, followed by Tukey’s post hoc test for multiple comparisons. All data were expressed as mean ± SD (* significant variation p-value < 0.05, ** significant variation p-value < 0.01). (g) T2-MRI representation of male (left) and female (right) intra-abdominal fat accumulation per group of diet (CTR, 45% HFD and 60% HFD) at 12 weeks of diet; red arrows indicate fat tissue accumulation.
Figure 2
Figure 2
Label-free LC–ESI–MS/MS experimental design and main results. Protein extracts from 15 male and 15 female mice fed for 14 weeks with a standard diet (10 kcal% fat content; CTR) and two high-fat diets (HFD) regimens (45 kcal% and 60 kcal% fat content diets; 45% HFD and 60% HFD, respectively). For both genders, 5 samples for each condition were collected and analyzed in duplicate using label-free LC–ESI–MS/MS protocol. Three different comparisons were performed: 45% HFD vs. CTR, 60% HFD vs. CTR and 45% HFD vs. 60% HFD. The ANOVA test (n = 10, p-value > 0.05) showed 160 and 46 proteins differentially regulated in males and females, respectively. Of them, 38 proteins were in common between males and females. Specifically, comparing 45% HFD vs. CTR, 117 and 33 differentially abundant proteins were found, in males and females, respectively (Tukey’s multiple comparison test, p-value < 0.05). In contrast, the same analysis highlighted 131 and 41 differentially abundant proteins in 60% HFD vs. CTR males and females, and 119 and 9 differentially abundant proteins in 45% HFD vs. 60% HFD males and females, as detailed in Supplementary Tables S1 and S2.
Figure 3
Figure 3
Proteomic analysis of structural proteins. Histograms of differentially expressed proteins (Label-free quantification, LFQ, intensity% variation, ANOVA and Tukey’s test, n = 10, p-value < 0.05) in (a) 45% HFD vs. standard diet (CTR) female (red bars) and male (blue bars) mice; (b) 60% HFD vs. CTR female and male mice.
Figure 4
Figure 4
Proteomic analysis of contractile proteins. Histograms of differentially expressed proteins (LFQ intensity% variation, ANOVA and Tukey’s test, n = 10, p-value < 0.05) in (a) 45% HFD vs. standard diet (CTR) female (red bars) and male (blue bars) mice; (b) 60% HFD vs. CTR female and male mice.
Figure 5
Figure 5
Proteomic analysis of glucose/glycogen metabolism proteins. Histograms of differentially expressed proteins (LFQ intensity% variation, ANOVA and Tukey’s test, n = 10, p-value < 0.05) in (a) 45% HFD vs. standard diet (CTR) female (red bars) and male (blue bars) mice; (b) 60% HFD vs. CTR female and male mice.
Figure 6
Figure 6
Proteomic analysis of TCA cycle and fatty acids metabolism proteins. Histograms of differentially expressed proteins (LFQ intensity% variation, ANOVA and Tukey’s test, n = 10, p-value < 0.05) in (a) 45% HFD vs. standard diet (CTR) female (red bars) and male (blue bars) mice; (b) 60% HFD vs. CTR female and male mice.
Figure 7
Figure 7
Proteomic analysis of mitochondrial respiratory chain proteins. Histograms of differentially expressed proteins (LFQ intensity% variation, ANOVA and Tukey’s test, n = 10, p-value < 0.05) in (a) 45% HFD vs. standard diet (CTR) female (red bars) and male (blue bars) mice; (b) 60% HFD vs. CTR female and male mice.
Figure 8
Figure 8
Representative histograms and immunoblot images of (a) peroxisome proliferator-activated receptor gamma coactivator 1-alpha (Ppargc1a) and (b) peroxisome proliferator-activated receptor gamma (Pparg) expression in gastrocnemius muscle (mean ± SD; * = significant difference, ANOVA and Tukey’s test, n = 2, p-value < 0.05) of CTR, 45% HFD and 60% HFD female (red) and male (blue) mice. Full-length images are available in Supplementary Figure S1.

References

    1. OECD Obesity Update 2017. [(accessed on 15 December 2020)]; Available online: http://www.oecd.org/health/obesity-update.htm.
    1. Bluher M. Obesity: Global epidemiology and pathogenesis. Nat. Rev. Endocrinol. 2019;15:288–298. doi: 10.1038/s41574-019-0176-8. - DOI - PubMed
    1. Goossens G.H. The role of adipose tissue dysfunction in the pathogenesis of obesity-related insulin resistance. Physiol. Behav. 2008;94:206–218. doi: 10.1016/j.physbeh.2007.10.010. - DOI - PubMed
    1. Fruh S.M. Obesity: Risk factors, complications, and strategies for sustainable long-term weight management. J. Am. Assoc. Nurse Pract. 2017;29:S3–S14. doi: 10.1002/2327-6924.12510. - DOI - PMC - PubMed
    1. Abate M. How obesity modifies tendons (implications for athletic activities) Muscles Ligaments Tendons J. 2014;4:298–302. doi: 10.32098/mltj.03.2014.06. - DOI - PMC - PubMed

MeSH terms