. 2021 Apr 27;10(5):878.
doi: 10.3390/plants10050878.

Influence of Local Burning on Difference Reflectance Indices Based on 400-700 nm Wavelengths in Leaves of Pea Seedlings

Affiliations

Influence of Local Burning on Difference Reflectance Indices Based on 400-700 nm Wavelengths in Leaves of Pea Seedlings

Ekaterina Sukhova et al. Plants (Basel). .

Abstract

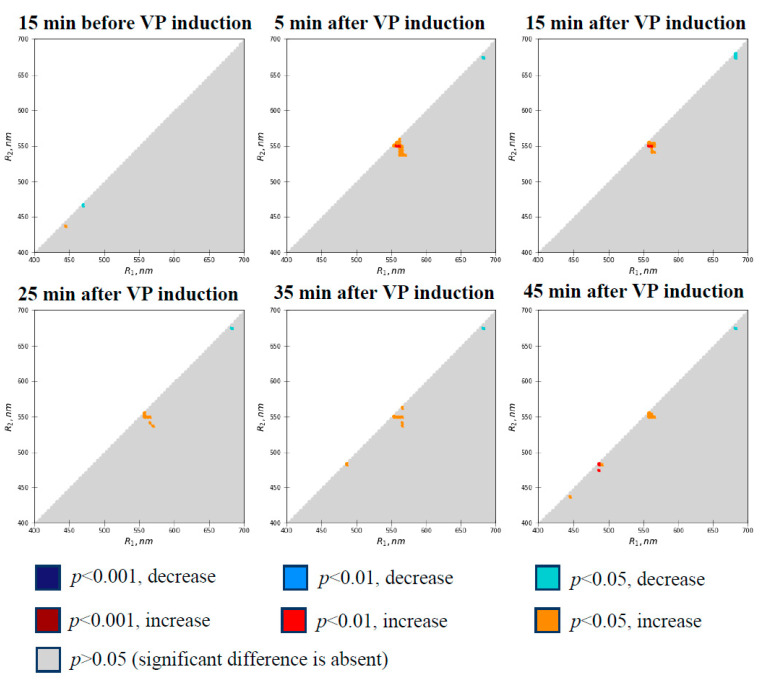
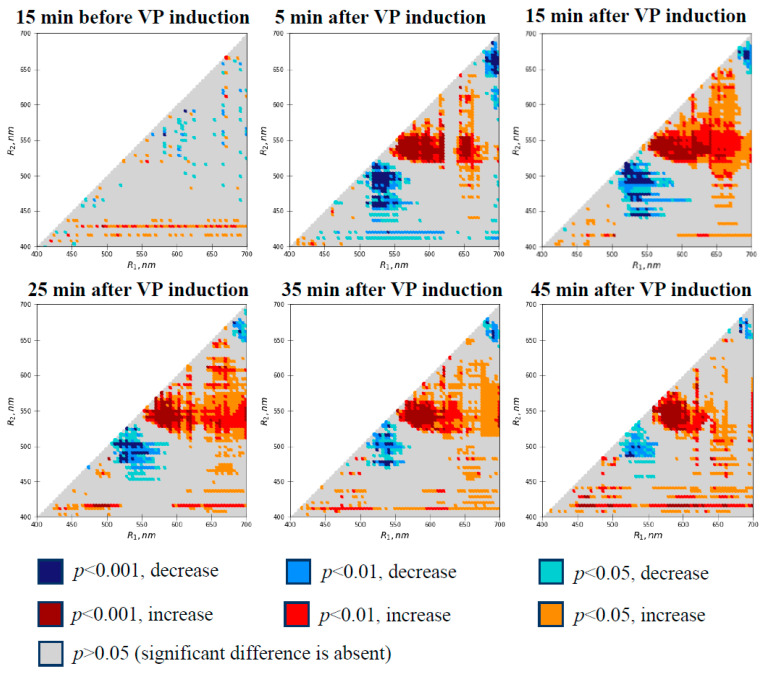
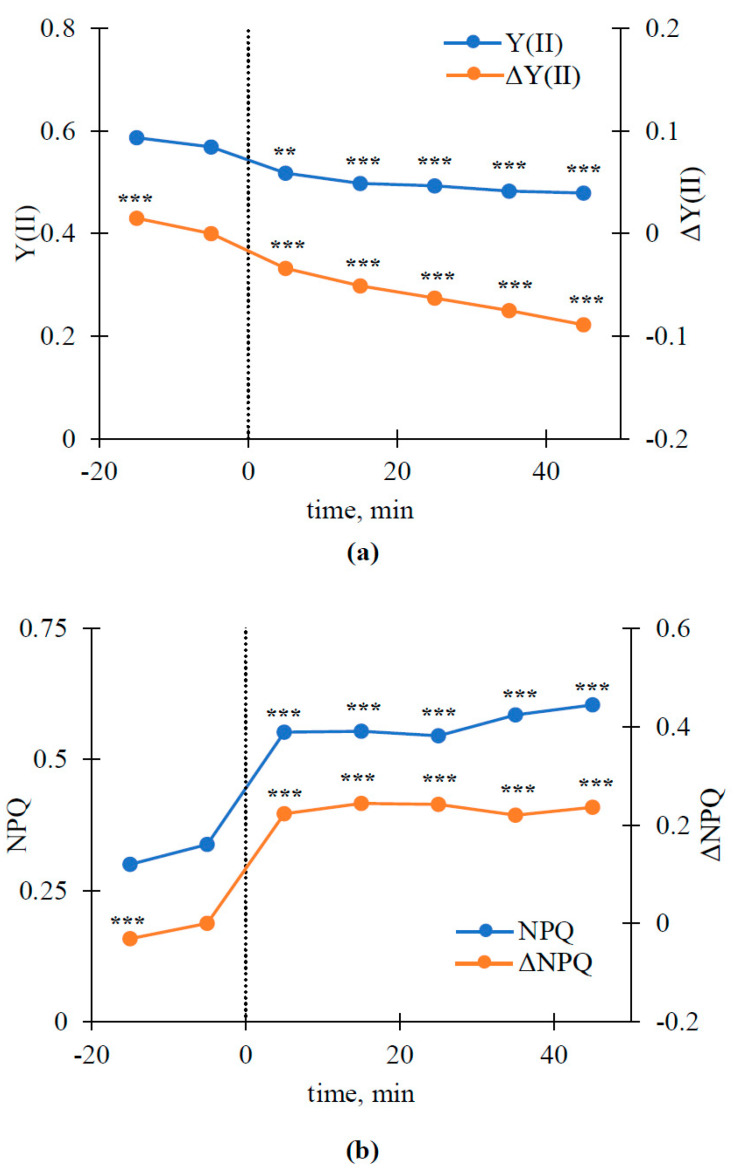
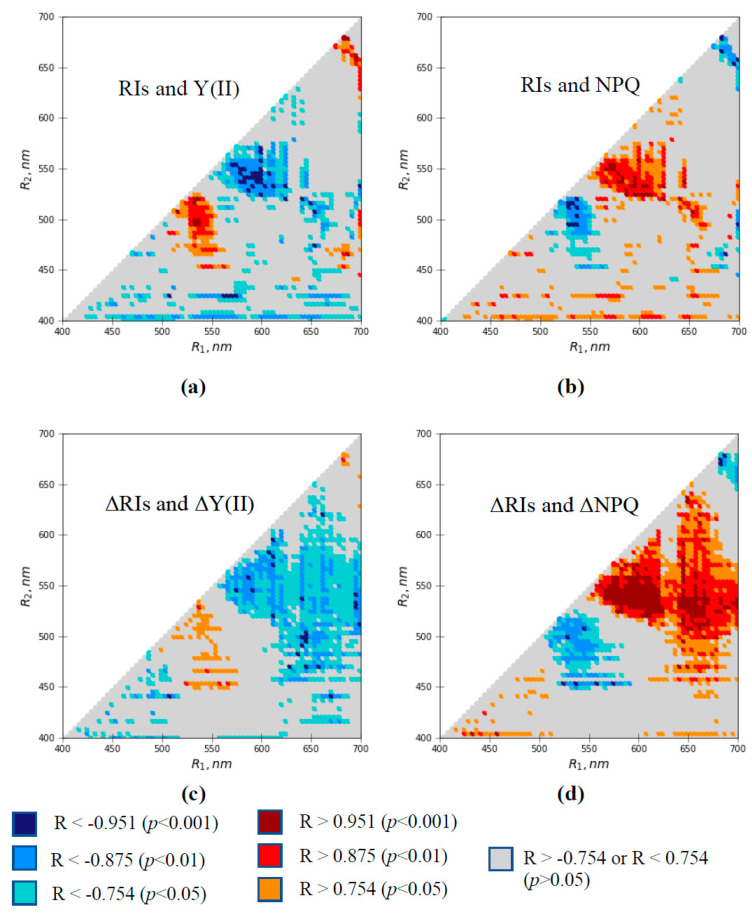
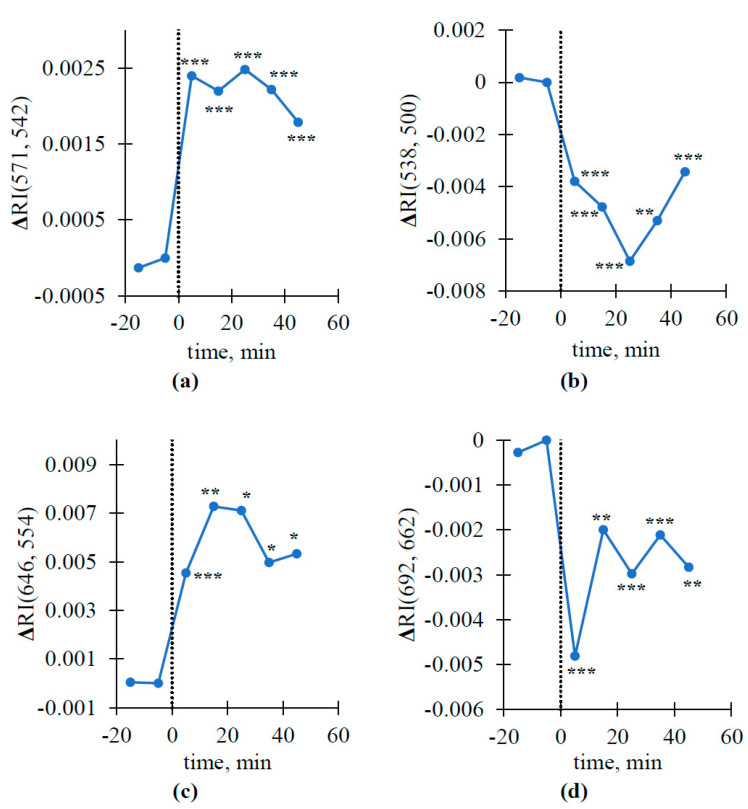
Local damage (e.g., burning) induces a variation potential (VP), which is an important electrical signal in higher plants. A VP propagates into undamaged parts of the plant and influences numerous physiological processes, including photosynthesis. Rapidly increasing plant tolerance to stressors is likely to be a result of the physiological changes. Thus, developing methods of revealing VP-induced physiological changes can be used for the remote sensing of plant systemic responses to local damage. Previously, we showed that burning-induced VP influenced a photochemical reflectance index in pea leaves, but the influence of the electrical signals on other reflectance indices was not investigated. In this study, we performed a complex analysis of the influence of VP induction by local burning on difference reflectance indices based on 400-700 nm wavelengths in leaves of pea seedlings. Heat maps of the significance of local burning-induced changes in the reflectance indices and their correlations with photosynthetic parameters were constructed. Large spectral regions with significant changes in these indices after VP induction were revealed. Most changes were strongly correlated to photosynthetic parameters. Some indices, which can be potentially effective for revealing local burning-induced photosynthetic changes, are separately shown. Our results show that difference reflectance indices based on 400-700 nm wavelengths can potentially be used for the remote sensing of plant systemic responses induced by local damages and subsequent propagation of VPs.

Keywords: pea leaves; photosynthetic response; reflectance indices; remote sensing; variation potential.


Conflict of interest statement

The authors declare no conflict of interests. The funders had no role in the design of the study; in the collection, analyses, or interpretation of data; in the writing of the manuscript, or in the decision to publish the results.

Figures

Figure 1
Figure 1
General scheme of analysis of spectra of the reflected light and photosynthetic parameters (the quantum yield of photosystem II, Y(II), and non-photochemical quenching of chlorophyll fluorescence, NPQ) measured in the second pea leaf before and after induction of variation potential (VP) by local burning of the first leaf.
Figure 2
Figure 2
Heat maps of significance and directions of changes in absolute values of RIs in the second pea leaf at different time intervals before and after induction of variation potential (n = 13). RIs were calculated based on Equation (1). Burning of the first leaf was used for VP induction. The Mann–Whitney U test was used for p-value calculations. The absolute values of RIs were compared to the values of RIs at 5 min before VP induction.
Figure 3
Figure 3
Heat maps of significance and directions of changes in ΔRIs in the second pea leaf at different time intervals before and after induction of variation potential (n = 13). RIs were calculated based on Equation (1). Burning of the first leaf was used for VP induction. Each ΔRI was calculated as RITP–RIC. RIC is the control RI at 5 min before the VP induction. RITP is the difference in the reflectance index at a specific time point before or after VP induction. The Mann–Whitney U test was used for p-value calculations. The ΔRIs were compared to zero values (absence of changes). Using ΔRIs minimized the influence of individual plant differences on the local burning-induced changes in RIs.
Figure 4
Figure 4
Dynamics of Y(II) and ΔY(II) (a) and NPQ and ΔNPQ (b) before and after induction of variation potential in the second leaf (n = 13). Burning the first leaf was used for VP induction (the burning is marked by the time point zero and dotted line). ΔY(II) and ΔNPQ were calculated as Y(II)TP-Y(II)C and NPQTP-NPQC, respectively. Y(II)C is the control Y(II) at 5 min before VP induction. Y(II)TP is Y(II) at a specific time point before or after VP induction. NPQC is the control NPQ at 5 min before VP induction. NPQTP is NPQ at a specific time point before or after VP induction. The Mann–Whitney U test was used for p-value calculations. Y(II) and NPQ were compared to control values. ΔY(II) and ΔNPQ were compared to zero values (absence of changes). Using ΔY(II) and ΔNPQ minimized the influence of individual plant differences on local burning-induced changes in the parameters. **, p < 0.01 and ***, p < 0.001.
Figure 5
Figure 5
Heat maps of linear correlation coefficients (R) between RIs and Y(II) (a), RIs and NPQ (b), ΔRIs and ΔY(II) (c), and ΔRIs and ΔY(II) (d). Pearson’s correlation coefficients were calculated based on medians of investigated parameters. The medians were calculated for each time point (n = 7). Only significant correlation coefficients are shown in the figure.
Figure 6
Figure 6
Dynamics of ΔRI(571, 542) (a), ΔRI(538, 500) (b), ΔRI(646, 554) (c), and ΔRI(692, 662) (d) before and after induction of variation potential in the second leaf (n = 13). Burning of the first leaf was used for VP induction (the burning is marked by the time point zero and the dotted line). The Mann–Whitney U test was used for p-value calculations; parameters were compared to zero values (absence of changes). *, p < 0.05, **, p < 0.01, and ***, p < 0.001.

References

    1. Trebacz K., Dziubinska H., Krol E. Electrical signals in long-distance communication in plants. In: Baluška F., Mancuso S., Volkmann D., editors. Communication in Plants. Neuronal Aspects of Plant Life. Springer; Berlin/Heidelberg, Germany: New York, NY, USA: 2006. pp. 277–290.
    1. Fromm J., Lautner S. Electrical signals and their physiological significance in plants. Plant Cell Environ. 2007;30:249–257. doi: 10.1111/j.1365-3040.2006.01614.x. - DOI - PubMed
    1. Gallé A., Lautner S., Flexas J., Fromm J. Environmental stimuli and physiological responses: The current view on electrical signaling. Environ. Exp. Bot. 2015;114:15–21. doi: 10.1016/j.envexpbot.2014.06.013. - DOI
    1. Vodeneev V., Akinchits E., Sukhov V. Variation potential in higher plants: Mechanisms of generation and propagation. Plant Signal. Behav. 2015;10:e1057365. doi: 10.1080/15592324.2015.1057365. - DOI - PMC - PubMed
    1. Sukhov V. Electrical signals as mechanism of photosynthesis regulation in plants. Photosynth. Res. 2016;130:373–387. doi: 10.1007/s11120-016-0270-x. - DOI - PubMed

LinkOut - more resources