. 2021 Apr 27;10(5):681.
doi: 10.3390/antiox10050681.

Tissue Antioxidant Status and Lipid Peroxidation Are Related to Dietary Intake of n-3 Polyunsaturated Acids: A Rabbit Model

Affiliations

Tissue Antioxidant Status and Lipid Peroxidation Are Related to Dietary Intake of n-3 Polyunsaturated Acids: A Rabbit Model

Simona Mattioli et al. Antioxidants (Basel). .

Abstract

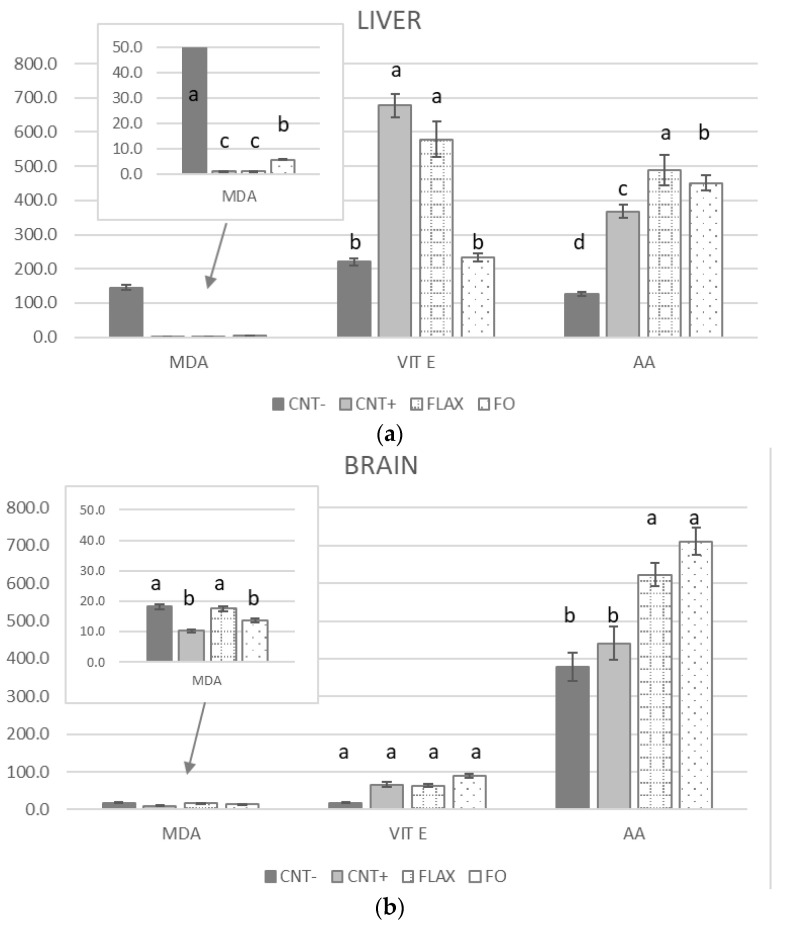
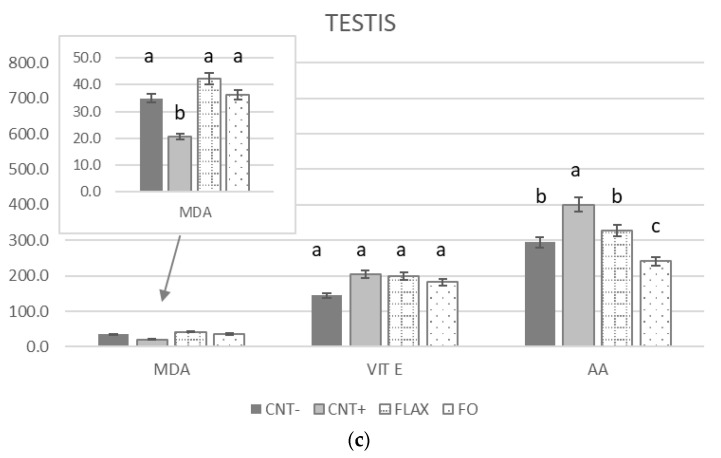
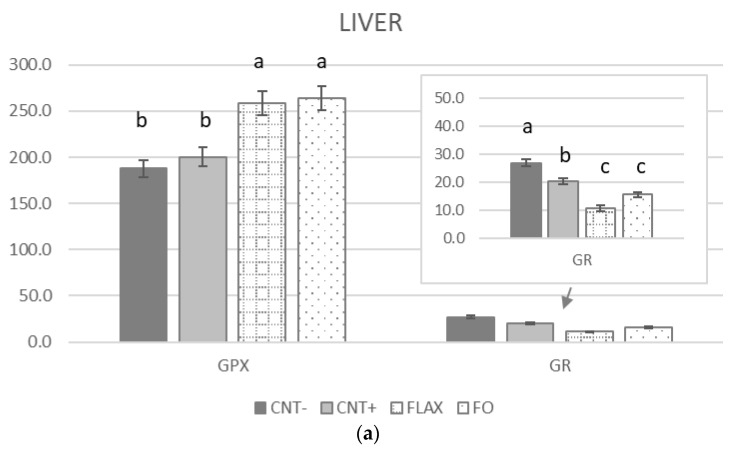
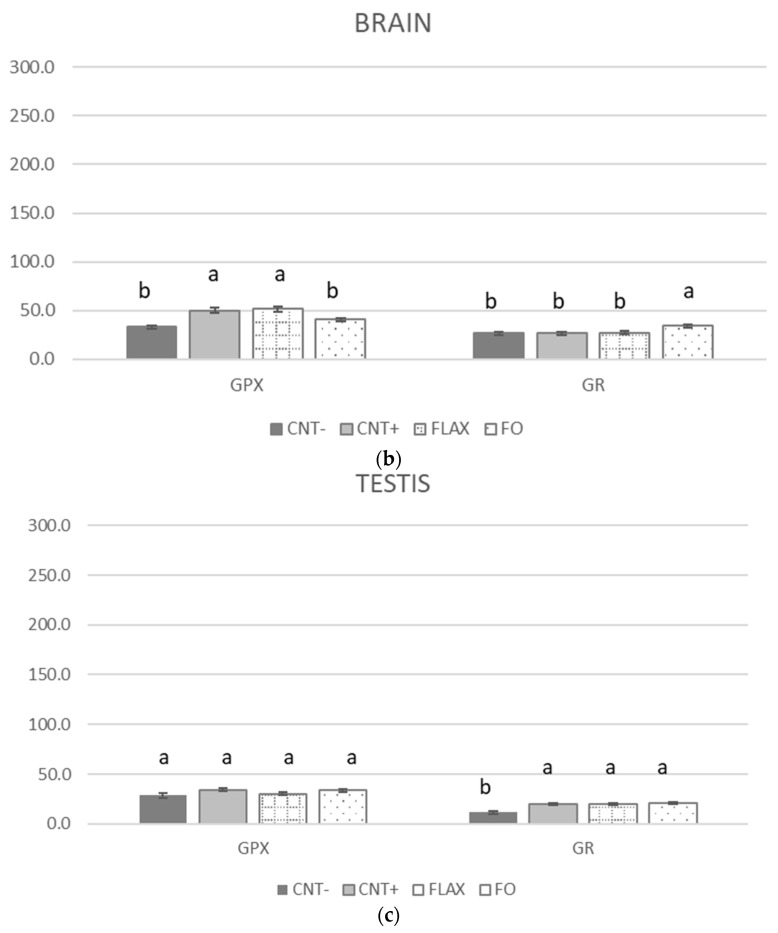
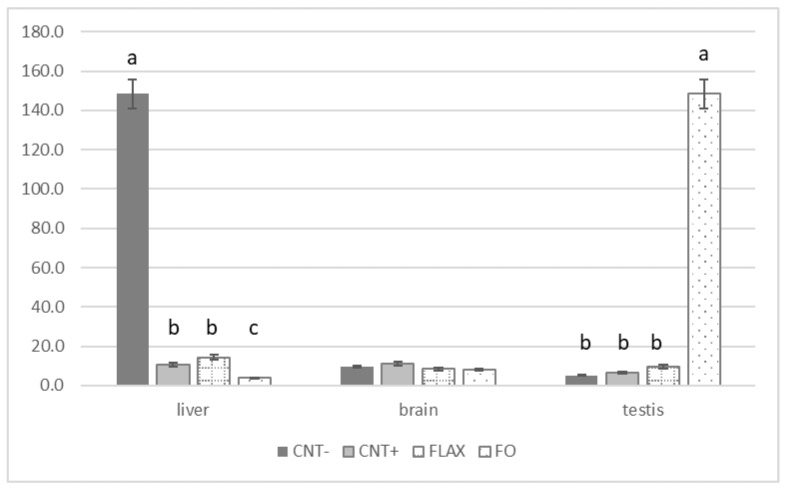
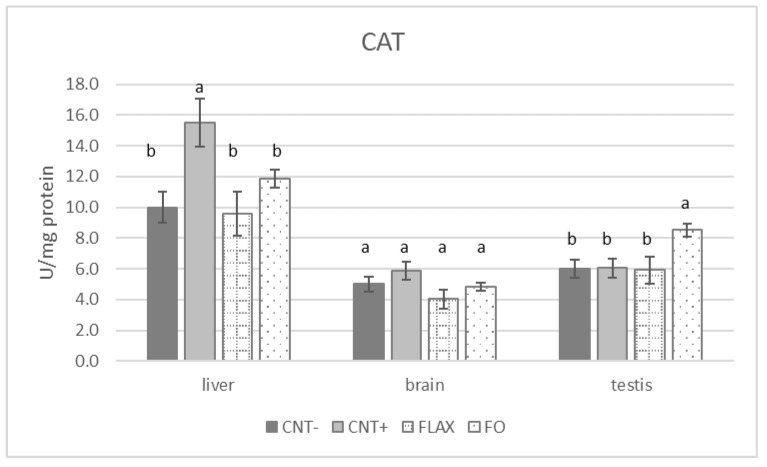
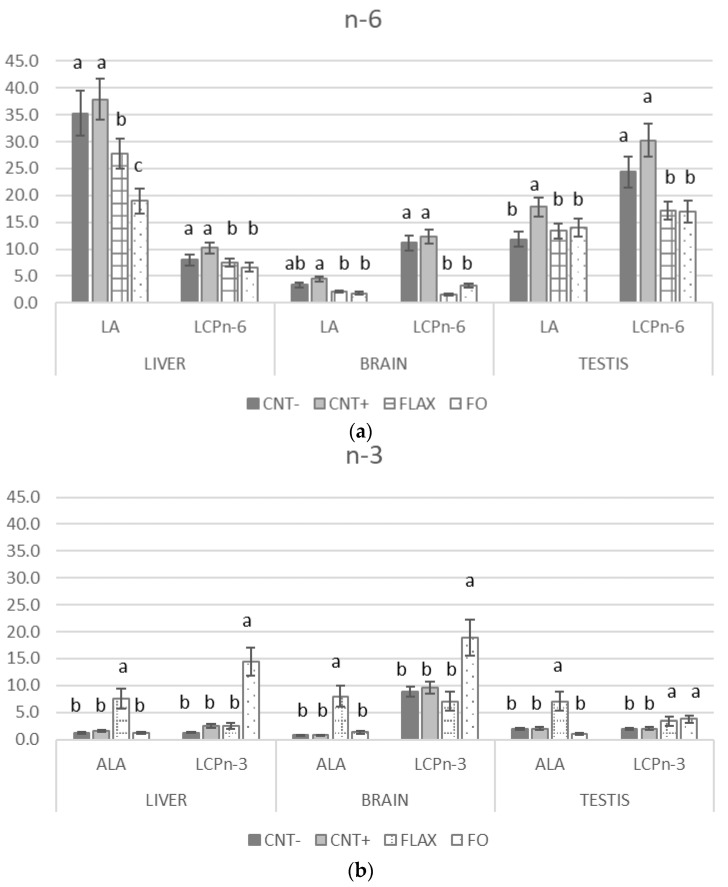
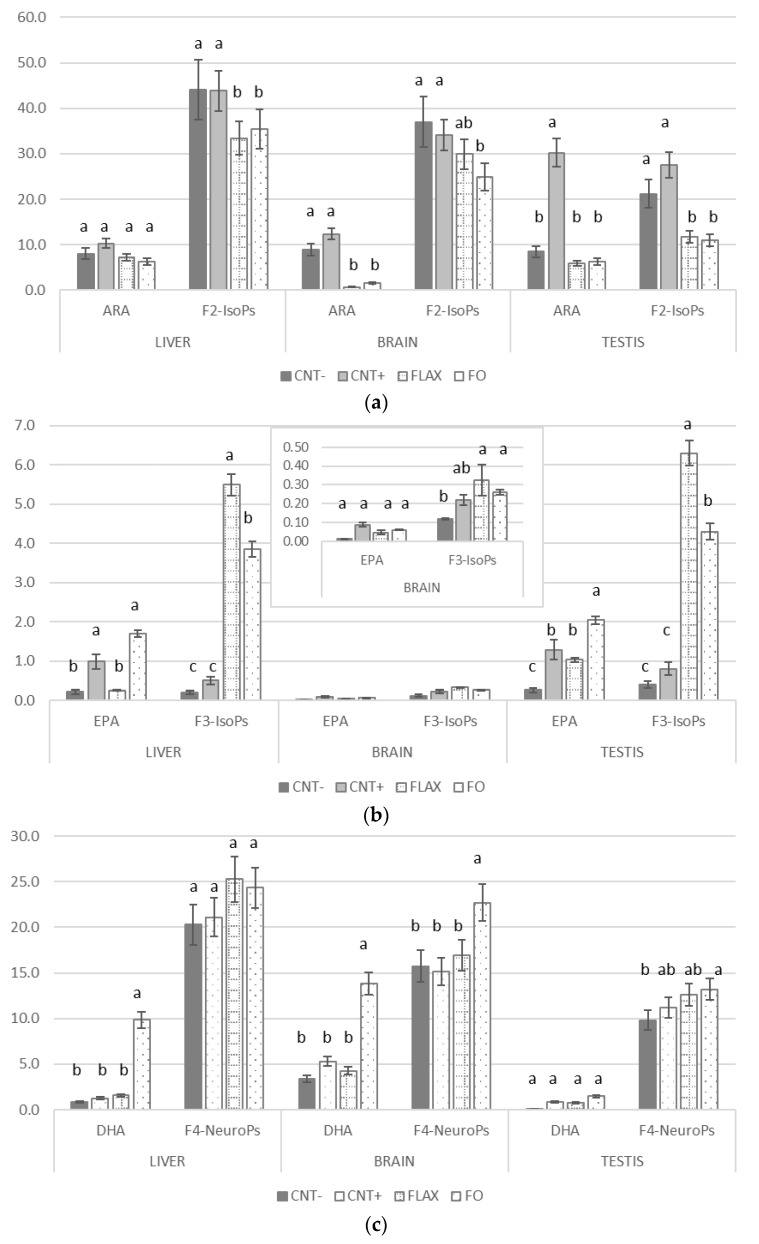
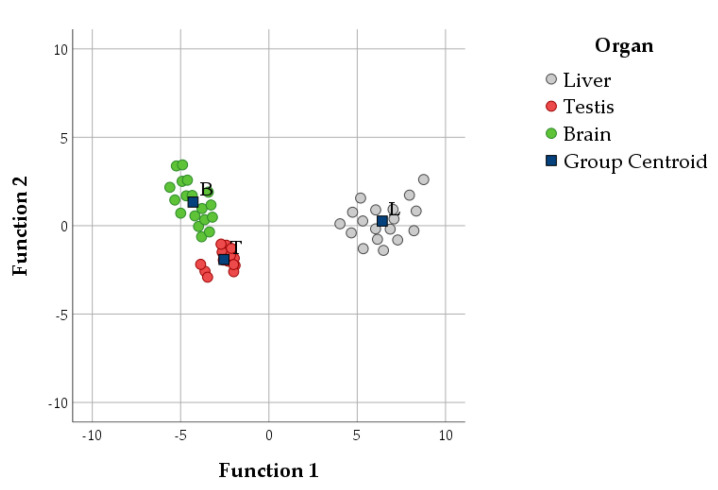
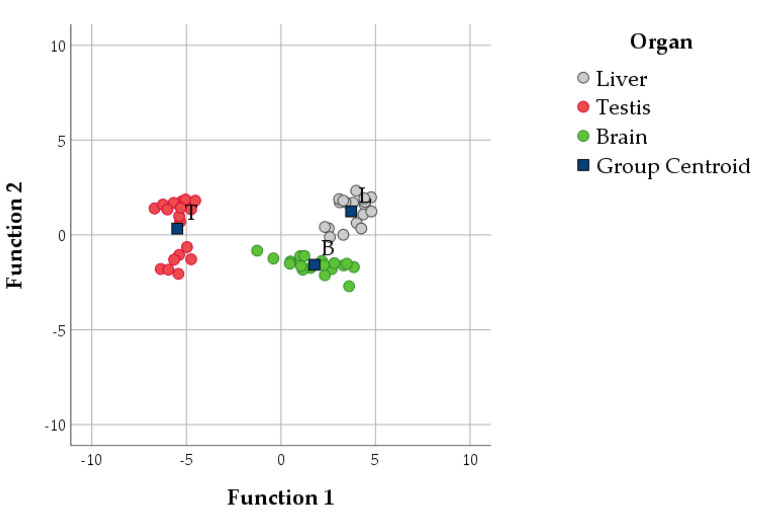
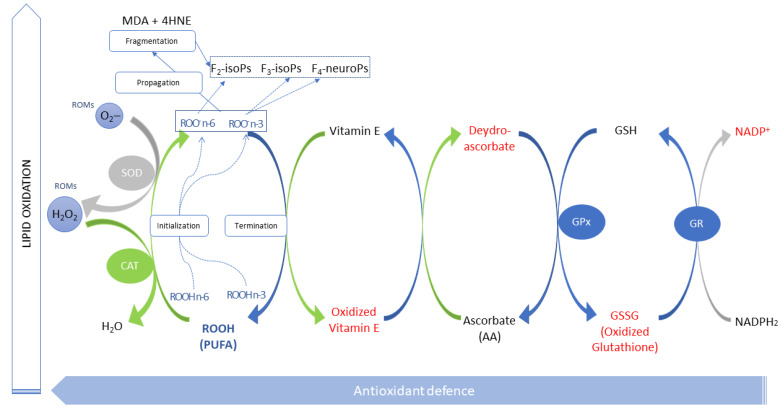
Polyunsaturated fatty acid (PUFA) metabolism and tissue distribution is modulated by the oxidation of these molecules. This research aimed to investigate the implication of dietary n-3 PUFA supplementation (precursor and long-chain PUFA) on the PUFA profile and oxidative status of the liver, testis, and brain of adult rabbit bucks. Twenty New Zealand White rabbit bucks were divided into four experimental groups (n = 5 per group) and were fed different diets for 110 days: control (CNT), standard diet containing 50 mg/kg alpha-tocopheryl acetate (vitamin E); CNT+, standard diet + 200 mg/kg vitamin E; FLAX, standard diet + 10% flaxseed + 200 mg/kg vitamin E; or FISH, standard diet + 3.5% fish oil + 200 mg/kg vitamin E. Antioxidants (enzymatic and non-enzymatic), oxidative status (malondialdehyde and isoprostanoids), and n-3 and n-6 PUFAs of tissues were analysed. A chain mechanism of oxidant/antioxidant molecules, which largely depended on the particular PUFA composition, was delineated in the different organs. The liver showed an oxidant/antioxidant profile and lipid pathways widely modulated by PUFA and vitamin E administration; on the other hand, the testis' oxidative profile rather than its lipid profile seemed to be particularly affected, an outcome opposite to that of the brain (modulation operated by dietary PUFA).

Keywords: brain; cellular antioxidants; isoprostanoids; liver; polyunsaturated fatty acids; rabbit; testis; vitamin E.


Conflict of interest statement

The authors declare no conflict of interest.

Figures

Figure 1
Figure 1
The effect of experimental diets on the oxidative status (malondialdehyde (MDA), nmol/g) and non-enzymatic antioxidant (vitamin E, ng/g, and ascorbic acid (AA), nmol/g) content of rabbit (a) liver, (b) brain, and (c) testis. When values differences were too wide to show a complete graph, a support window was added to the main one. The bars represent least squares means + 95% upper and lower limits. The letters a–c indicate a significant difference between dietary groups (p < 0.05, Bonferroni post hoc test).
Figure 1
Figure 1
The effect of experimental diets on the oxidative status (malondialdehyde (MDA), nmol/g) and non-enzymatic antioxidant (vitamin E, ng/g, and ascorbic acid (AA), nmol/g) content of rabbit (a) liver, (b) brain, and (c) testis. When values differences were too wide to show a complete graph, a support window was added to the main one. The bars represent least squares means + 95% upper and lower limits. The letters a–c indicate a significant difference between dietary groups (p < 0.05, Bonferroni post hoc test).
Figure 2
Figure 2
The effect of experimental diets on glutathione peroxidase (GPX) and glutathione reductase (GR) activites (U/mg protein) in rabbit (a) liver, (b) brain, and (c) testis. When values differences were too wide to show a complete graph, a support window was added to the main one. The bars represent least squares means + 95% upper and lower limits. The letters a–c indicate a significant difference between dietary groups (p < 0.05, Bonferroni post hoc test).
Figure 2
Figure 2
The effect of experimental diets on glutathione peroxidase (GPX) and glutathione reductase (GR) activites (U/mg protein) in rabbit (a) liver, (b) brain, and (c) testis. When values differences were too wide to show a complete graph, a support window was added to the main one. The bars represent least squares means + 95% upper and lower limits. The letters a–c indicate a significant difference between dietary groups (p < 0.05, Bonferroni post hoc test).
Figure 3
Figure 3
The effect of experimental diets on the gluthatione reduced (GSH) and oxidised (GSSG) ratio, both expressed as nmol/mg protein—in rabbit liver, brain, and testis. The bars represent least squares means + 95% upper and lower limits. The letters a–c indicate a significant difference between dietary groups (p < 0.05, Bonferroni post hoc test).
Figure 4
Figure 4
The effect of experimental diets on catalase (CAT) activity in rabbit liver, brain, and testis. The bars represent least squares means + 95% upper and lower limits. a, b indicate a significant difference between dietary groups (p < 0.05, Bonferroni post hoc test).
Figure 5
Figure 5
The effect of experimental diets on the long-chain fatty acid (LCP) content of rabbit liver, brain, and testis (presented as % of total fatty acids (FAs)) for the (a) n-6 and (b) n-3 polyunsaturated fatty acid (PUFA) series. The bars represent least squares means + 95% upper and lower limits. a, b indicate a significant difference between dietary groups (p < 0.05, Bonferroni post hoc test).
Figure 6
Figure 6
The effect of experimental diets on fatty acid (FA) precursors (arachidonic acid [ARA], eicosapentaenoic acid [EPA], docosahexaenoic acid [DHA]; % of total FA) of isoprostanoids (IsoPs, pg/mL) in rabbit liver, brain, and testis for (a) F2-IsoPs, (b) F3-isoPs, and (c) F4-NeuroPs. When values differences were too wide for showing a complete graph, a support window was added to the main one. The bars represent least squares means + 95% upper and lower limits. a–c indicate a significant difference between dietary groups (p < 0.05, Bonferroni post-hoc test).
Figure 7
Figure 7
Scatterplot of canonical discrimination analysis (DA) including variables indicating antioxidant features (DA1) with the centroids of each organ (blue squares). L, liver; T, testis; B, brain.
Figure 8
Figure 8
Scatterplot of canonical discrimination analysis (DA) including variables indicating the lipid and isoprostanoid profile (DA2) with the centroids of each organ (blue squares). L, liver; T, testis; B, brain.
Figure 9
Figure 9
The main steps of the polyunsaturated fatty acid (PUFA) oxidative chain and antioxidant interactions. The red colour indicates oxidised molecules. MDA, malondialdehyde; 4HNE, 4-hydroxynonenal; GSH, glutathione; GPX, glutathione peroxidase, GR, glutathione reductase; F2-, 3-isoPs, F2-, 3-isoprostanes; F4-NeuroPs, F4-neuroprostanes; SOD: superoxide dismutase; CAT: catalase: ROMs: reactive oxygen metabolites.

References

    1. Rodríguez M., Rebollar P.G., Mattioli S., Castellini C. n-3 PUFA Sources (Precursor/Products): A Review of Current Knowledge on Rabbit. Animals. 2019;9:806. doi: 10.3390/ani9100806. - DOI - PMC - PubMed
    1. Rambjør G.S., Windsor S.L., Harris W.S. Eicosapentaenoic acid is primarily responsible for hypotriglyceridemic effect of fish oil in humans. Lipids. 1996;31:S45–S49. doi: 10.1007/BF02637050. - DOI - PubMed
    1. Willett W.C. Dietary fats and coronary heart disease. J. Intern. Med. 2012;272:13–24. doi: 10.1111/j.1365-2796.2012.02553.x. - DOI - PubMed
    1. Leaf A. The electrophysiologic basis for the antiarrhythmic and anticonvulsant effects of n-3 polyunsaturated fatty acids: Heart and brain. Lipids. 2001;36:S107–S110. doi: 10.1007/s11745-001-0691-y. - DOI - PubMed
    1. Hwang D. Fatty acids and immune responses—A new perspective in searching for clues to mechanism. Annu. Rev. Nutr. 2000;20:431–456. doi: 10.1146/annurev.nutr.20.1.431. - DOI - PubMed

LinkOut - more resources