. 2021 Apr 27;22(9):4573.
doi: 10.3390/ijms22094573.

Application of Nitrate, Ammonium, or Urea Changes the Concentrations of Ureides, Urea, Amino Acids and Other Metabolites in Xylem Sap and in the Organs of Soybean Plants (Glycine max (L.) Merr.)

Affiliations

Application of Nitrate, Ammonium, or Urea Changes the Concentrations of Ureides, Urea, Amino Acids and Other Metabolites in Xylem Sap and in the Organs of Soybean Plants (Glycine max (L.) Merr.)

Yuki Ono et al. Int J Mol Sci. .

Abstract

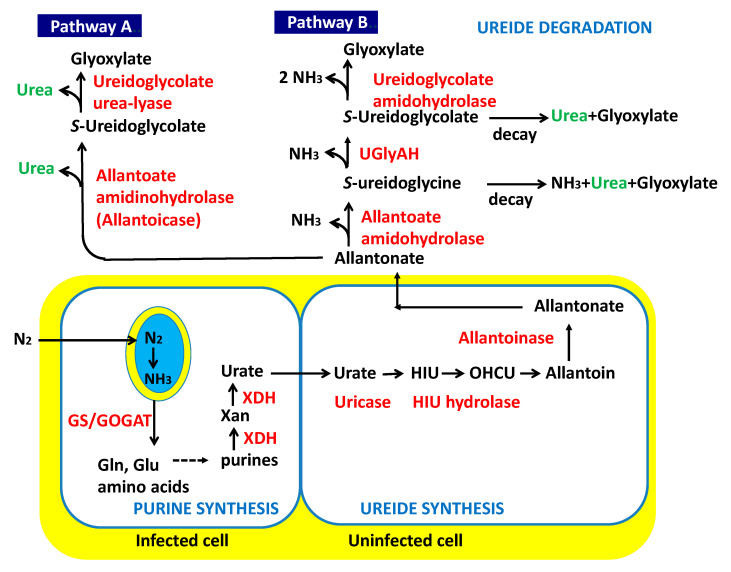
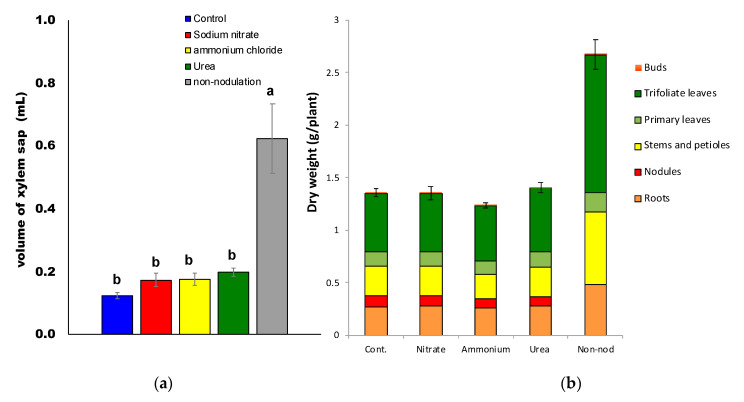
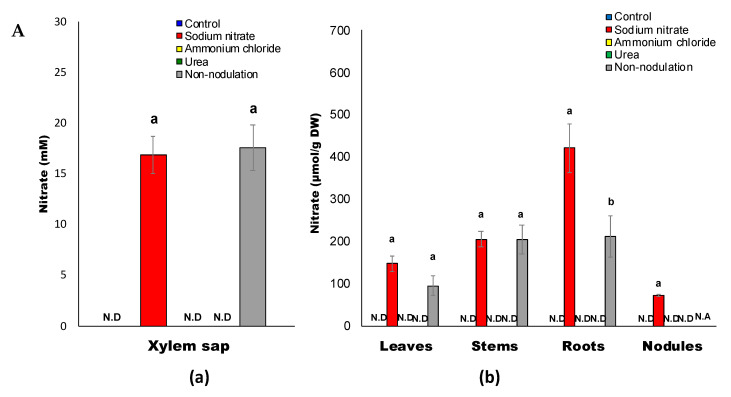
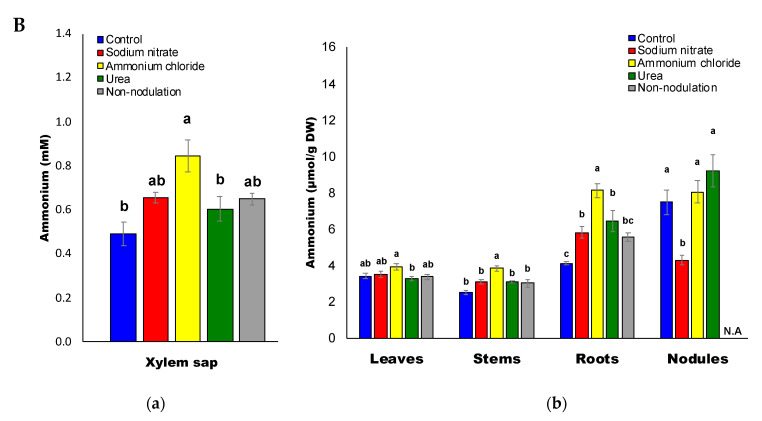
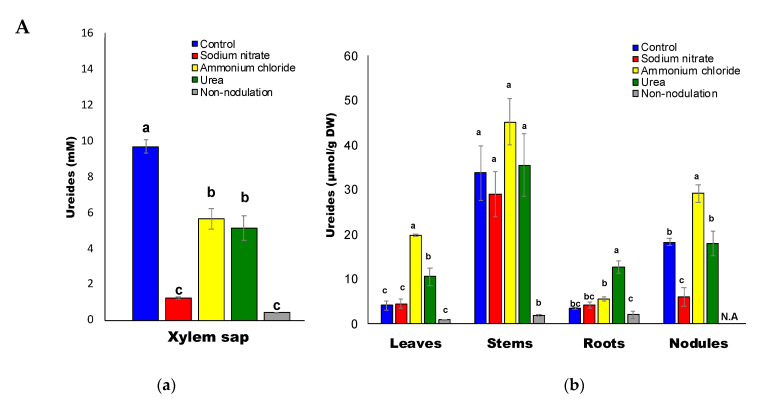
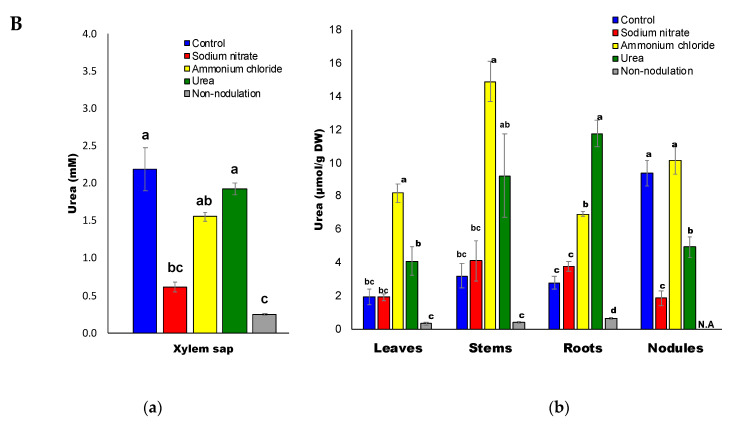
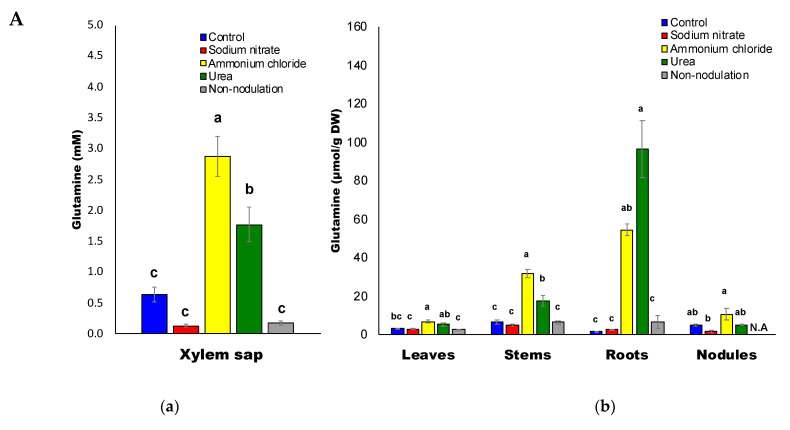
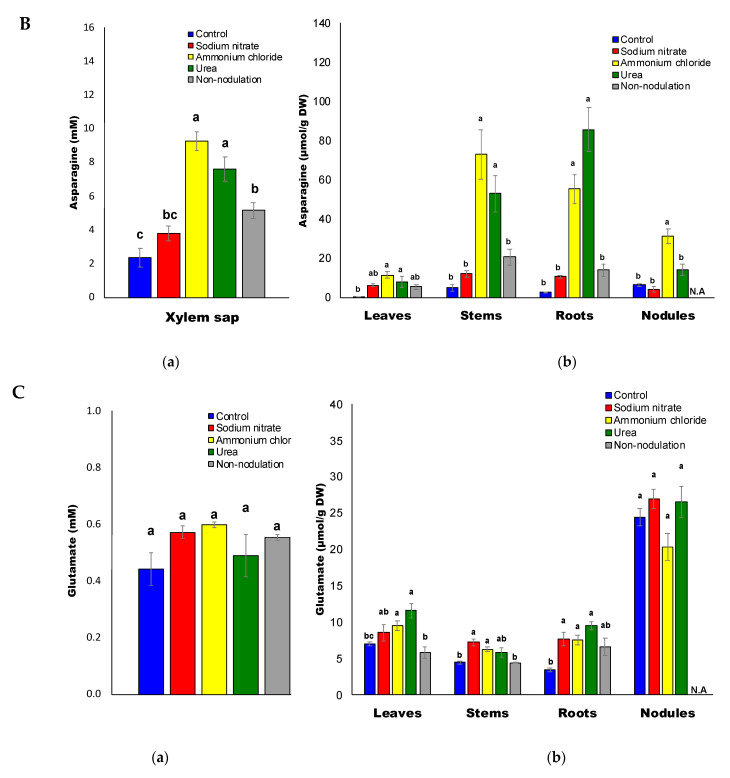
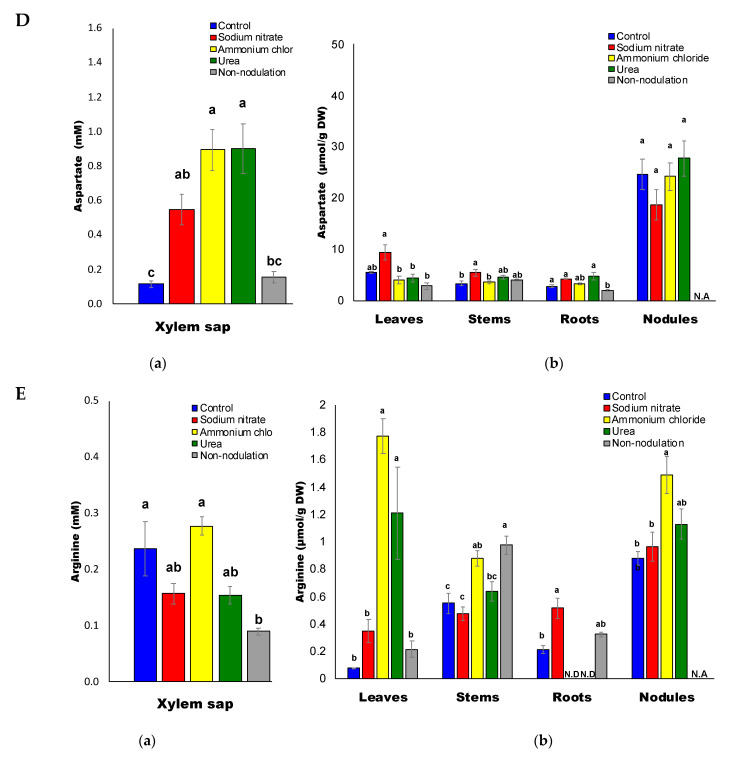
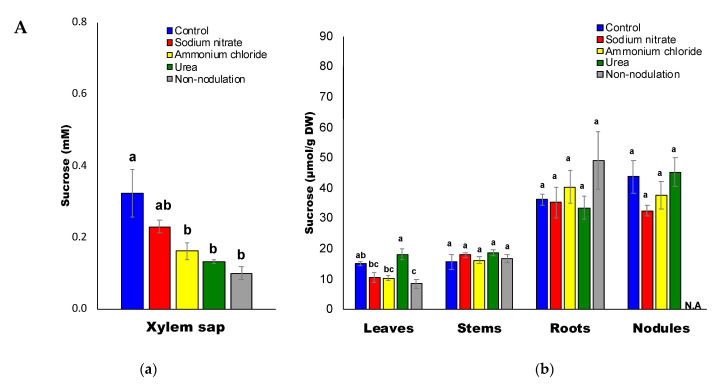
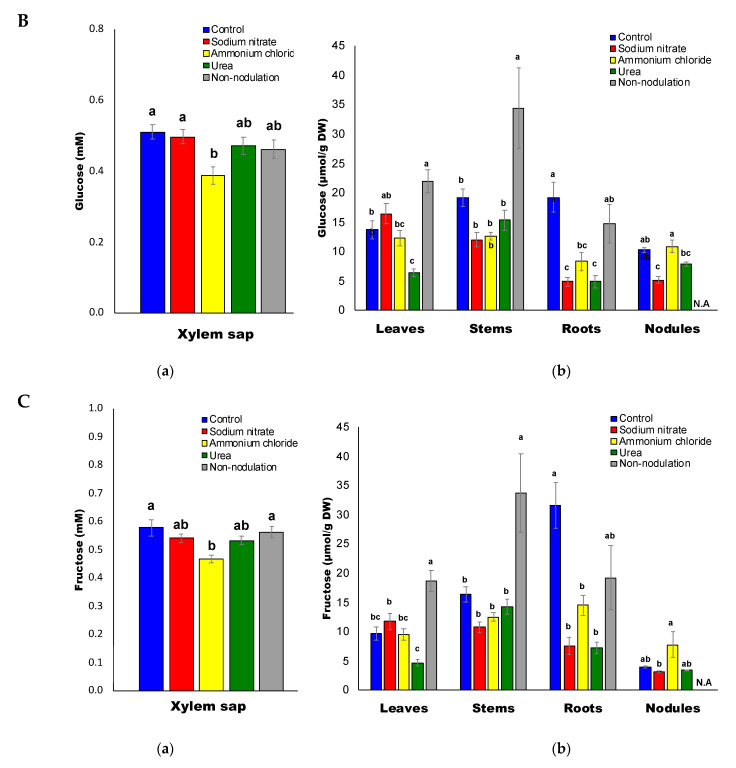
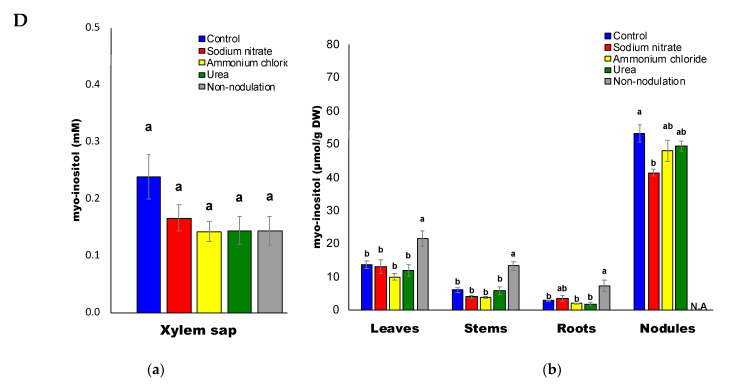
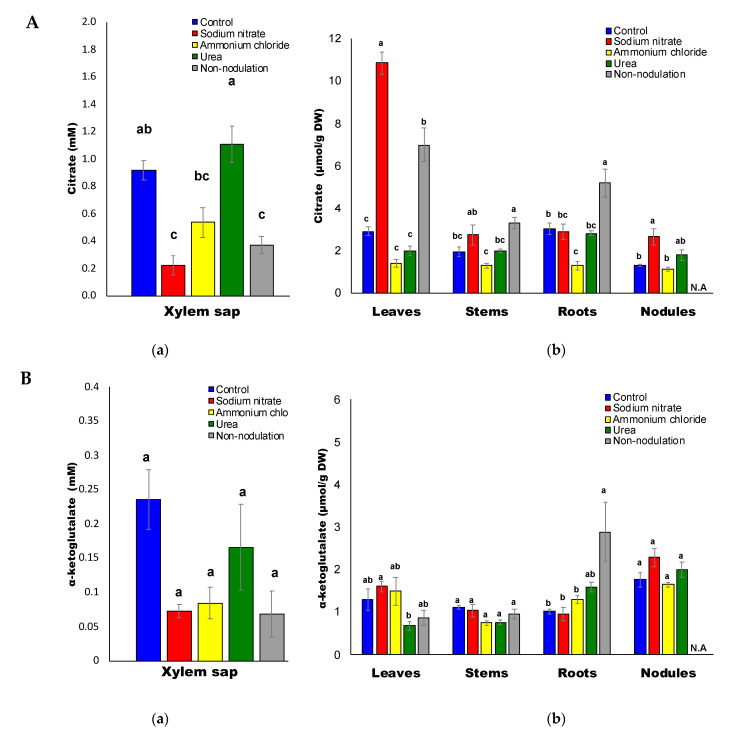
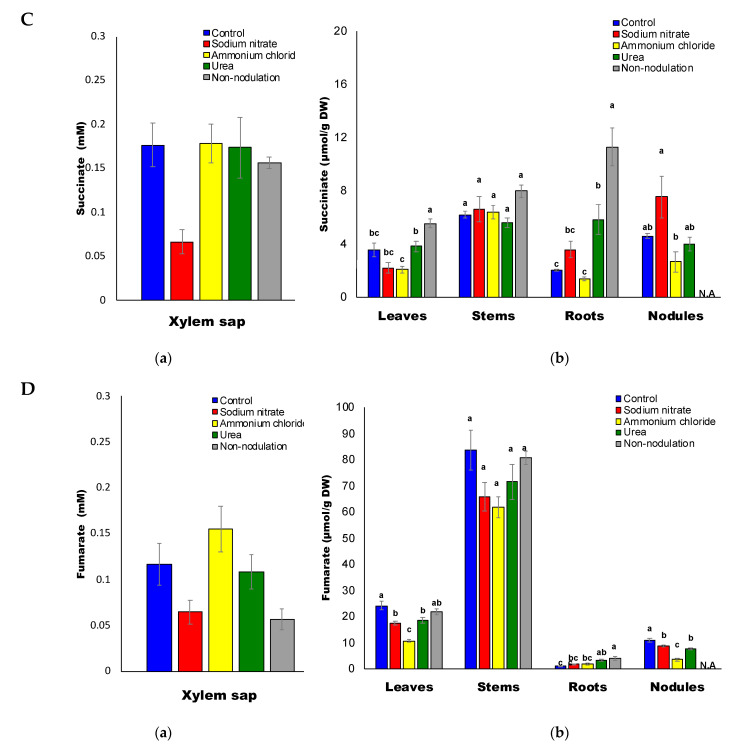
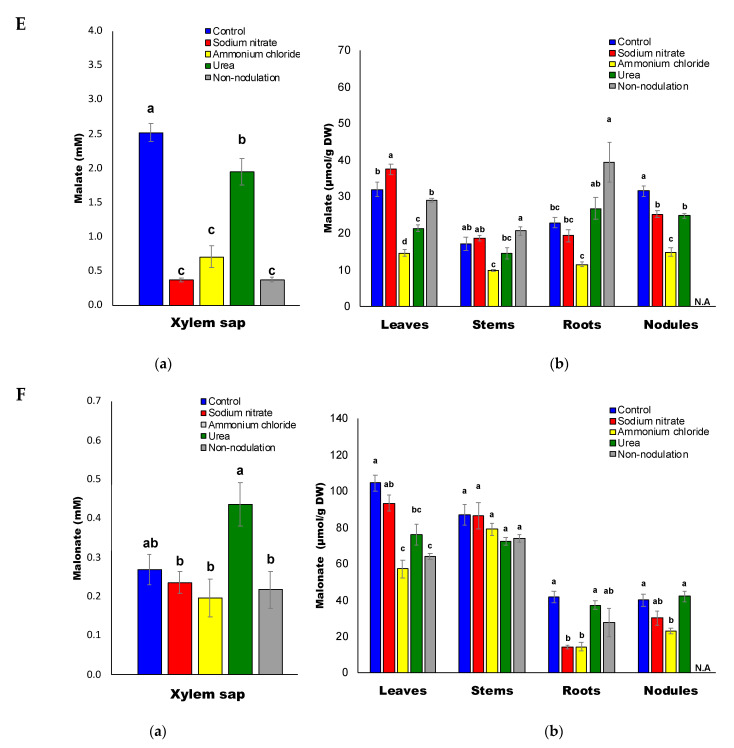
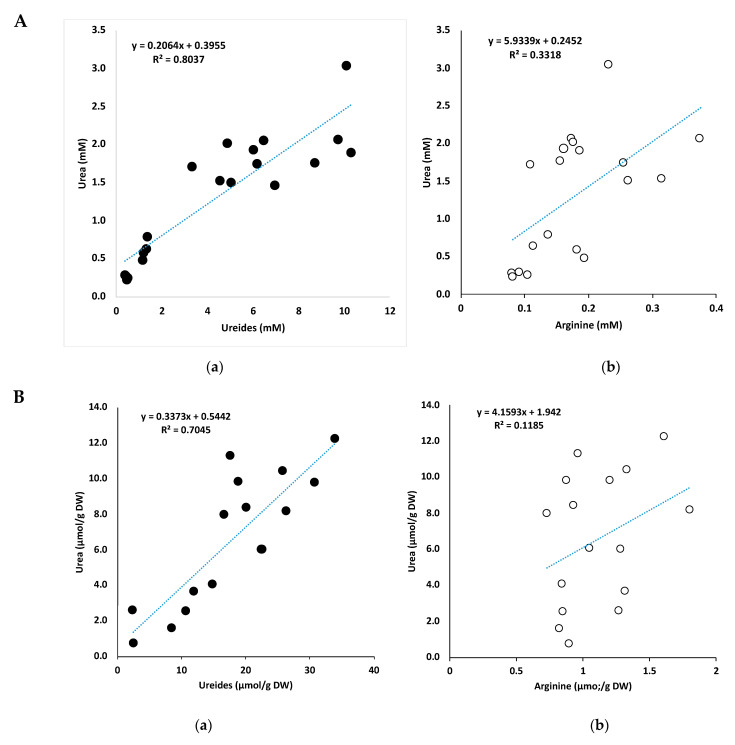
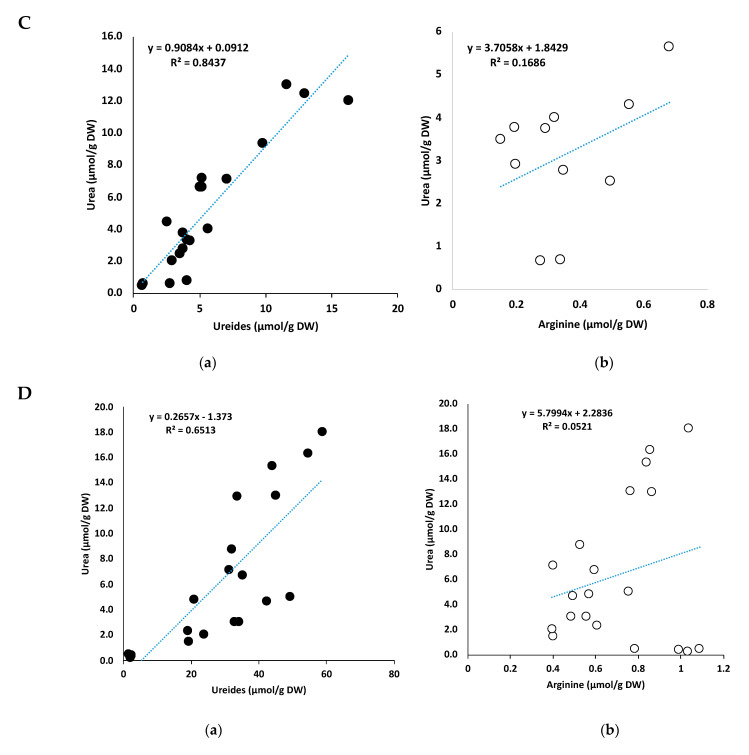
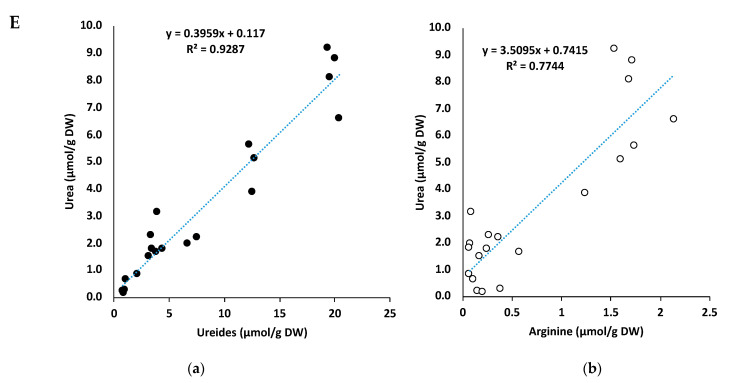
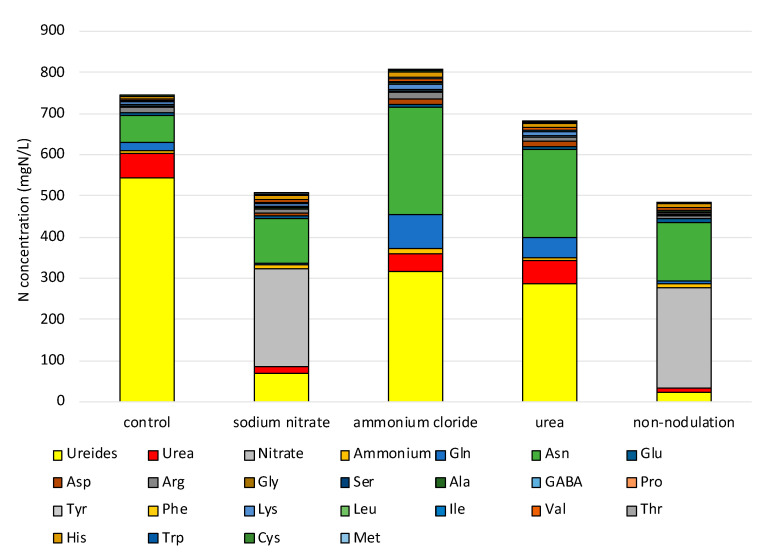
Soybean (Glycine max (L.) Merr.) plants form root nodules and fix atmospheric dinitrogen, while also utilizing the combined nitrogen absorbed from roots. In this study, nodulated soybean plants were supplied with 5 mM N nitrate, ammonium, or urea for 3 days, and the changes in metabolite concentrations in the xylem sap and each organ were analyzed. The ureide concentration in the xylem sap was the highest in the control plants that were supplied with an N-free nutrient solution, but nitrate and asparagine were the principal compounds in the xylem sap with nitrate treatment. The metabolite concentrations in both the xylem sap and each organ were similar between the ammonium and urea treatments. Considerable amounts of urea were present in the xylem sap and all the organs among all the treatments. Positive correlations were observed between the ureides and urea concentrations in the xylem sap as well as in the roots and leaves, although no correlations were observed between the urea and arginine concentrations, suggesting that urea may have originated from ureide degradation in soybean plants, possibly in the roots. This is the first finding of the possibility of ureide degradation to urea in the underground organs of soybean plants.

Keywords: amino acid; ammonia; arginine; nitrate; nodule; soybean; urea; ureide.


Conflict of interest statement

The authors declare that the research was conducted in the absence of any commercial or financial relationships that could be construed as a potential conflict of interest.

Figures

Figure 1
Figure 1
A model of ureide synthesis in the nodules and ureide degradation in soybean. GS: glutamine synthetase; GOGAT: glutamate synthase; XDH: xanthine dehydrogenase; Xan: xanthine; HIU: hydroxyisourate; OHCU: 2-oxo-4-hydroxy-4-carboxy-5-ureidoimidazoline; UGlyAH: ureidoglycine aminohydrolase.
Figure 2
Figure 2
The volume of xylem sap (a) and dry weight (b) of soybeans after 3 d of N treatment 23 DAP. Different letters above the bars indicate significant differences (p < 0.05) by Tukey’s test. Error bars indicate standard error (SE) from the four plants.
Figure 3
Figure 3
(A) Nitrate concentrations in the xylem sap (a) and in each part (b) of the soybean plant. (B) Ammonium concentrations in the xylem sap (a) and in each part (b) of the soybean plant. N.A: not available; N.D: not detected.
Figure 3
Figure 3
(A) Nitrate concentrations in the xylem sap (a) and in each part (b) of the soybean plant. (B) Ammonium concentrations in the xylem sap (a) and in each part (b) of the soybean plant. N.A: not available; N.D: not detected.
Figure 4
Figure 4
(A) Ureide concentrations in the xylem sap (a) and in each part (b) of the soybean plant. (B) Urea concentrations in the xylem sap (a) and in each part (b) of the soybean plant.
Figure 4
Figure 4
(A) Ureide concentrations in the xylem sap (a) and in each part (b) of the soybean plant. (B) Urea concentrations in the xylem sap (a) and in each part (b) of the soybean plant.
Figure 5
Figure 5
(A) Glutamine concentrations in the xylem sap (a) and each part (b) of the soybean plant. (B) Asparagine concentrations in the xylem sap (a) and in each part (b) of the soybean plant. (C) Glutamate concentrations in the xylem sap (a) and in each part (b) of the soybean plant. (D) Aspartate concentrations in the xylem sap (a) and in each part (b) of the soybean plant. (E) Arginine concentrations in the xylem sap (a) and in each part (b) of the soybean plant. N.A: not available.
Figure 5
Figure 5
(A) Glutamine concentrations in the xylem sap (a) and each part (b) of the soybean plant. (B) Asparagine concentrations in the xylem sap (a) and in each part (b) of the soybean plant. (C) Glutamate concentrations in the xylem sap (a) and in each part (b) of the soybean plant. (D) Aspartate concentrations in the xylem sap (a) and in each part (b) of the soybean plant. (E) Arginine concentrations in the xylem sap (a) and in each part (b) of the soybean plant. N.A: not available.
Figure 6
Figure 6
(A) Sucrose concentrations in the xylem sap (a) and in each part (b) of the soybean plant. (B) Glucose concentrations in the xylem sap (a) and in each part (b) of the soybean plant. (C) Fructose concentrations in the xylem sap (a) and in each part (b) of the soybean plant. (D) Myo-inositol concentrations in the xylem sap (a) and in each part (b) of the soybean plant. N.A: not available.
Figure 6
Figure 6
(A) Sucrose concentrations in the xylem sap (a) and in each part (b) of the soybean plant. (B) Glucose concentrations in the xylem sap (a) and in each part (b) of the soybean plant. (C) Fructose concentrations in the xylem sap (a) and in each part (b) of the soybean plant. (D) Myo-inositol concentrations in the xylem sap (a) and in each part (b) of the soybean plant. N.A: not available.
Figure 7
Figure 7
(A) Citrate concentrations in the xylem sap (a) and in each part (b) of the soybean plant. (B). α-Ketoglutarate concentrations in the xylem sap (a) and in each part (b) of the soybean plant. (C) Succinate concentrations in the xylem sap (a) and in each part (b) of the soybean plant. (D) Fumarate concentrations in the xylem sap (a) and in each part (b) of the soybean plant. (E) Malate concentrations in the xylem sap (a) and in each part (b) of the soybean plant. (F) Malonate concentrations in the xylem sap (a) and in each part (b) of the soybean plant. N.A: not available.
Figure 7
Figure 7
(A) Citrate concentrations in the xylem sap (a) and in each part (b) of the soybean plant. (B). α-Ketoglutarate concentrations in the xylem sap (a) and in each part (b) of the soybean plant. (C) Succinate concentrations in the xylem sap (a) and in each part (b) of the soybean plant. (D) Fumarate concentrations in the xylem sap (a) and in each part (b) of the soybean plant. (E) Malate concentrations in the xylem sap (a) and in each part (b) of the soybean plant. (F) Malonate concentrations in the xylem sap (a) and in each part (b) of the soybean plant. N.A: not available.
Figure 8
Figure 8
(A) Correlations between the concentrations of ureides and urea (a) and arginine and urea (b) in the soybean xylem sap. (B) Correlations between the concentrations of ureides and urea (a) and arginine and urea (b) in the soybean nodules. (C) Correlations between the concentrations of ureides and urea (a) and arginine and urea (b) in the soybean roots. (D) Correlations between the concentrations of ureides and urea (a) and arginine and urea (b) in the soybean stems. (E) Correlations between the concentrations of ureides and urea (a) and arginine and urea (b) in the soybean leaves.
Figure 8
Figure 8
(A) Correlations between the concentrations of ureides and urea (a) and arginine and urea (b) in the soybean xylem sap. (B) Correlations between the concentrations of ureides and urea (a) and arginine and urea (b) in the soybean nodules. (C) Correlations between the concentrations of ureides and urea (a) and arginine and urea (b) in the soybean roots. (D) Correlations between the concentrations of ureides and urea (a) and arginine and urea (b) in the soybean stems. (E) Correlations between the concentrations of ureides and urea (a) and arginine and urea (b) in the soybean leaves.
Figure 9
Figure 9
Nitrogen concentrations of N compounds in xylem sap of soybean.

Similar articles

Cited by

References

    1. Gibson A.H., Harper J.E. Nitrate effect on nodulation of soybean by Bradyrhizobium japonicum. Crop Sci. 1985;25:497–501. doi: 10.2135/cropsci1985.0011183X002500030015x. - DOI
    1. Streeter J.G. Inhibition of legume nodule formation and N2 fixation by nitrate. CRC Crit. Rev. Plant Sci. 1988;7:1–23. doi: 10.1080/07352688809382257. - DOI
    1. Imsande J. Inhibition of nodule development in soybean by nitrate or reduced nitrogen. J. Exp. Bot. 1986;37:348–355. doi: 10.1093/jxb/37.3.348. - DOI
    1. Ohyama T., Fujikake H., Yashima H., Tanabata S., Ishikawa S., Sato T. Effect of nitrate on nodulation and nitrogen fixation of soybean. In: El-Shemy H.A., editor. Soybean Physiology and Biochemistry. InTech; Rijeka, Croatia: 2012. pp. 333–363.
    1. Harper J.E. Soybeans: Improvement, Production and Uses. 2nd ed. Agronomy Monograph; Madison, WI, USA: 1987. Nitrogen metabolism; pp. 497–533.

LinkOut - more resources