. 2021 Apr 27;10(9):1889.
doi: 10.3390/jcm10091889.

Combined Inhibition of TGF-β1-Induced EMT and PD-L1 Silencing Re-Sensitizes Hepatocellular Carcinoma to Sorafenib Treatment

Affiliations

Combined Inhibition of TGF-β1-Induced EMT and PD-L1 Silencing Re-Sensitizes Hepatocellular Carcinoma to Sorafenib Treatment

Ritu Shrestha et al. J Clin Med. .

Abstract

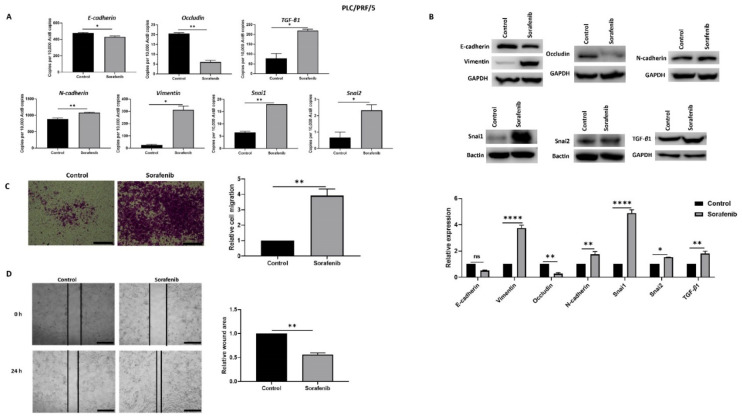
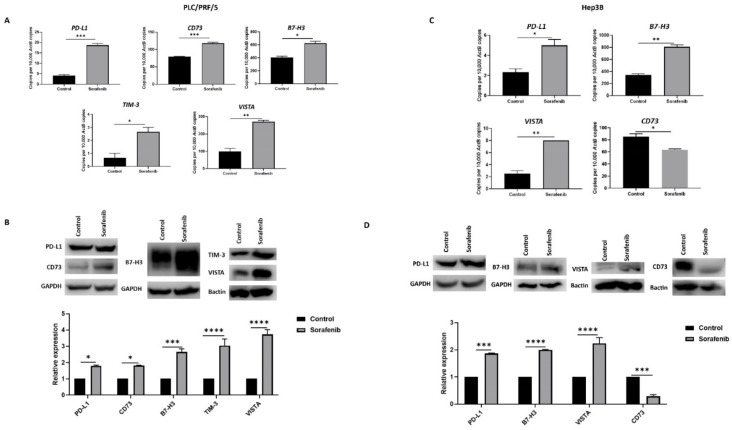
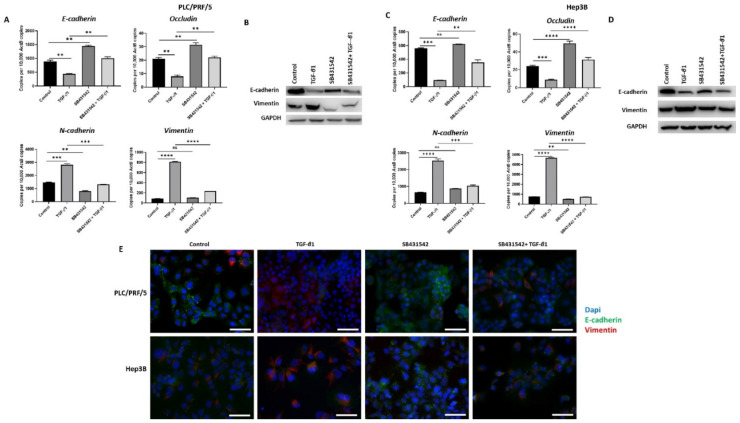
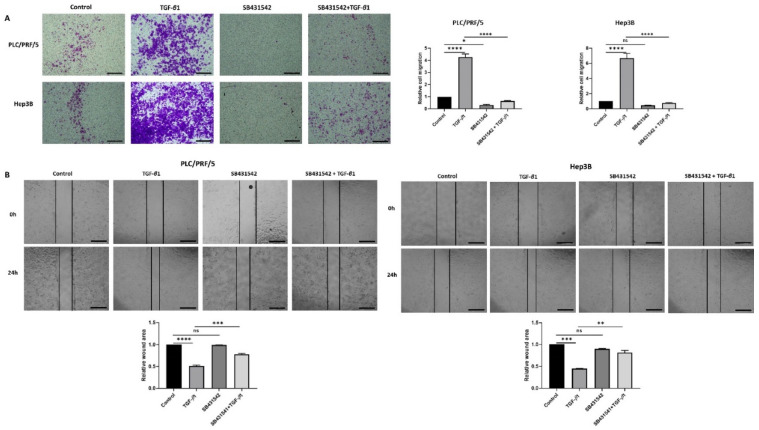
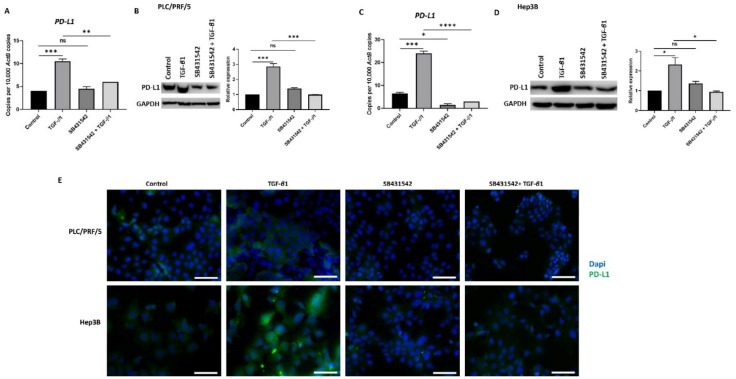
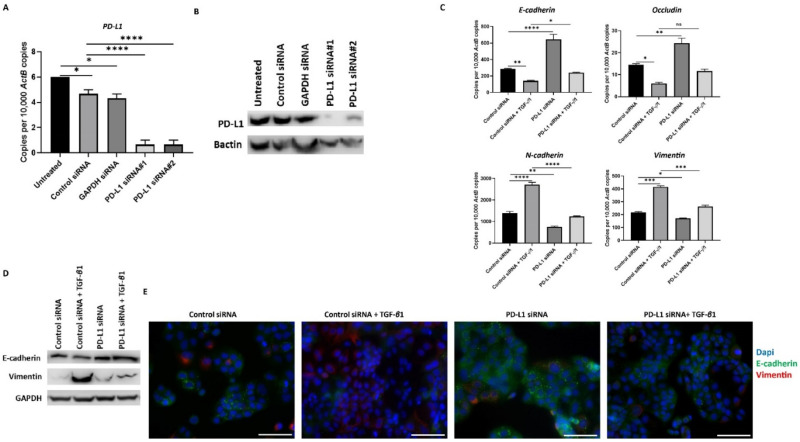
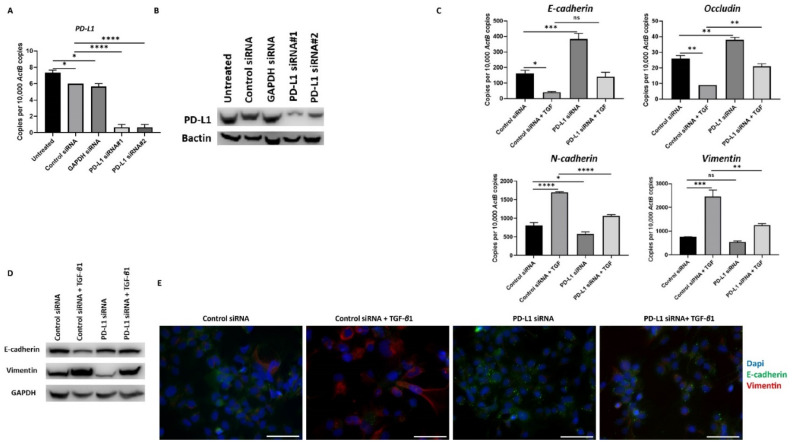
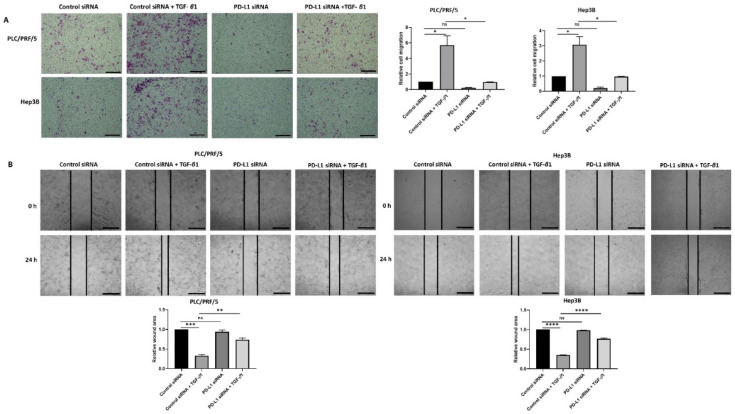
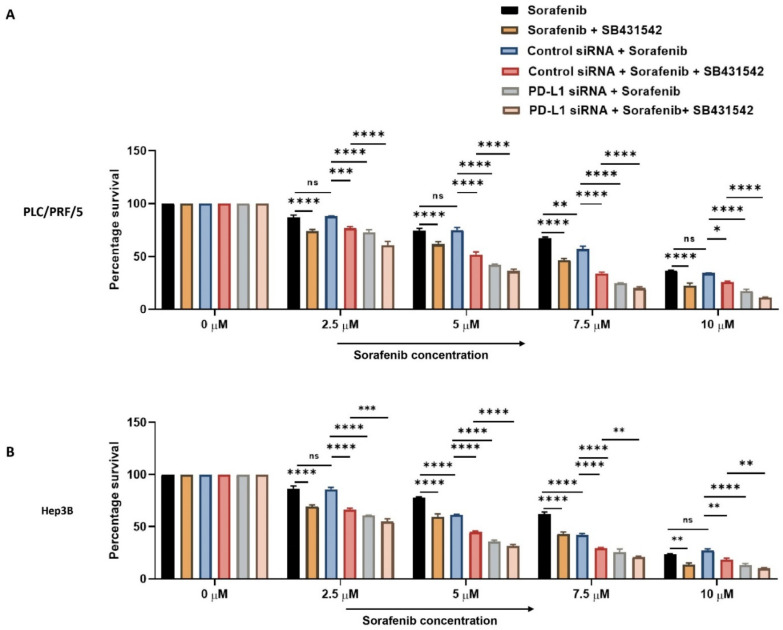
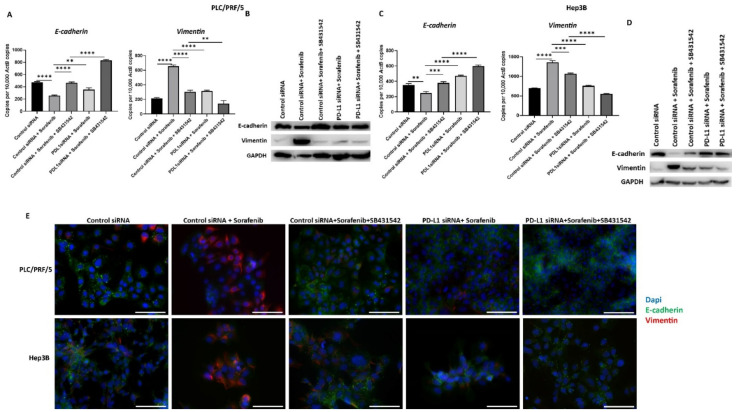
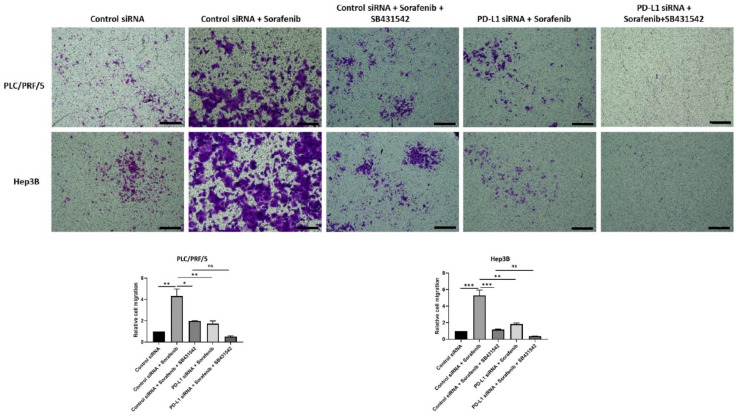
Hepatocellular carcinoma (HCC) is the most common type of primary hepatic malignancy. HCC is one of the leading causes of cancer deaths worldwide. The oral multi-tyrosine kinase inhibitor Sorafenib is the standard first-line therapy in patients with advanced unresectable HCC. Despite the significant survival benefit in HCC patients post treatment with Sorafenib, many patients had progressive disease as a result of acquiring drug resistance. Circumventing resistance to Sorafenib by exploring and targeting possible molecular mechanisms and pathways is an area of active investigation worldwide. Epithelial-to-mesenchymal transition (EMT) is a cellular process allowing epithelial cells to assume mesenchymal traits. HCC tumour cells undergo EMT to become immune evasive and develop resistance to Sorafenib treatment. Immune checkpoint molecules control immune escape in many tumours, including HCC. The aim of this study is to investigate whether combined inhibition of EMT and immune checkpoints can re-sensitise HCC to Sorafenib treatment. Post treatment with Sorafenib, HCC cells PLC/PRF/5 and Hep3B were monitored for induction of EMT and immune checkpoint molecules using quantitative reverse transcriptase (qRT)- PCR, western blot, immunofluorescence, and motility assays. The effect of combination treatment with SB431542, a specific inhibitor of the transforming growth factor (TGF)-β receptor kinase, and siRNA mediated knockdown of programmed cell death protein ligand-1 (PD-L1) on Sorafenib resistance was examined using a cell viability assay. We found that three days of Sorafenib treatment activated EMT with overexpression of TGF-β1 in both HCC cell lines. Following Sorafenib exposure, increase in the expression of PD-L1 and other immune checkpoints was observed. SB431542 blocked the TGF-β1-mediated EMT in HCC cells and also repressed PD-L1 expression. Likewise, knockdown of PD-L1 inhibited EMT. Moreover, the sensitivity of HCC cells to Sorafenib was enhanced by combining a blockade of EMT with SB431542 and knockdown of PD-L1 expression. Sorafenib-induced motility was attenuated with the combined treatment of SB431542 and PD-L1 knockdown. Our findings indicate that treatment with Sorafenib induces EMT and expression of immune checkpoint molecules, which contributes to Sorafenib resistance in HCC cells. Thus, the combination treatment strategy of inhibiting EMT and immune checkpoint molecules can re-sensitise HCC cells to Sorafenib.

Keywords: EMT; PD-L1; hepatocellular carcinoma; immune checkpoint; sorafenib.


Conflict of interest statement

The authors declare no conflict of interest.

Figures

Figure 1
Figure 1
PLC/PRF/5 cells undergo EMT after Sorafenib treatment. (A) qRT-PCR revealed decrease in E-cadherin and Occludin and increase in TGF-β1, N-cadherin, Vimentin, Snai1, and Snai2 after treatment with 6.965 µM Sorafenib for 72 h. (B) Western blot analysis showed downregulation of E-cadherin and Occludin and upregulation of Vimentin, N-cadherin, Snai1, Snai2, and TGF-β1 upon treatment with Sorafenib. GAPDH and Bactin were used as loading controls. (C) The migratory capability of PLC/PRF/5 cells was enhanced upon treatment with Sorafenib as revealed by the transwell migration assay (scale bar = 500 µm). The number of motile cells was directly proportional to the absorbance of Crystal Violet staining. (D) Wound healing assay (scale bar = 500 µm) showed higher migratory capacity of Sorafenib treated PLC/PRF/5 cells. Quantitative analysis of the wound area after 24 h Sorafenib treatment relative to the starting wound area at 0 h (n = 3, * p < 0.05, ** p < 0.01, **** p < 0.001).
Figure 2
Figure 2
Sorafenib treatment induces immune checkpoint expression in HCC cells. (A) qRT-PCR demonstrated upregulation of immune checkpoint molecules PD-L1, CD73, B7-H3, VISTA, and TIM-3 in PLC/PRF/5 cells upon treatment with Sorafenib. (B) Western blot analysis revealed increased expression of PD-L1, CD73, B7-H3, VISTA, and TIM-3 in PLC/PRF/5 cells upon treatment with Sorafenib. GAPDH and Bactin were used as loading control. (C) qRT-PCR demonstrated upregulation of immune checkpoint molecules PD-L1, B7-H3, and VISTA and downregulation of CD73 in Hep3B cells treated with Sorafenib. (D) Western blot analysis revealed increased expression of PD-L1, B7-H3, and VISTA and decreased expression of CD73 with minimal expression of TIM-3 in Hep3B cells post Sorafenib treatment. GAPDH and Bactin were used as loading control (n = 3, * p < 0.05, ** p < 0.01, *** p < 0.005, **** p < 0.001).
Figure 3
Figure 3
SB431542 inhibits TGF-β1-mediated EMT in HCC cells. (A) qRT-PCR revealed an increase in E-cadherin and Occludin and a decrease in N-cadherin and Vimentin expression and (B) western blot showed an increase in E-cadherin and reduction in Vimentin following TGF-β1 and SB431542 treatments compared with cells treated with TGF-β1 alone in PLC/PRF/5 cells. GAPDH was used as the loading control. (C) qRT-PCR revealed increased expression of E-cadherin and Occludin and lower expression of N-cadherin and Vimentin and (D) western blot analysis demonstrated higher expression of E-cadherin and lower expression of Vimentin following treatment with TGF-β1 and SB431542 in Hep3B cells. GAPDH was used as the loading control. (E) Fluorescence microscopy demonstrated upregulation of E-cadherin and downregulation of Vimentin in cells treated with TGF-β1 and SB431542 compared with cells treated with TGF-β1 alone in both PLC/PRF/5 and Hep3B cells (scale bar = 200 µm) (n = 3, ** p < 0.01, *** p < 0.005, **** p < 0.001, ns: not significant).
Figure 4
Figure 4
SB431542 reverses migratory capability of TGF-β1-stimulated HCC cells. (A) Transwell migration assay revealed reduced migratory capability of PLC/PRF/5 and Hep3B cell lines upon treatment with SB431542 despite stimulation with TGF-β1 (scale bar = 500 µm). Quantitative analysis of motile cells was determined by measuring the absorbance of Crystal Violet staining. (B) Wound healing assay confirmed decreased motility of PLC/PRF/5 and Hep3B cells upon treatment with SB431542 despite stimulation with TGF-β1 (scale bar = 500 µm). Wound area was analysed with TGF-β1, SB431542, or combination treatment for 24 h relative to the starting wound area at 0 h (n = 3, * p < 0.05, ** p < 0.01, *** p < 0.005, **** p < 0.001).
Figure 5
Figure 5
SB431542 inhibits TGF-β1-induced expression of PD-L1 in HCC cells. (A) qRT-PCR and (B) western blot analysis revealed reduced expression of PD-L1 in PLC/PRF/5 cells after treatment with TGF-β1 and SB431542. GAPDH was used as loading. (C) qRT-PCR and (D) western blot analysis revealed reduced expression of PD-L1 following SB431542 treatment in Hep3B cells. GAPDH was used as loading control. (E) Fluorescence microscopy revealed reduced expression of PD-L1 following SB431542 treatment in PLC/PRF/5 and Hep3B cells exposed to TGF-β1 (scale bar = 200 µm) (n = 3, * p < 0.05, ** p < 0.01, *** p < 0.005, **** p < 0.001).
Figure 6
Figure 6
Silencing of PD-L1 reverses TGF-β1-mediated EMT in PLC/PRF/5 cells. Transfection of HCC cells with two specific PD-L1 siRNA effectively knockdown PD-L1 expression, as demonstrated by (A) qRT-PCR and (B) western blot analysis. Bactin was utilised as the loading control. (C) qRT-PCR demonstrated that silencing of PD-L1 resulted in upregulation of E-cadherin and Occludin along with downregulation of N-cadherin and Vimentin expression in PLC/PRF/5 cells. (D) Western blot analysis showed increase in E-cadherin and decrease in Vimentin upon knockdown of PD-L1 in PLC/PRF/5 cells. GAPDH was utilised as loading control in western blot analysis. (E) Fluorescence microscopy showed elevation of E-cadherin and decline of Vimentin following PD-L1 knockdown in PLC/PRF/5 cells (scale bar = 200 µm) (n = 3, * p < 0.05, ** p < 0.01, *** p < 0.005, **** p < 0.001).
Figure 7
Figure 7
Silencing of PD-L1 reverses TGF-β1-mediated EMT in Hep3B cells. (A,B) Transfection of Hep3B cells with two specific PD-L1 siRNA effectively knockdown PD-L1 expression as demonstrated by qRT-PCR and western blot analysis. Bactin was used as the loading control. Silencing of PD-L1 resulted in increased E-cadherin and Occludin expression along with reduction in N-cadherin and Vimentin expression in Hep3B cells as assessed by (C) qRT-PCR and (D) western blot analysis. GAPDH was utilised as the loading control. (E) Fluorescence microscopy showed an increase in E-cadherin and a decrease in Vimentin following PD-L1 knockdown in Hep3B cells (scale bar = 200 µm). (n = 3, * p < 0.05, ** p < 0.01, *** p < 0.005, **** p < 0.001).
Figure 8
Figure 8
Silencing of PD-L1 reverses migratory ability of TGF-β1-stimulated HCC cells. (A) Transwell migration assay revealed reduced migratory capability of PLC/PRF/5 and Hep3B cells following PD-L1 knockdown despite stimulation with TGF-β1 (scale bar = 500 µm). The number of motile cells was determined by measuring the absorbance of Crystal Violet staining. (B) Decreased motility of PLC/PRF/5 and Hep3B cells following PD-L1 knockdown despite stimulation with TGF-β1 was validated by the wound healing assay (scale bar = 500 µm). The analysis of the wound area after 24 h treatment with siRNA alone or when combined with TGF-β1 relative to the starting wound area at 0 h (n = 3, * p < 0.05, ** p < 0.01, *** p < 0.005, **** p < 0.001).
Figure 9
Figure 9
Combination treatment of PD-L1 knockdown with SB431542 can overcome Sorafenib resistance in HCC cells. Cell viability assay revealed that percentage survival of cells significantly reduced with the combination of increasing concentrations of Sorafenib with knockdown of PD-L1 and SB431542 compared to Sorafenib alone or Sorafenib with either SB431542 or PD-L1 knockdown or control siRNA treatment (A) PLC/PRF/5 and (B) Hep3B cells (n = 3, * p < 0.05, ** p < 0.01, *** p < 0.005, **** p < 0.001).
Figure 10
Figure 10
Combination treatment of Sorafenib with PD-L1 knockdown and SB431542 can reverse Sorafenib-driven EMT in HCC cells. Combination treatment of Sorafenib with PD-L1 knockdown and SB431542 elevated E-cadherin and downregulated Vimentin in PLC/PRF/5 cells, as demonstrated by (A) qRT-PCR and (B) western blot analysis. GAPDH was used as the loading control. Similar combination treatment of Sorafenib with PD-L1 knockdown and SB431542 resulted in upregulation of E-cadherin and downregulation of Vimentin in Hep3B cells, as demonstrated by (C) qRT-PCR and (D) western blot analysis. GAPDH was used as the loading control. (E) Fluorescence microscopy revealed upregulation of E-cadherin and downregulation of Vimentin in both PLC/PRF/5 and Hep3B cells following combination treatment of Sorafenib with PD-L1 knockdown and SB431542 (scale bar = 200 µm) (n = 3, ** p < 0.01, *** p < 0.005, **** p < 0.001).
Figure 11
Figure 11
Combination treatment of Sorafenib with PD-L1 knockdown and SB431542 can reverse Sorafenib-induced migration in HCC cells. Migratory ability of PLC/PRF/5 and Hep3B cells was attenuated by combination treatment of Sorafenib with PD-L1 knockdown and SB431542, as revealed by images of the transwell migration assay (scale bar = 500 µm). The number of motile cells was determined by measuring the absorbance of Crystal Violet staining (n = 3, * p < 0.05, ** p < 0.01, *** p < 0.005).

Similar articles

Cited by

References

    1. Bray F., Ferlay J., Soerjomataram I., Siegel R.L., Torre L.A., Jemal A. Global cancer statistics 2018: GLOBOCAN estimates of incidence and mortality worldwide for 36 cancers in 185 countries. CA Cancer J. Clin. 2018;68:394–424. doi: 10.3322/caac.21492. - DOI - PubMed
    1. Chacko S., Samanta S. Hepatocellular carcinoma: A life-threatening disease. Biomed. Pharmacother. 2016;84:1679–1688. doi: 10.1016/j.biopha.2016.10.078. - DOI - PubMed
    1. El-Serag H.B., Rudolph K.L. Hepatocellular carcinoma: Epidemiology and molecular carcinogenesis. Gastroenterology. 2007;132:2557–2576. doi: 10.1053/j.gastro.2007.04.061. - DOI - PubMed
    1. Llovet J.M., Ricci S., Mazzaferro V., Hilgard P., Gane E., Blanc J.F., de Oliveira A.C., Santoro A., Raoul J.L., Forner A., et al. Sorafenib in advanced hepatocellular carcinoma. N. Engl. J. Med. 2008;359:378–390. doi: 10.1056/NEJMoa0708857. - DOI - PubMed
    1. Mir N., Jayachandran A., Dhungel B., Shrestha R., Steel J.C. Epithelial-to-Mesenchymal Transition: A Mediator of Sorafenib Resistance in Advanced Hepatocellular Carcinoma. Curr. Cancer Drug Targets. 2017;17:698–706. doi: 10.2174/1568009617666170427104356. - DOI - PubMed

LinkOut - more resources